Arid Land Geography ›› 2024, Vol. 47 ›› Issue (2): 270-280.doi: 10.12118/j.issn.1000-6060.2023.104
• Urban Geography • Previous Articles Next Articles
SHI Yufang( ), NIU Yu()
Received:2023-03-07
Revised:2023-04-12
Online:2024-02-25
Published:2024-03-14
Contact:
NIU Yu
E-mail:shiyufang@xust.edu.cn;21202230105@stu.xust.edu.cn
SHI Yufang, NIU Yu. Resilience spatial correlation network and its influencing factors in Guanzhong Plain urban agglomeration[J].Arid Land Geography, 2024, 47(2): 270-280.
Tab. 1
Comprehensive evaluation index system of urban resilience"
| 目标层 | 准则层 | 指标层 | 指标属性 | 权重 |
|---|---|---|---|---|
| 城市韧性 | 经济韧性 | 人均GDP/元 | 正 | 0.034 |
| 第三产业GDP占比/% | 正 | 0.025 | ||
| 城镇居民人均可支配收入/农村居民人均可支配收入/% | 负 | 0.017 | ||
| 人均固定资产投资额/元 | 正 | 0.054 | ||
| 人均社会消费品零售总额/元 | 正 | 0.051 | ||
| 职工平均工资/元 | 正 | 0.031 | ||
| 进出口贸易额占GDP比重/% | 正 | 0.138 | ||
| 社会韧性 | 人口自然增长率/% | 正 | 0.025 | |
| 社会保障和就业支出占财政支出比重/% | 正 | 0.015 | ||
| 城市教育支出占财政支出比重/% | 正 | 0.022 | ||
| 公共管理、社会保障和社会组织从业人员占比/% | 正 | 0.025 | ||
| 每万人普通高校在校生人数/人 | 正 | 0.119 | ||
| 每万人卫生技术人员人数/人 | 正 | 0.034 | ||
| 失业率/% | 负 | 0.025 | ||
| 生态环境韧性 | 建成区绿地覆盖率/% | 正 | 0.009 | |
| 人均园林绿地面积/m2 | 正 | 0.012 | ||
| 工业废水排放量/GDP/t·(104元)-1 | 负 | 0.003 | ||
| 工业SO2排放量/GDP/t·(108元)-1 | 负 | 0.004 | ||
| 生活垃圾无害化处理率/% | 正 | 0.006 | ||
| 城市污水处理率/% | 正 | 0.014 | ||
| 固体废弃物综合利用率/% | 正 | 0.046 | ||
| 基础设施韧性 | 公路线网密度/km·km-2 | 正 | 0.024 | |
| 每万人公共汽车数/辆 | 正 | 0.080 | ||
| 每万人拥有公共厕所/座 | 正 | 0.093 | ||
| 每万人医院病床数/张 | 正 | 0.024 | ||
| 燃气普及率/% | 正 | 0.009 | ||
| 建成区排水管道密度/km·km-2 | 正 | 0.024 | ||
| 互联网普及率/% | 正 | 0.038 |
Tab. 2
Comprehensive resilience level of Guanzhong Plain urban agglomeration"
| 城市 | 2011年 | 2012年 | 2013年 | 2014年 | 2015年 | 2016年 | 2017年 | 2018年 | 2019年 | 2020年 | 平均值 |
|---|---|---|---|---|---|---|---|---|---|---|---|
| 西安市 | 0.5346 | 0.5525 | 0.5905 | 0.6251 | 0.6491 | 0.6536 | 0.6488 | 0.6995 | 0.7115 | 0.7002 | 0.6365 |
| 宝鸡市 | 0.2005 | 0.2216 | 0.2490 | 0.2673 | 0.3051 | 0.3379 | 0.3678 | 0.4010 | 0.4282 | 0.4449 | 0.3219 |
| 铜川市 | 0.2311 | 0.2558 | 0.2709 | 0.2955 | 0.3183 | 0.3652 | 0.3447 | 0.3807 | 0.4436 | 0.4801 | 0.3386 |
| 渭南市 | 0.1440 | 0.1721 | 0.1769 | 0.1888 | 0.2066 | 0.2452 | 0.2664 | 0.2984 | 0.3303 | 0.3451 | 0.2374 |
| 商洛市 | 0.1334 | 0.1423 | 0.1399 | 0.1609 | 0.1706 | 0.1698 | 0.2150 | 0.2317 | 0.2639 | 0.2872 | 0.1915 |
| 咸阳市 | 0.2125 | 0.2389 | 0.2507 | 0.2688 | 0.2928 | 0.3195 | 0.3515 | 0.3714 | 0.3937 | 0.4199 | 0.3120 |
| 天水市 | 0.1608 | 0.1618 | 0.1769 | 0.1845 | 0.2031 | 0.2242 | 0.2410 | 0.2536 | 0.2624 | 0.2903 | 0.2159 |
| 平凉市 | 0.1397 | 0.1550 | 0.1682 | 0.1772 | 0.1934 | 0.2069 | 0.2225 | 0.2485 | 0.2658 | 0.3026 | 0.2080 |
| 庆阳市 | 0.1436 | 0.1644 | 0.1780 | 0.1957 | 0.2122 | 0.2333 | 0.2223 | 0.2372 | 0.2357 | 0.2422 | 0.2064 |
| 运城市 | 0.2128 | 0.2174 | 0.2613 | 0.2557 | 0.2510 | 0.2669 | 0.2816 | 0.2737 | 0.3000 | 0.2929 | 0.2613 |
| 临汾市 | 0.1875 | 0.1980 | 0.2060 | 0.2107 | 0.2260 | 0.2342 | 0.2400 | 0.2527 | 0.2689 | 0.2779 | 0.2302 |
| 平均值 | 0.2091 | 0.2254 | 0.2426 | 0.2573 | 0.2753 | 0.2961 | 0.3092 | 0.3317 | 0.3549 | 0.3712 | 0.2873 |
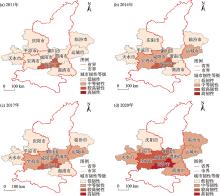
Fig. 1
Evolution of resilience spatial pattern of Guanzhong Plain urban agglomeration"

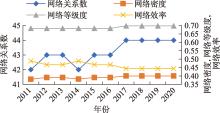
Fig. 2
Structural indicators of resilience spatial association network of Guanzhong Plain urban agglomeration from 2011 to 2020"

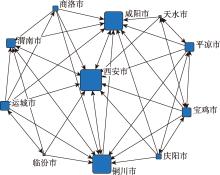
Fig. 3
Resilience spatial network of Guanzhong Plain urban agglomeration in 2020"

Tab. 3
Centrality analysis of resilience spatial association network in Guanzhong Plain urban agglomeration from 2011 to 2020"
| 城市 | 点度中心度 | 接近中心度 | 中介中心度 | |||||||||||
|---|---|---|---|---|---|---|---|---|---|---|---|---|---|---|
| 2011年 | 2014年 | 2017年 | 2020年 | 2011年 | 2014年 | 2017年 | 2020年 | 2011年 | 2014年 | 2017年 | 2020年 | |||
| 西安市 | 10 | 10 | 10 | 10 | 100.00 | 100.00 | 100.00 | 100.00 | 19.81 | 19.81 | 17.78 | 17.78 | ||
| 宝鸡市 | 6 | 6 | 6 | 6 | 71.43 | 71.43 | 71.43 | 71.43 | 1.11 | 1.11 | 1.11 | 1.11 | ||
| 铜川市 | 9 | 9 | 9 | 9 | 90.91 | 90.91 | 90.91 | 90.91 | 13.15 | 13.15 | 11.11 | 11.11 | ||
| 渭南市 | 5 | 5 | 6 | 6 | 66.67 | 66.67 | 71.43 | 71.43 | 0.56 | 0.56 | 1.11 | 1.11 | ||
| 商洛市 | 4 | 4 | 5 | 5 | 62.50 | 62.50 | 66.67 | 66.67 | 0.00 | 0.00 | 0.00 | 0.00 | ||
| 咸阳市 | 9 | 9 | 9 | 9 | 90.91 | 90.91 | 90.91 | 90.91 | 11.67 | 11.67 | 11.11 | 11.11 | ||
| 天水市 | 4 | 4 | 4 | 4 | 62.50 | 62.50 | 62.50 | 62.50 | 0.00 | 0.00 | 0.00 | 0.00 | ||
| 平凉市 | 6 | 6 | 6 | 6 | 71.43 | 71.43 | 71.43 | 71.43 | 1.11 | 1.11 | 1.11 | 1.11 | ||
| 庆阳市 | 5 | 5 | 5 | 5 | 66.67 | 66.67 | 66.67 | 66.67 | 0.00 | 0.00 | 0.00 | 0.00 | ||
| 运城市 | 5 | 5 | 6 | 6 | 66.67 | 66.67 | 71.43 | 71.43 | 1.48 | 1.48 | 1.11 | 1.11 | ||
| 临汾市 | 3 | 3 | 4 | 4 | 58.82 | 58.82 | 62.50 | 62.50 | 0.00 | 0.00 | 0.00 | 0.00 | ||
Tab. 4
Regression analysis of the factors influencing spatial correlation of resilience in Guanzhong Plain urban agglomeration"
| 变量名称 | 非标准化回归系数 | 标准化回归系数 | 显著性概率 | 概率1 | 概率2 |
|---|---|---|---|---|---|
| 地理空间邻近差异矩阵 | 0.424 | 0.406*** | 0.000 | 0.000 | 1.000 |
| 经济发展水平差异矩阵 | -0.498 | -0.320** | 0.017 | 0.984 | 0.017 |
| 人口增速差异矩阵 | -0.182 | -0.093 | 0.102 | 0.898 | 0.102 |
| 对外开放度差异矩阵 | 0.308 | 0.214** | 0.026 | 0.026 | 0.974 |
| 政府财政支持差异矩阵 | 0.482 | 0.249** | 0.049 | 0.049 | 0.951 |
| 环境规制差异矩阵 | -0.111 | -0.055 | 0.207 | 0.793 | 0.207 |
| 交通基础设施差异矩阵 | -0.239 | -0.128* | 0.066 | 0.934 | 0.066 |
| 科学技术水平差异矩阵 | -0.319 | -0.105* | 0.053 | 0.947 | 0.053 |
| [1] |
魏冶, 修春亮. 城市网络韧性的概念与分析框架探析[J]. 地理科学进展, 2020, 39(3): 488-502.
doi: 10.18306/dlkxjz.2020.03.013 |
|
[ Wei Ye, Xiu Chunliang. Study on the concept and analytical framework of city network resilience[J]. Progress in Geography, 2020, 39(3): 488-502. ]
doi: 10.18306/dlkxjz.2020.03.013 |
|
| [2] | 李彦军, 马港, 宋舒雅. 长江中游城市群城市韧性的空间分异及演进[J]. 区域经济评论, 2022, 56(2): 88-96. |
| [ Li Yanjun, Ma Gang, Song Shuya. Spatio-temporal differentiation of urban resilience in the Mid-Yangtze River urban agglomerations[J]. Regional Economic Review, 2022, 56(2): 88-96. ] | |
| [3] | 贺山峰, 梁爽, 吴绍洪, 等. 长三角地区城市洪涝灾害韧性时空演变及其关联性分析[J]. 长江流域资源与环境, 2022, 31(9): 1988-1999. |
| [ He Shanfeng, Liang Shuang, Wu Shaohong, et al. Analysis on spatio-temporal evolution and relevance of urban flood disaster resilience in Yangtze River Delta[J]. Resources and Environment in the Yangtze Basin, 2022, 31(9): 1988-1999. ] | |
| [4] | Lu H, Zhang C, Jiao L D, et al. Analysis on the spatial-temporal evolution of urban agglomeration resilience: A case study in Chengdu-Chongqing urban agglomeration, China[J]. International Journal of Disaster Risk Reduction, 2022, 79: 103167, doi: 10.1016/j.ijdrr.2022.103167. |
| [5] |
陈晓红, 娄金男, 王颖. 哈长城市群城市韧性的时空格局演变及动态模拟研究[J]. 地理科学, 2020, 40(12): 2000-2009.
doi: 10.13249/j.cnki.sgs.2020.12.006 |
|
[ Chen Xiaohong, Lou Jinnan, Wang Ying. Evolution and dynamic simulation of the temporal-spatial pattern of urban resilience in Harbin-Changchun urban group[J]. Scientia Geographica Sinica, 2020, 40(12): 2000-2009. ]
doi: 10.13249/j.cnki.sgs.2020.12.006 |
|
| [6] | 张鹏, 于伟, 张延伟. 山东省城市韧性的时空分异及其影响因素[J]. 城市问题, 2018(9): 27-34. |
| [ Zhang Peng, Yu Wei, Zhang Yanwei. Spatial-temporal differentiation and its influencing factors of Shandong Province’s urban resilience[J]. Urban Problems, 2018(9): 27-34. ] | |
| [7] | 宁静, 朱冉, 张馨元, 等. 内蒙古区县城市韧性评价与分析[J]. 干旱区地理, 2023, 46(7): 1217-1226. |
| [ Ning Jing, Zhu Ran, Zhang Xinyuan, et al. Evaluation and analysis of urban resilience of districts and counties in Inner Mongolia[J]. Arid Land Geography, 2023, 46(7): 1217-1226. ] | |
| [8] | Li L, Zhang P, Wang C. What affects the economic resilience of China’s Yellow River Basin amid economic crisis: From the perspective of spatial heterogeneity[J]. International Journal of Environmental Research and Public Health, 2022, 19: 9024, doi: 10.3390/ijerph19159024. |
| [9] | Khan M, Wu Q, Yan S Q, et al. Factors affecting urban resilience and sustainability: Case of slum dwellers in Islamabad, Pakistan[J]. Journal of Urban Planning and Development, 2021, 147(4): 04021053, doi: 10.1061/(ASCE)UP.1943-5444.0000749. |
| [10] | Shi J, Wang X, Wang C, et al. Evaluation and influencing factors of network resilience in Guangdong-Hong Kong-Macao Greater Bay Area: A structural perspective[J]. Sustainability, 2022, 14: 8005, doi: 10.3390/su14138005. |
| [11] | 蒋辉. 中国农业经济韧性的空间网络效应分析[J]. 贵州社会科学, 2022(8): 151-159. |
| [ Jiang Hui. Analysis of the spatial network effect of China’s agricultural economic resilience[J]. Guizhou Social Sciences, 2022(8): 151-159. ] | |
| [12] | 谢会强, 杨丹, 张宽. 中国城市经济韧性的时空演化及网络结构研究[J]. 华东经济管理, 2022, 36(11): 64-74. |
| [ Xie Huiqiang, Yang Dan, Zhang Kuan. Spatio-temporal evolution and network structure of urban economic resilience in China[J]. East China Economic Management, 2022, 36(11): 64-74. ] | |
| [13] | 张明斗, 张震. 长三角城市群城市经济韧性的空间关联网络研究[J]. 地理与地理信息科学, 2023, 39(1): 69-79. |
| [ Zhang Mingdou, Zhang Zhen. Spatial correlation network of urban economic resilience in the Yangtze River Delta urban agglomeration[J]. Geography and Geo-information Science, 2023, 39(1): 69-79. ] | |
| [14] | 王璇, 史佳璐, 慈福义. 黄河流域城市群韧性度的时空演化特征[J]. 统计与决策, 2022, 38(5): 70-74. |
| [ Wang Xuan, Shi Jialu, Ci Fuyi. The spatio-temporal evolution characteristics of resilience of urban agglomerations in the Yellow River Basin[J]. Statistics and Decision, 2022, 38(5): 70-74. ] | |
| [15] | 王世亮. 内蒙古城市韧性评价及其提升策略研究[D]. 呼和浩特: 内蒙古师范大学, 2022. |
| [ Wang Shiliang. Research on urban resilience and improvement methods of Inner Mongolia[D]. Hohhot: Inner Mongolia Normal University, 2022. ] | |
| [16] | 郝辑, 张少杰. 基于熵值法的我国省际生态数据评价研究[J]. 情报科学, 2021, 39(1): 157-162. |
| [ Hao Ji, Zhang Shaojie. Evaluation of inter-provincial ecological data in China based on entropy method[J]. Information Science, 2021, 39(1): 157-162. ] | |
| [17] |
孙中瑞, 樊杰, 孙勇, 等. 中国绿色科技创新效率空间关联网络结构特征及影响因素[J]. 经济地理, 2022, 42(3): 33-43.
doi: 10.15957/j.cnki.jjdl.2022.03.004 |
|
[ Sun Zhongrui, Fan Jie, Sun Yong, et al. Structural characteristics and influencing factors of spatial correlation network of green science and technology innovation efficiency in China[J]. Economic Geography, 2022, 42(3): 33-43. ]
doi: 10.15957/j.cnki.jjdl.2022.03.004 |
|
| [18] | 李南, 李晓东, 刘想, 等. 新疆区域经济联系网络时空格局演变[J]. 干旱区地理, 2022, 45(6): 1978-1987. |
| [ Li Nan, Li Xiaodong, Liu Xiang, et al. Evolution of spatial and temporal pattern of regional economic connection network in Xinjiang[J]. Arid Land Geography, 2022, 45(6): 1978-1987. ] | |
| [19] | 贾建琦, 赵林, 高晓彤, 等. 环渤海地区包容性绿色增长效率的空间关联网络结构及其影响因素[J]. 地理与地理信息科学, 2021, 37(5): 46-54. |
| [ Jia Jianqi, Zhao Lin, Gao Xiaotong, et al. Spatial correlation network structure of inclusive green growth efficiency and its influencing factors in Bohai Rim region[J]. Geography and Geo-information Science, 2021, 37(5): 46-54. ] | |
| [20] | 岳立, 雷燕燕. 黄河流域绿色水资源效率空间关联网络构建及其演化因素[J]. 西北师大学报(社会科学版), 2022, 59(2): 62-74. |
| [ Yue Li, Lei Yanyan. Construction of spatially linked network of green water resources efficiency in the Yellow River Basin and its evolutionary factors[J]. Journal of Northwest Normal University (Social Sciences Edition), 2022, 59(2): 62-74. ] | |
| [21] | 石涛. 黄河流域城市韧性发展水平的时空演进及驱动要素分析[J]. 区域经济评论, 2022(1): 139-149. |
| [ Shi Tao. The analysis of the spatiotemporal evolution and driving factors of urban resilience in Yellow River Basin[J]. Regional Economic Review, 2022(1): 139-149. ] | |
| [22] | 高志刚, 丁煜莹. 中国西北地区城市的韧性测度及影响因素[J]. 科技导报, 2021, 39(24): 118-129. |
| [ Gao Zhigang, Ding Yuying. Measurement of urban resilience and its influencing factors of cities in northwest China[J]. Science & Technology Review, 2021, 39(24): 118-129. ] | |
| [23] | 张筱娟, 汤琪凤, 张镇. 黄河流域城市韧性空间分异特征及其影响因素识别[J]. 地域研究与开发, 2022, 41(6): 48-54. |
| [ Zhang Xiaojuan, Tang Qifeng, Zhang Zhen. Spatial differentiation characteristics and its influencing factors of urban resilience in the Yellow River Basin[J]. Areal Research and Development, 2022, 41(6): 48-54. ] |
|
||