Arid Land Geography ›› 2026, Vol. 49 ›› Issue (7): 1470-1480.doi: 10.12118/j.issn.1000-6060.2025.625
• Regional Development • Previous Articles Next Articles
LU Fengying( ), TENG Shengyu, DENG Guangyao()
Received:2025-10-08
Revised:2025-11-20
Online:2026-07-25
Published:2026-07-07
Contact:
DENG Guangyao
E-mail:lufy910@163.com;denggy@lzufe.edu.cn
LU Fengying, TENG Shengyu, DENG Guangyao. Characteristics of agricultural resilience spatial correlation network and identification of driving factors in China[J].Arid Land Geography, 2026, 49(7): 1470-1480.

Tab. 1
Indicator system for assessing agricultural resilience"
| 一级指标 | 二级指标 | 三级指标 | 属性 | 权重 |
|---|---|---|---|---|
| 经济韧性 | 农业结构 | 养殖业产值占农林牧渔业总产值的比重 | + | 0.0193 |
| 农林牧渔服务业增加值占农林牧渔业增加值的比重 | + | 0.0297 | ||
| 农产品加工业营业收入/农林牧渔业主营业务收入 | + | 0.1006 | ||
| 金融与财政支持力度 | 农业保险深度 | + | 0.1172 | |
| 农林水事务支出占农林牧渔业增加值的比重 | + | 0.1743 | ||
| 农业创新投入经费(企业投入) | + | 0.0845 | ||
| 生产韧性 | 农业生产条件 | 农作物耕种收综合机械化率 | + | 0.0176 |
| 农田灌溉水有效利用系数 | + | 0.0319 | ||
| 农业产出效率 | 农业土地产出率 | + | 0.0549 | |
| 农业劳动生产率 | + | 0.0461 | ||
| 生态韧性 | 环境压力 | 化肥投入强度 | - | 0.0110 |
| 农药投入强度 | - | 0.0083 | ||
| 生态治理 | 森林覆盖率 | + | 0.0389 | |
| 水土流失治理指数 | + | 0.0627 | ||
| 农作物成灾率 | - | 0.0028 | ||
| 社会韧性 | 人力资本 | 乡村15~64岁人口占比 | + | 0.0239 |
| 乡村医生和卫生员人数 | + | 0.0639 | ||
| 农村人均受教育年限 | + | 0.0093 | ||
| 组织建设 | 村委会成员大学专科以上文化程度占比 | + | 0.0572 | |
| 主任、书记“一肩挑”占比 | + | 0.0460 |
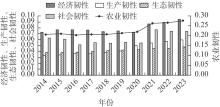
Fig. 1
Dynamic evaluation results of agricultural resilience in vary dimensions in China from 2014 to 2023"
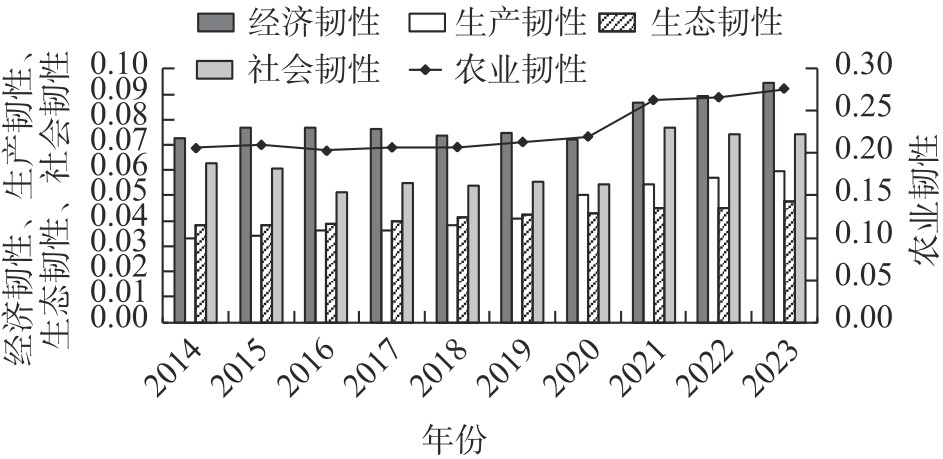
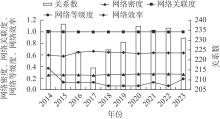
Fig. 2
Overall characteristics of agricultural resilience spatial correlation network in China from 2014 to 2023"
Tab. 2
Centrality characteristics of spatial correlation network of average agricultural resilience across all provinces (autonomous regions, municipalities) in China from 2014 to 2023"
| 省(自治区、直辖市) | 点度中心度 | 接近中心度 | 中介中心度 | |||
|---|---|---|---|---|---|---|
| 溢出 | 接收 | 溢出 | 接收 | |||
| 北京 | 24.14 | 58.62 | 24.79 | 65.91 | 3.97 | |
| 天津 | 17.24 | 13.79 | 24.37 | 46.03 | 0.12 | |
| 河北 | 20.69 | 31.03 | 27.88 | 54.72 | 0.55 | |
| 山西 | 27.59 | 44.83 | 32.22 | 59.18 | 7.22 | |
| 内蒙古 | 24.14 | 37.93 | 27.88 | 52.73 | 2.41 | |
| 辽宁 | 31.03 | 10.34 | 29.00 | 49.15 | 1.93 | |
| 吉林 | 10.34 | 6.90 | 23.97 | 45.31 | 0.00 | |
| 黑龙江 | 31.03 | 75.86 | 29.00 | 78.38 | 12.47 | |
| 上海 | 3.45 | 55.17 | 20.71 | 69.05 | 0.11 | |
| 江苏 | 10.34 | 55.17 | 25.66 | 69.05 | 4.67 | |
| 浙江 | 20.69 | 48.28 | 29.00 | 65.91 | 6.65 | |
| 安徽 | 24.14 | 51.72 | 31.87 | 67.44 | 10.12 | |
| 福建 | 24.14 | 10.34 | 31.87 | 43.28 | 1.60 | |
| 江西 | 27.59 | 31.03 | 34.12 | 46.03 | 3.66 | |
| 山东 | 34.48 | 31.03 | 29.29 | 58.00 | 3.72 | |
| 河南 | 34.48 | 27.59 | 33.33 | 56.86 | 3.14 | |
| 湖北 | 31.03 | 34.48 | 32.95 | 55.77 | 8.97 | |
| 湖南 | 31.03 | 27.59 | 34.52 | 45.31 | 4.24 | |
| 广东 | 31.03 | 27.59 | 34.52 | 45.31 | 8.41 | |
| 广西 | 27.59 | 6.90 | 33.72 | 33.33 | 0.17 | |
| 海南 | 24.14 | 24.14 | 33.33 | 35.80 | 3.66 | |
| 重庆 | 41.38 | 20.69 | 37.66 | 35.80 | 2.06 | |
| 四川 | 37.93 | 17.24 | 37.66 | 39.73 | 8.65 | |
| 贵州 | 44.83 | 10.34 | 38.67 | 33.33 | 2.10 | |
| 云南 | 37.93 | 10.34 | 38.16 | 28.71 | 2.73 | |
| 陕西 | 37.93 | 44.83 | 36.71 | 58.00 | 16.41 | |
| 甘肃 | 20.69 | 6.90 | 34.52 | 24.58 | 0.06 | |
| 青海 | 31.03 | 6.90 | 36.25 | 24.58 | 0.46 | |
| 宁夏 | 34.48 | 0.00 | 55.77 | 3.33 | 0.00 | |
| 新疆 | 48.28 | 17.24 | 39.73 | 31.87 | 9.28 | |
Tab. 3
Division of network clusters and matrix of spatial correlation for average agricultural resilience in China from 2014 to 2023"
| 板块 | 密度矩阵(像矩阵) | 接收关系数 | 溢出关系数 | 期望比例 | 实际比例 | 板块属性 | |||||||
|---|---|---|---|---|---|---|---|---|---|---|---|---|---|
| I | II | III | IV | 板块内 | 板块间 | 板块内 | 板块间 | ||||||
| I | 0.161(0) | 0.031(0) | 0.542(0) | 0.094(0) | 9 | 81 | 9 | 34 | 24.14 | 20.93 | 净受益 | ||
| II | 0.188(0) | 0.089(0) | 0.417(1) | 0.563(1) | 5 | 40 | 5 | 68 | 24.14 | 6.85 | 净溢出 | ||
| III | 0.729(1) | 0.042(0) | 0.300(1) | 0.042(0) | 9 | 52 | 9 | 39 | 17.24 | 18.75 | 经纪人 | ||
| IV | 0.531(1) | 0.563(1) | 0.125(0) | 0.089(0) | 5 | 44 | 5 | 76 | 24.14 | 6.17 | 净溢出 | ||
Tab. 4
Explanation of ERGM variables for the formation mechanism of spatial correlation networks of agricultural resilience"
| 变量 | 示意图 | 假设检验 |
|---|---|---|
| 弧 |  | 一般作为常数项,不作解释 |
| 互惠性 |  | 是否省(自治区、直辖市)间倾向于农业韧性双向连接? |
| 循环性 | 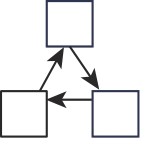 | 是否省(自治区、直辖市)间更倾向于形成农业韧性三角传递关系? |
| 连通性 |  | 是否省(自治区、直辖市)间倾向于同时具有较多的农业韧性发出和接收关系? |
| 集聚性 | 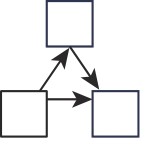 | 是否省(自治区、直辖市)间更倾向于形成农业韧性集聚性关系? |
| 发出效应 |  | 是否省(自治区、直辖市)间更倾向于形成农业韧性发出关系? |
| 接收效应 |  | 是否省(自治区、直辖市)间更倾向于形成农业韧性接收关系? |
| 异配性 |  | 是否属性相异的省(自治区、直辖市)间更倾向于形成农业韧性关联关系? |
| 协变量 | 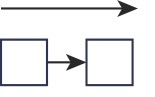 | 是否省(自治区、直辖市)间易受外部环境影响的更倾向于形成农业韧性关联关系? |
Tab. 5
Estimation results of ERGM model"
| 变量 | 模型(1) 2014—2023年均值 | 模型(2) 2014年 | 模型(3) 2023年 |
|---|---|---|---|
| 弧 | -5.18**(1.64) | -3.83*(1.53) | -9.12***(1.44) |
| 互惠性 | 2.49***(0.38) | -0.64(0.34) | 2.53***(0.42) |
| 连通性 | -0.03(0.05) | -0.15***(0.04) | -0.03(0.05) |
| 循环性 | -0.86***(0.18) | 0.12(0.15) | -1.05***(0.21) |
| 集聚性 | 0.32(0.17) | 0.41*(0.19) | 0.26 (0.16) |
| 发出效应(经济水平) | 4.62***(0.78) | 0.74(1.69) | 6.91***(0.89) |
| 接收效应(经济水平) | 0.93(0.95) | -1.95(1.65) | 2.46(1.26) |
| 异配性(经济水平) | -2.32**(0.69) | -0.83(1.42) | -2.11**(0.79) |
| 发出效应(产业结构) | 1.98*(0.98) | 1.94(1.16) | 3.99***(1.05) |
| 接收效应(产业结构) | 0.13(1.03) | -0.01(1.14) | 1.60(1.07) |
| 异配性(产业结构) | 3.69***(0.84) | -0.58(1.03) | 2.59**(0.83) |
| 发出效应(生产条件) | 1.81**(0.57) | 0.99(0.65) | 1.91*(0.86) |
| 接收效应(生产条件) | -0.08(0.53) | -0.32(0.63) | -0.65(0.78) |
| 异配性(生产条件) | 0.39(0.58) | 2.68***(0.78) | -0.64(0.88) |
| 发出效应(科技创新) | 0.37(0.61) | 1.70*(0.70) | 1.38(0.76) |
| 接收条件(科技创新) | -0.65(0.63) | -0.12(0.72) | -0.65(0.69) |
| 异配性(科技创新) | -0.78(0.53) | 0.09(0.69) | -0.50(0.57) |
| 发出条件(极端气温) | -3.10***(0.85) | 1.41(1.05) | 0.92(0.58) |
| 接收条件(极端气温) | -0.66(0.83) | 3.19**(1.11) | -0.02(0.58) |
| 异配性(极端气温) | -2.13*(0.90) | -1.11(1.27) | -1.54*(0.64) |
| 发出条件(极端强降水) | 1.22*(0.60) | -0.79(1.82) | 2.27(2.12) |
| 接收条件(极端强降水) | 1.41*(0.64) | -2.41(1.84) | -0.26(1.91) |
| 异配性(极端强降水) | -0.71(0.57) | -3.14(1.87) | 2.04(2.14) |
| D[0, 500] | 3.76***(0.61) | 3.96***(0.69) | 2.81***(0.59) |
| D[500, 1000] | 2.56***(0.52) | 2.88***(0.59) | 1.95***(0.52) |
| D[1000, 1500] | 1.33**(0.43) | 2.06***(0.48) | 1.04*(0.44) |
| D[1500, 2000] | 0.77*(0.40) | 1.48**(0.47) | 0.70(0.42) |
| 贸易网络 | 0.56*(0.28) | 0.51(0.31) | 0.95**(0.31) |
| AIC | 702.03 | 791.65 | 671.24 |
| BIC | 835.55 | 925.17 | 804.76 |
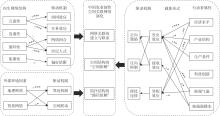
Fig. 3
Mechanism of driving factors of agricultural resilience spatial correlation network"
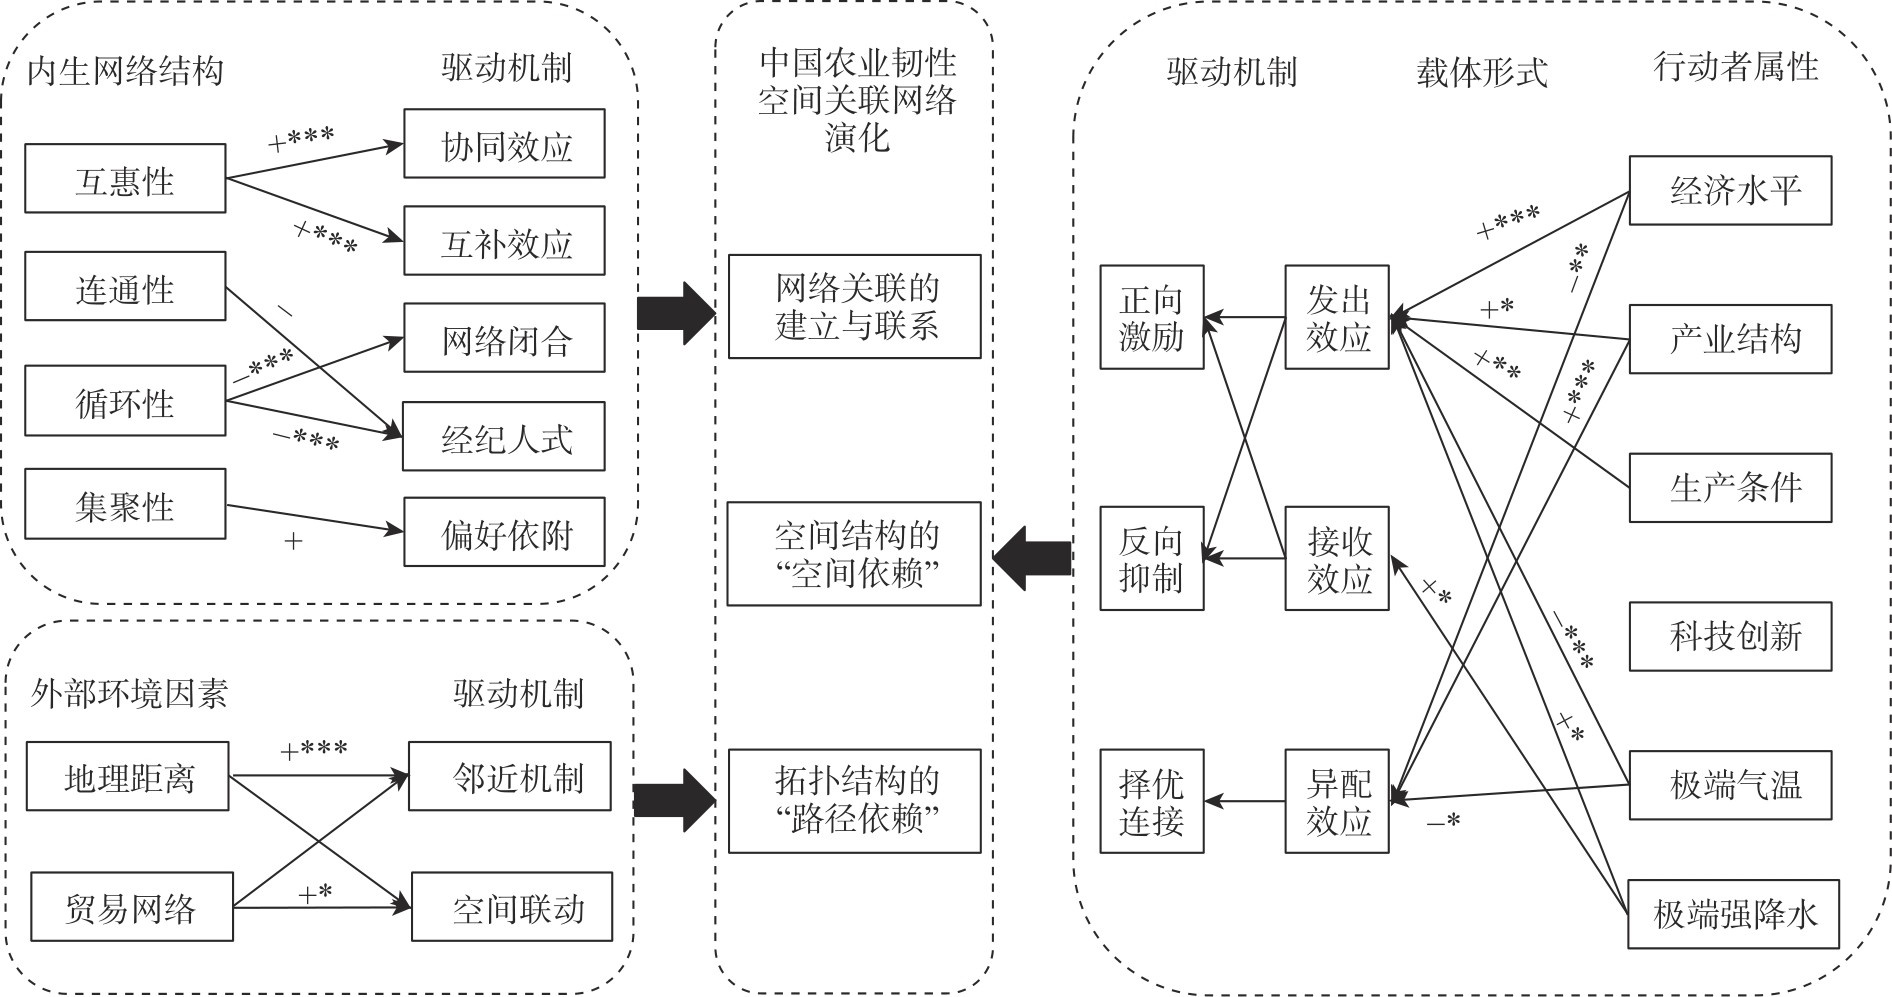
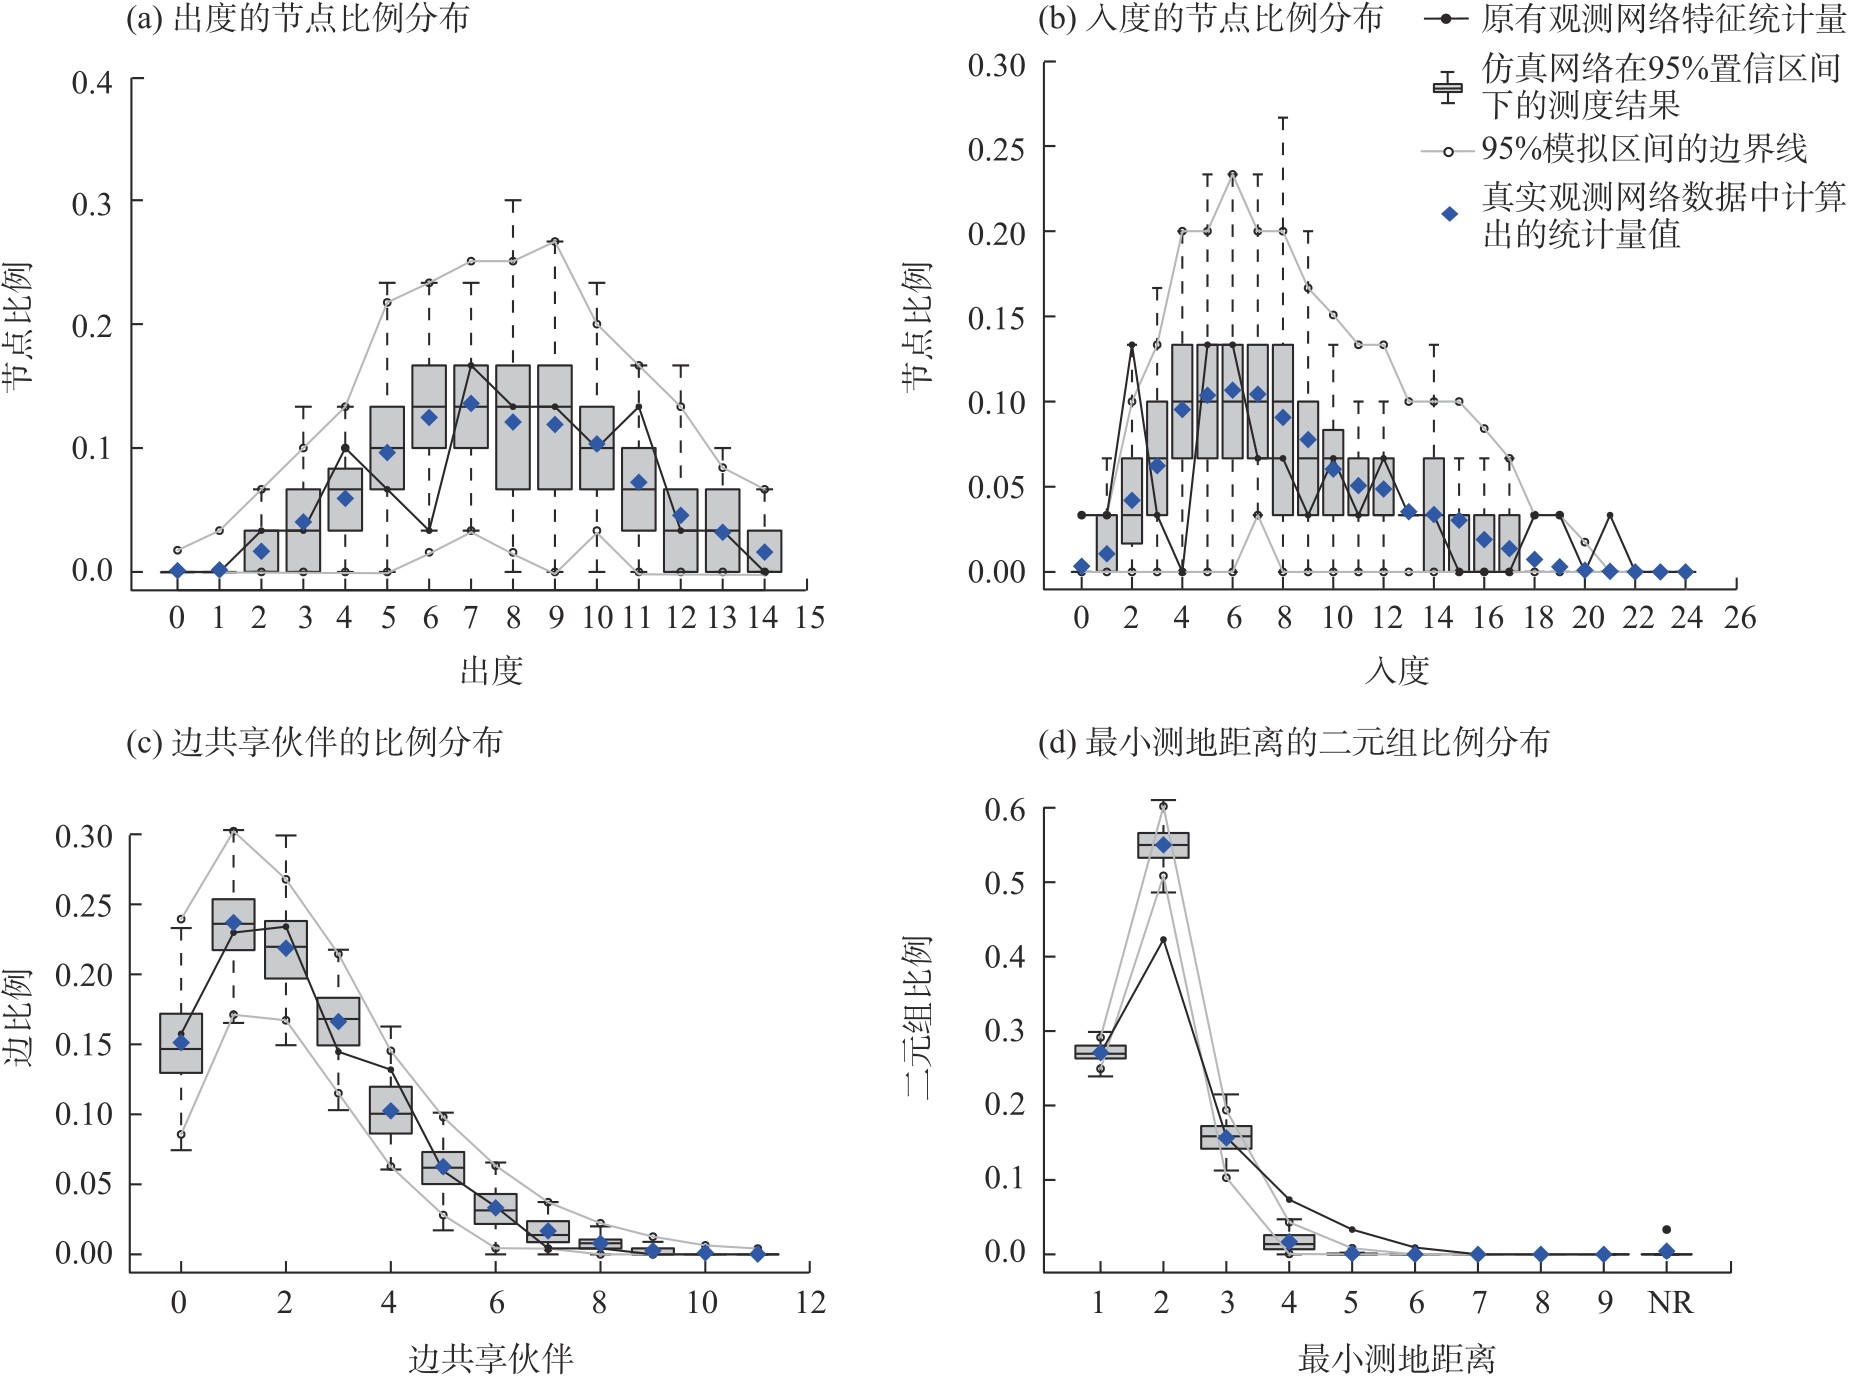
Fig. 4
GOF test results for ERGM model of the mean agricultural resilience correlation network from 2014 to 2023"
| [1] |
Holling C S. Resilience and stability of ecological systems[J]. Annual Review of Ecology and Systematics, 1973, 4(1): 1-23.
doi: 10.1146/ecolsys.1973.4.issue-1 |
| [2] | 王瑞雪, 陈建成, 方宜亮, 等. 中国粮食主产区农业韧性的空间分异、演化特征与驱动力[J]. 农业经济与管理, 2023(4): 23-36. |
| [Wang Ruixue, Chen Jiancheng, Fang Yiliang, et al. Spatial differentiation, evolution characteristics and driving forces of agricultural resilience in China’s main grain production areas[J]. Agricultural Economics and Management, 2023(4): 23-36.] | |
| [3] | 宋敏, 刘欣雨. 数字经济赋能农业韧性机制研究——基于人力资本的中介效应分析[J]. 江苏社会科学, 2023(1): 103-112. |
| [Song Min, Liu Xinyu. Agricultural resilience empowered by the digital economy: The mediating role of human capital[J]. Jiangsu Social Sciences, 2023(1): 103-112.] | |
| [4] | 王亚飞, 余金鑫. 中国省际农业韧性空间关联的网络结构及驱动因素[J]. 三峡大学学报(人文社会科学版), 2024, 46(4): 61-70. |
| [Wang Yafei, Yu Jinxin. The network structure and drivers of inter-provincial agricultural resilience in China[J]. Journal of China Three Gorges University (Humanities & Social Sciences Edition), 2024, 46(4): 61-70.] | |
| [5] | 田相辉, 黄子勇. 中国农业产业韧性水平的区域差异与时空演变[J]. 统计与决策, 2024, 40(15): 104-109. |
| [Tian Xianghui, Huang Ziyong. Regional differences and spatiotemporal evolution of resilience of China’s agricultural industry[J]. Statistics & Decision, 2024, 40(15): 104-109.] | |
| [6] | 郝爱民, 谭家银. 农村产业融合赋能农业韧性的机理及效应测度[J]. 农业技术经济, 2023(7): 88-107. |
| [Hao Aimin, Tan Jiayin. Empowering agricultural resilience by rural industrial integration: Influence mechanism and effect analysis[J]. Journal of Agrotechnical Economics, 2023(7): 88-107.] | |
| [7] | 孙聪, 夏恩君, 黄洁萍, 等. 数农融合发展对农业韧性的影响[J]. 经济与管理研究, 2024, 45(6): 76-94. |
| [Sun Cong, Xia Enjun, Huang Jieping, et al. Impact of digital economy-agriculture integration on agricultural resilience[J]. Research on Economics and Management, 2024, 45(6): 76-94.] | |
| [8] | 潘敏, 刘红艳, 程子帅. 极端气候对商业银行风险承担的影响——来自中国地方性商业银行的经验证据[J]. 金融研究, 2022(10): 39-57. |
| [Pan Min, Liu Hongyan, Cheng Zishuai. The impact of extreme climate on commercial banks’ risk-taking: Evidence from local commercial banks in China[J]. Journal of Financial Research, 2022(10): 39-57.] | |
| [9] | 芦风英, 庞智强, 邓光耀. 中国乡村振兴发展的区域差异测度及形成机理[J]. 经济问题探索, 2022(4): 19-36. |
| [Lu Fengying, Pang Zhiqiang, Deng Guangyao. Measurement and formation mechanism of regional differences in rural revitalization in China[J]. Inquiry into Economic Issues, 2022(4): 19-36.] | |
| [10] |
史玉芳, 牛玉. 关中平原城市群韧性空间关联网络及其影响因素研究[J]. 干旱区地理, 2024, 47(2): 270-280.
doi: 10.12118/j.issn.1000-6060.2023.104 |
|
[Shi Yufang, Niu Yu. Resilience spatial correlation network and its influencing factors in Guanzhong Plain urban agglomeration[J]. Arid Land Geography, 2024, 47(2): 270-280.]
doi: 10.12118/j.issn.1000-6060.2023.104 |
|
| [11] |
史维良, 李博雅. 黄河流域三大城市群城市韧性空间网络结构研究[J]. 干旱区地理, 2024, 47(10): 1767-1780.
doi: 10.12118/j.issn.1000-6060.2024.058 |
|
[Shi Weiliang, Li Boya. Resilience spatial network structure of the three major urban agglomerations in the Yellow River Basin[J]. Arid Land Geography, 2024, 47(10): 1767-1780.]
doi: 10.12118/j.issn.1000-6060.2024.058 |
|
| [12] |
邓光耀, 沈迎辰. 中国生态韧性关联网络的特征及影响因素研究[J]. 干旱区地理, 2025, 48(4): 704-716.
doi: 10.12118/j.issn.1000-6060.2024.396 |
|
[Deng Guangyao, Shen Yingchen. Characterization and influencing factors of ecological resilience linkage networks in Chinese[J]. Arid Land Geography, 2025, 48(4): 704-716.]
doi: 10.12118/j.issn.1000-6060.2024.396 |
|
| [13] | 董亚妮, 祁春节, 谭明交, 等. 粮食主产区农业韧性的空间差异及影响因素[J]. 中国农业资源与区划, 2024, 45(3): 14-25. |
| [Dong Yani, Qi Chunjie, Tan Mingjiao, et al. Spatial differences and influences factors of agricultural resilience in major grain-producing areas[J]. Chinese Journal of Agricultural Resources and Regional Planning, 2024, 45(3): 14-25.] | |
| [14] |
Robins G, Pattison P, Elliott P. Network models for social influence processes[J]. Psychometrika, 2001, 66(2): 161-189.
doi: 10.1007/BF02294834 |
| [15] | 杨青, 郭露, 刘星星, 等. 基于模体结构与指数随机图的中国省域交通碳排放空间关联格局的驱动要素研究[J]. 中国环境科学, 2024, 44(2): 1171-1184. |
| [Yang Qing, Guo Lu, Liu Xingxing, et al. Research on the driving factors of the spatial correlation pattern of provincial transport carbon emissions in China based on modular structure and exponential random graph[J]. China Environmental Science, 2024, 44(2): 1171-1184.] | |
| [16] |
邵帅, 徐俐俐, 杨莉莉. 千里“碳缘”一线牵: 中国区域碳排放空间关联网络的结构特征与形成机制[J]. 系统工程理论与实践, 2023, 43(4): 958-983.
doi: 10.12011/SETP2022-1418 |
| [Shao Shuai, Xu Lili, Yang Lili. Structural characteristics and formation mechanism of carbon emission spatial association networks within China[J]. Systems Engineering-Theory & Practice, 2023, 43(4): 958-983.] |
|
||