干旱区地理 ›› 2025, Vol. 48 ›› Issue (7): 1185-1197.doi: 10.12118/j.issn.1000-6060.2024.473 cstr: 32274.14.ALG2024473
程鹏1( ), 彭海洋1, 侯丁榕1, 孙明东2, 宋晓伟1
收稿日期:2024-08-07
修回日期:2024-11-21
出版日期:2025-07-25
发布日期:2025-07-04
作者简介:程鹏(1989-),男,博士,副教授,主要从事流域水环境管理研究. E-mail: pengcheng@sxufe.edu.cn
基金资助:
CHENG Peng1(), PENG Haiyang1, HOU Dingrong1, SUN Mingdong2, SONG Xiaowei1
Received:2024-08-07
Revised:2024-11-21
Published:2025-07-25
Online:2025-07-04
摘要: 农业水污染管理对于缓解水资源危机和促进区域可持续发展至关重要。以综合考虑农业灰水足迹和经济发展水平的农业灰水足迹强度(AGWFI)代表农业污染水平,测算了2012—2021年黄河流域112个地级市(州、盟)的AGWFI,全面分析了黄河流域AGWFI的空间格局和演进趋势,并采用分位数回归方法探讨了其影响因素。结果表明:(1) 2012—2021年黄河流域总体及上、中、下游地区AGWFI均显著降低,且上游地区AGWFI的下降幅度远大于中、下游地区。(2) 2012—2021年黄河流域AGWFI呈现西高东低的分布格局;流域总体及上、中、下游地区的AGWFI基尼系数都较大且呈上升趋势,区域内差异和区域间差异是其主要来源;AGWFI转移路径主要发生在相邻等级之间。(3) 农业经济发展水平对黄河流域总体及上、中、下游地区AGWFI的影响均显著为负,而第一产业产值占比和农业水资源利用程度均具有显著正向作用。研究结果可为黄河流域制定针对性的农业水污染管理措施提供科学参考。
程鹏, 彭海洋, 侯丁榕, 孙明东, 宋晓伟. 黄河流域农业灰水足迹强度空间格局及演进趋势[J]. 干旱区地理, 2025, 48(7): 1185-1197.
CHENG Peng, PENG Haiyang, HOU Dingrong, SUN Mingdong, SONG Xiaowei. Spatial pattern and evolution trend of agricultural grey water footprint intensity in the Yellow River Basin[J]. Arid Land Geography, 2025, 48(7): 1185-1197.
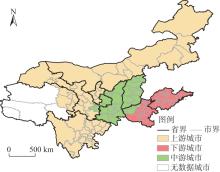
图1
研究区示意图 注:基于自然资源部标准地图服务网站审图号为GS(2023)2763号的标准地图制作,底图边界无修改。下同。"
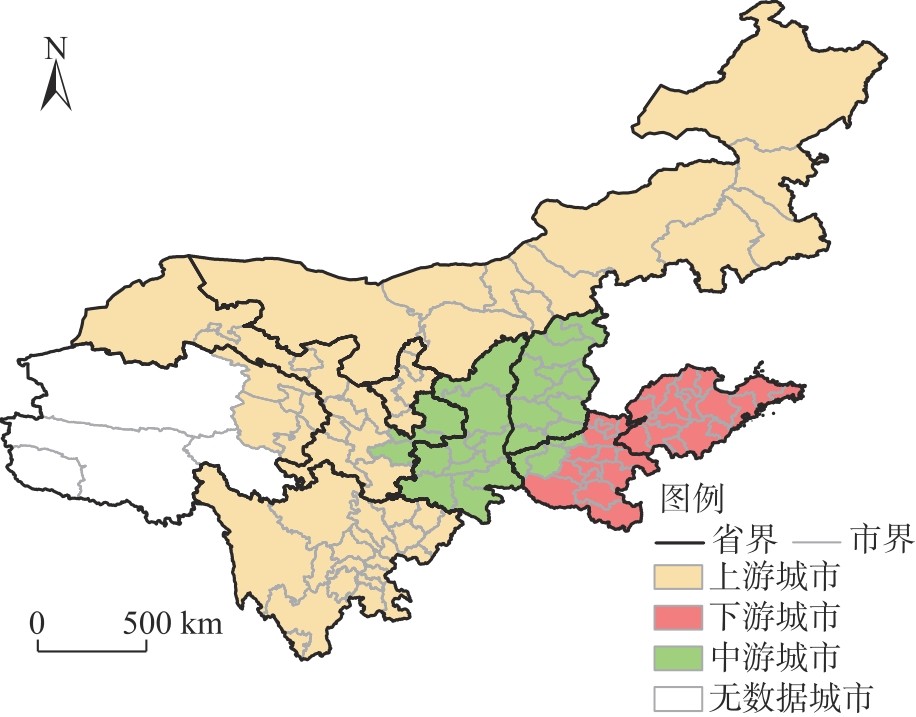
表1
AGWFI影响因素"
| 影响因素 | 平均值 | 标准差 | 最小值 | 最大值 |
|---|---|---|---|---|
| 农业经济发展水平/104元 | 0.456 | 0.214 | 0.063 | 1.448 |
| 农业水资源利用程度/% | 109.606 | 255.217 | 0.213 | 2144.917 |
| 第一产业产值占比/% | 11.859 | 7.134 | 0.641 | 32.810 |
| 粮食产量/104 t | 203.017 | 191.710 | 0.980 | 934.303 |
| 农作物播种面积/104 hm2 | 50.838 | 40.675 | 0.399 | 202.420 |
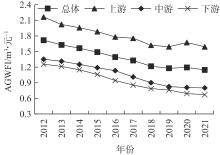
图2
2012—2021年黄河流域及上、中、下游地区AGWFI 注:AGWFI为农业灰水足迹强度。下同。"
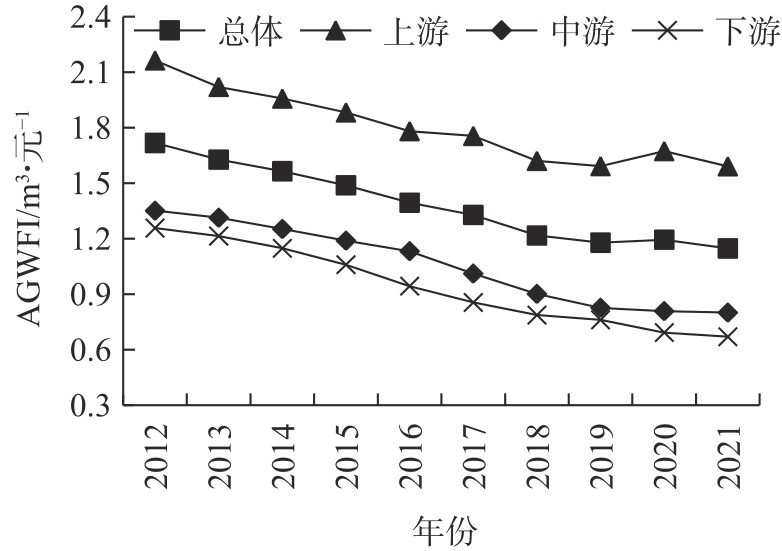

图3
黄河流域AGWFI空间分布"
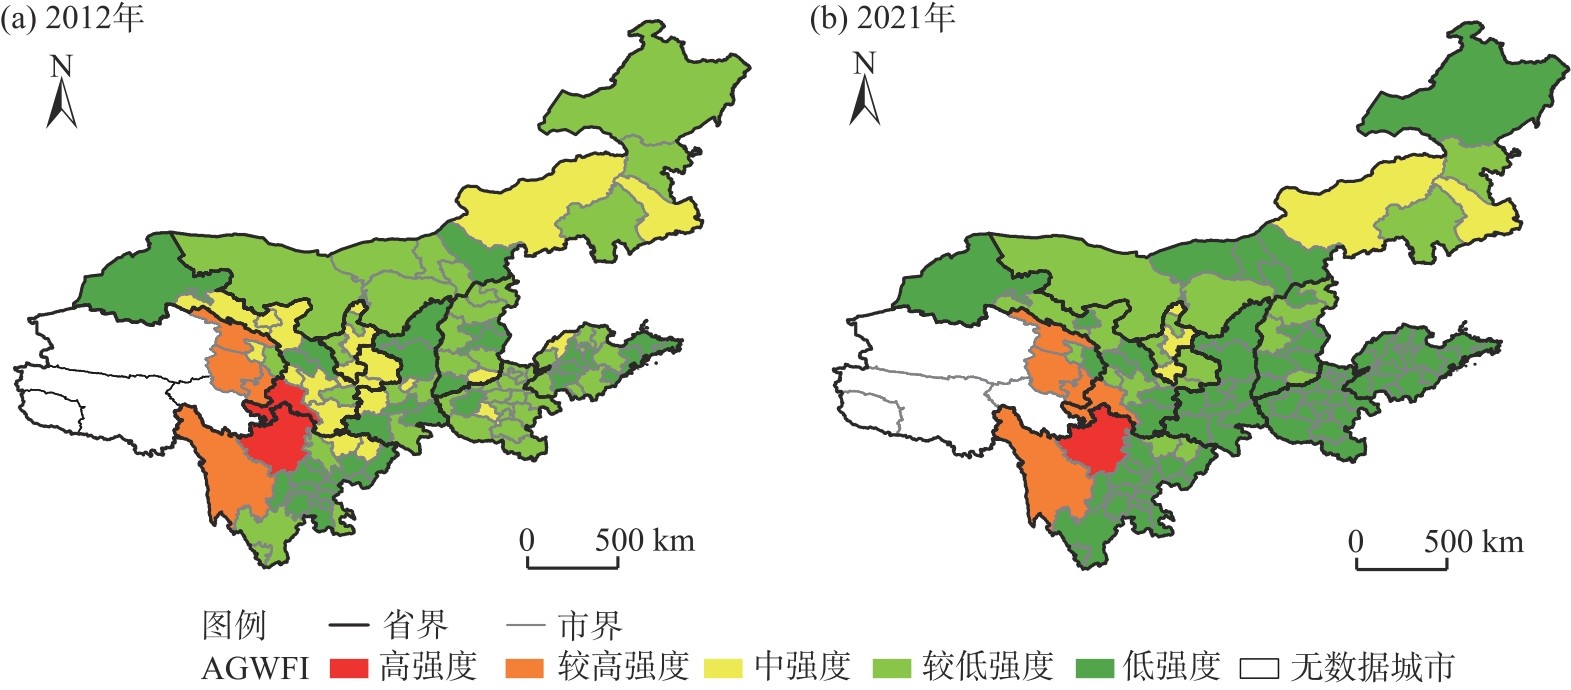
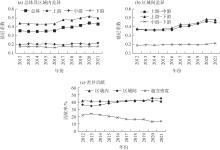
图4
2012—2021年黄河流域AGWFI的差异及其贡献率"
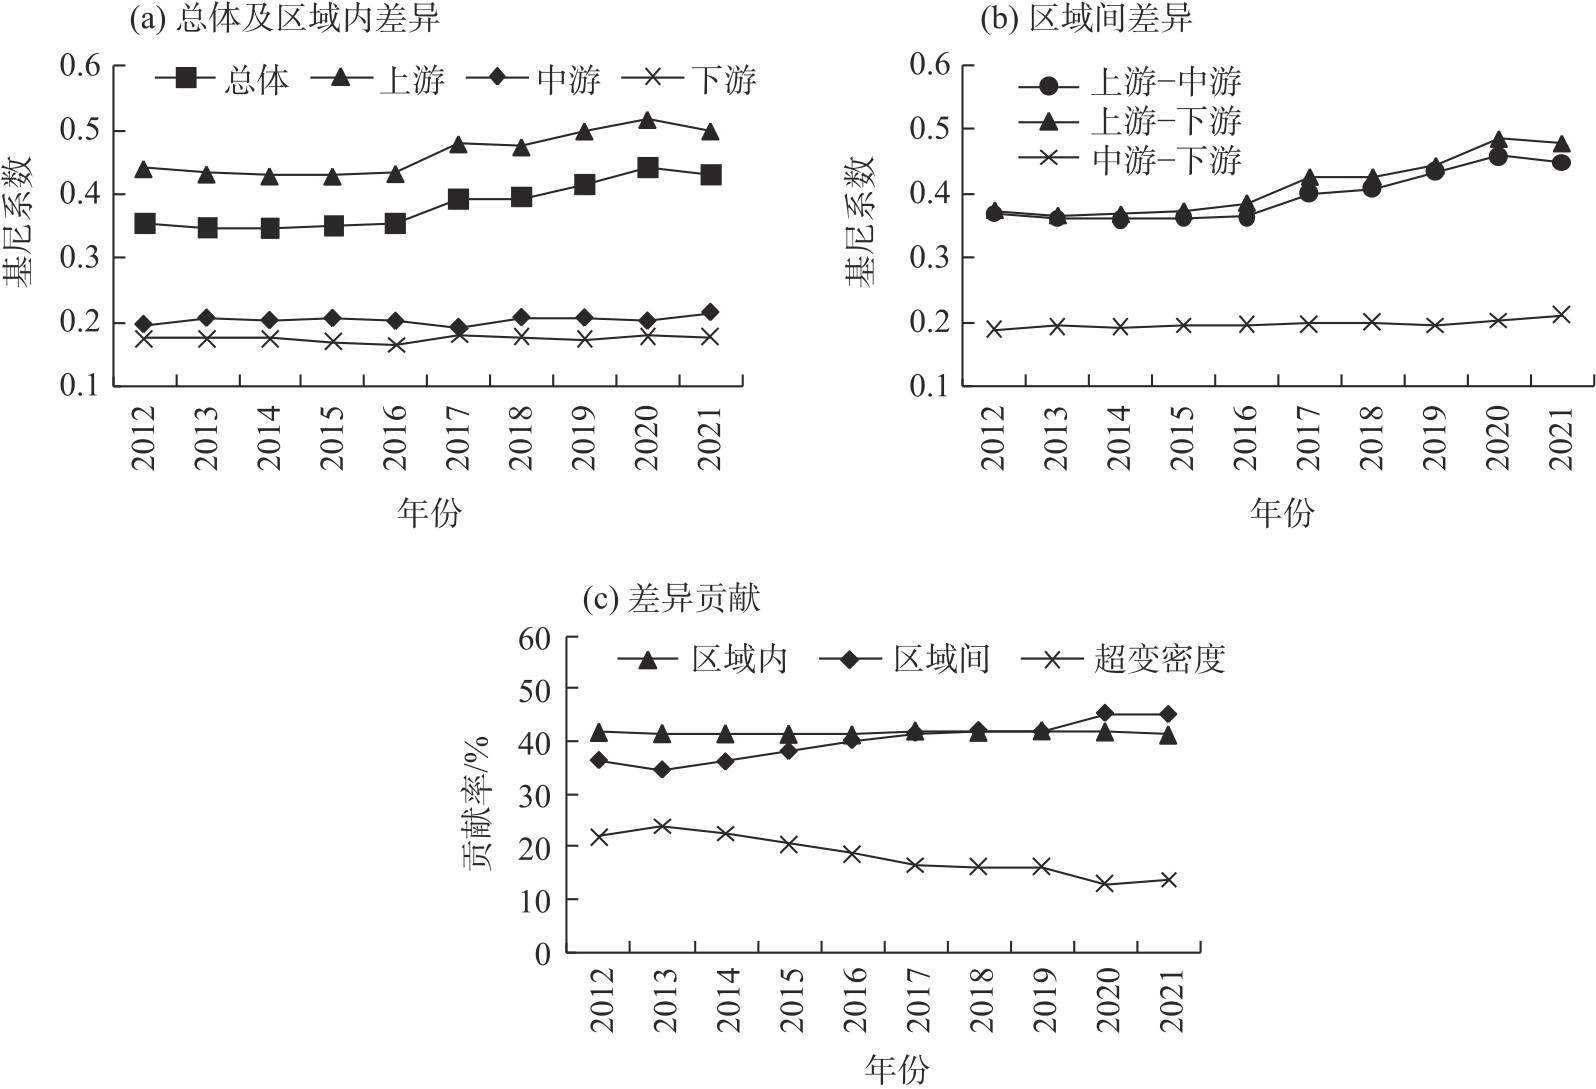
图5
黄河流域AGWFI的动态演进"

表2
黄河流域AGWFI的马尔科夫链转移概率矩阵"
| 地区 | 类型 | 低值 | 中值 | 较高值 | 高值 |
|---|---|---|---|---|---|
| 总体 | 低值 | 0.996 | 0.004 | 0.000 | 0.000 |
| 中值 | 0.188 | 0.793 | 0.020 | 0.000 | |
| 较高值 | 0.004 | 0.205 | 0.757 | 0.034 | |
| 高值 | 0.000 | 0.000 | 0.130 | 0.870 | |
| 上游 | 低值 | 0.990 | 0.010 | 0.000 | 0.000 |
| 中值 | 0.215 | 0.763 | 0.022 | 0.000 | |
| 较高值 | 0.010 | 0.143 | 0.810 | 0.038 | |
| 高值 | 0.000 | 0.000 | 0.087 | 0.913 | |
| 中游 | 低值 | 1.000 | 0.000 | 0.000 | 0.000 |
| 中值 | 0.189 | 0.784 | 0.027 | 0.000 | |
| 较高值 | 0.000 | 0.230 | 0.703 | 0.068 | |
| 高值 | 0.000 | 0.000 | 0.220 | 0.780 | |
| 下游 | 低值 | 1.000 | 0.000 | 0.000 | 0.000 |
| 中值 | 0.157 | 0.831 | 0.011 | 0.000 | |
| 较高值 | 0.000 | 0.262 | 0.738 | 0.000 | |
| 高值 | 0.000 | 0.000 | 0.250 | 0.750 |
表3
面板数据回归模型的检验结果"
| 地区 | 分位点 | 农业经济发展水平 | 农业水资源利用程度 | 第一产业产值占比 | 粮食产量 | 农作物播种面积 | 常数项 |
|---|---|---|---|---|---|---|---|
| 总体 | 0.25 | -0.817*** | 0.045*** | 3.493*** | 0.000 | -0.002 | 0.713*** |
| 0.50 | -0.766*** | 0.039*** | 4.371*** | 0.001 | -0.004** | 0.990*** | |
| 0.75 | -0.932*** | 0.020** | 6.045*** | 0.001 | -0.007* | 1.290*** | |
| 上游 | 0.25 | -0.562*** | 0.045*** | 4.284*** | 0.217 | -0.005 | 0.629*** |
| 0.50 | -0.530*** | 0.028*** | 5.298*** | 1.657** | -0.012*** | 0.909*** | |
| 0.75 | 1.088 | -0.008 | 7.678*** | 2.946*** | -0.033*** | 1.314*** | |
| 中游 | 0.25 | -0.846*** | 0.076 | 0.986 | -0.001 | 0.005* | 0.935*** |
| 0.50 | -1.551*** | 0.235** | 1.898** | -0.002*** | 0.009*** | 1.298*** | |
| 0.75 | -1.848*** | 0.236*** | 2.711*** | -0.003*** | 0.009*** | 1.674*** | |
| 下游 | 0.25 | -1.295*** | 0.106*** | 3.593*** | -0.001*** | 0.003*** | 0.893*** |
| 0.50 | -1.285*** | 0.134*** | 2.703*** | 0.000 | 0.000 | 1.063*** | |
| 0.75 | -1.790*** | 0.105** | 3.157*** | 0.000 | -0.001 | 1.462*** |
表4
最小二乘法(OLS)检验结果"
| 地区 | 变量 | 农业经济发展水平 | 农业水资源利用程度 | 第一产业产值占比 | 粮食产量 | 农作物播种面积 | 常数项 |
|---|---|---|---|---|---|---|---|
| 总体 | 系数 | -1.126*** | -0.024 | 10.059*** | 0.002*** | -0.024*** | 1.470*** |
| 标准误 | 0.249 | 0.017 | 0.767 | 0.001 | 0.004 | 0.110 | |
| 上游 | 系数 | -0.260 | -0.056** | 10.456*** | 3.188** | -0.042*** | 1.769*** |
| 标准误 | 0.429 | 0.025 | 1.343 | 1.618 | 0.007 | 0.227 | |
| 中游 | 系数 | -1.505*** | 0.052 | 2.239*** | -0.002** | 0.007** | 1.339*** |
| 标准误 | 0.175 | 0.087 | 0.614 | 0.001 | 0.003 | 0.065 | |
| 下游 | 系数 | -1.603*** | 0.114*** | 3.403*** | 0.000 | -0.001 | 1.204*** |
| 标准误 | 0.138 | 0.028 | 0.452 | 0.000 | 0.001 | 0.068 |
| [1] | 李汝资, 白昳, 周云南, 等. 黄河流域水资源利用与经济增长脱钩及影响因素分解[J]. 地理科学, 2023, 43(1): 110-118. |
| [ Li Ruzi, Bai Yi, Zhou Yunnan, et al. Decoupling and decomposition of driving factors of water resources utilization and economic growth in the Yellow River Basin[J]. Scientia Geographica Sinica, 2023, 43(1): 110-118. ] | |
| [2] | Distefano T, Kelly S. Are we in deep water? Water scarcity and its limits to economic growth[J]. Ecological Economics, 2017, 142: 130-147. |
| [3] | 金银雪. 全球变暖下的水资源危机[J]. 生态经济, 2020, 36(6): 5-8. |
| [ Jin Yinxue. Water crisis under global warming[J]. Ecological Economy, 2020, 36(6): 5-8. ] | |
| [4] | 梁赛, 吴晓慧, 李晓燕, 等. 社会经济驱动的环境水质问题研究进展[J]. 环境科学学报, 2023, 43(12): 93-101. |
| [ Liang Sai, Wu Xiaohui, Li Xiaoyan, et al. Review on environmental water quality issues driven by socioeconomic activities[J]. Acta Scientiae Circumstantiae, 2023, 43(12): 93-101. ] | |
| [5] | Kong Y, He W J, Zhang Z F, et al. Spatial-temporal variation and driving factors decomposition of agricultural grey water footprint in China[J]. Journal of Environmental Management, 2022, 318: 115601, doi: 10.1016/j.jenvman.2022.115601. |
| [6] | 曾昭, 刘俊国. 北京市灰水足迹评价[J]. 自然资源学报, 2013, 28(7): 1169-1178. |
| [ Zeng Zhao, Liu Junguo. Historical trend of grey water footprint of Beijing, China[J]. Journal of Natural Resources, 2013, 28(7): 1169-1178. ] | |
| [7] | Hoekstra A Y, Chapagain A K, Aldaya M M, et al. The water footprint assessment manual: Setting the global standard[M]. London: Routledge, 2011. |
| [8] | 楚天舒, 黄译萱, 赖世宣, 等. 中国各省市区种养业灰水足迹分析与评价[J]. 中国农业资源与区划, 2023, 44(11): 53-64. |
| [ Chu Tianshu, Huang Yixuan, Lai Shixuan, et al. Analysis and evaluation of gray water footprint for planting-animal husbandry industry in provincial regions, China[J]. Chinese Journal of Agricultural Resources and Regional Planning, 2023, 44(11): 53-64. ] | |
| [9] | Yan Y A, Wang R, Chen S, et al. Three-dimensional agricultural water scarcity assessment based on water footprint: A study from a humid agricultural area in China[J]. Science of the Total Environment, 2023, 857: 159407, doi: 10.1016/j.scitotenv.2022.159407. |
| [10] | 王丹阳, 李景保, 叶亚亚, 等. 基于不同受纳水体的湖南省农业灰水足迹分析[J]. 水资源保护, 2016, 32(4): 49-54. |
| [ Wang Danyang, Li Jingbao, Ye Yaya, et al. Analysis of agricultural grey water footprint in Hunan Province based on different receiving water bodies[J]. Water Resources Protection, 2016, 32(4): 49-54. ] | |
| [11] | 程鹏, 李叙勇, 孙明东. 基于河流参照状态的季风区域季节性农业灰水足迹核算方法与例证[J]. 环境科学学报, 2020, 40(9): 3453-3462. |
| [ Cheng Peng, Li Xuyong, Sun Mingdong. Calculation method and illustration of seasonal agricultural grey water footprint in monsoon region based on river reference conditions[J]. Acta Scientiae Circumstantiae, 2020, 40(9): 3453-3462. ] | |
| [12] | 杜慧娟, 王光耀, 冉光妍, 等. 面向SDGs的塔里木河流域农业灰水足迹分析[J]. 干旱区研究, 2023, 40(7): 1184-1193. |
| [ Du Huijuan, Wang Guangyao, Ran Guangyan, et al. Agricultural gray water footprint in the Tarim River Basin using SDGs analysise[J]. Arid Zone Research, 2023, 40(7): 1184-1193. ] | |
| [13] | 张鑫, 李磊, 甄志磊, 等. 时空与效率视角下汾河流域农业灰水足迹分析[J]. 中国环境科学, 2019, 39(4): 1502-1510. |
| [ Zhang Xin, Li Lei, Zhen Zhilei, et al. Analysis of agricultural grey water footprint in Fenhe River Basin based on the perspective of space-time and efficiency[J]. China Environmental Science, 2019, 39(4): 1502-1510. ] | |
| [14] | Li H Y, Wang Y F, Qin L J, et al. Effects of different slopes and fertilizer types on the grey water footprint of maize production in the black soil region of China[J]. Journal of Cleaner Production, 2020, 246: 119077, doi: 10.1016/j.jclepro.2019.119077. |
| [15] | Barreto M D L P, Netto A M, Da Silva J P S, et al. Gray water footprint assessment for pesticide mixtures applied to a sugarcane crop in Brazil: A comparison between two models[J]. Journal of Cleaner Production, 2020, 276: 124254, doi: 10.1016/j.jclepro.2020. 124254. |
| [16] | Xu C X, Liu Y, Fu T B. Spatial-temporal evolution and driving factors of grey water footprint efficiency in the Yangtze River Economic Belt[J]. Science of the Total Environment, 2022, 844: 156930, doi: 10.1016/j.scitotenv.2022.156930. |
| [17] | 李胜楠, 王远, 罗进, 等. 福建省灰水足迹时空变化及驱动因素[J]. 生态学报, 2020, 40(21): 7952-7965. |
| [ Li Shengnan, Wang Yuan, Luo Jin, et al. Spatio-temporal variations and driving factors of grey water footprint in Fujian Province[J]. Acta Ecologica Sinica, 2020, 40(21): 7952-7965. ] | |
| [18] | 赵良仕. 中国省际灰水足迹强度的空间收敛性研究[J]. 辽宁师范大学学报(自然科学版), 2017, 40(4): 541-547. |
| [ Zhao Liangshi. Study on spatial convergence of grey water footprint intensity on provincial scale in China[J]. Journal of Liaoning Normal University (Natural Science Edition), 2017, 40(4): 541-547. ] | |
| [19] | 徐瑞璠, 赵敏娟, 高建中. 中国农业灰水足迹测度及时空分异研究[J]. 中国农业资源与区划, 2023, 44(10): 52-66. |
| [ Xu Ruifan, Zhao Minjuan, Gao Jianzhong. Measurement and spatial-temporal variation of agricultural grey water footprint in China[J]. Chinese Journal of Agricultural Resources and Regional Planning, 2023, 44(10): 52-66. ] | |
| [20] | Zhang L L, Zhang R, Wang Z Z, et al. Spatial heterogeneity of the impact factors on gray water footprint intensity in China[J]. Sustainability, 2020, 12(3): 865, doi: 10.3390/su12030865. |
| [21] | He W J, Zhang K, Kong Y, et al. Reduction pathways identification of agricultural water pollution in Hubei Province, China[J]. Ecological Indicators, 2023, 153: 110464, doi: 10.1016/j.ecolind. 2023.110464. |
| [22] | 徐春霞. 山东省金融服务业发展的空间非均衡及分布动态演进——基于银行业的实证分析[J]. 经济与管理评论, 2016, 32(6): 109-117. |
| [ Xu Chunxia. The spatial disequilibrium and dynamic evolution of financial services industry development in Shandong Province: Based on an empirical analysis of banking industry[J]. Review of Economy and Management, 2016, 32(6): 109-117. ] | |
| [23] | 陈明华, 刘华军, 孙亚男. 中国五大城市群金融发展的空间差异及分布动态: 2003—2013年[J]. 数量经济技术经济研究, 2016, 33(7): 130-144. |
| [ Chen Minghua, Liu Huajun, Sun Yanan. Reseach on the spatial differences and distributional dynamic evolution of financial development of five megalopolises from 2003 to 2013 in China[J]. Journal of Quantitative & Technological Economics, 2016, 33(7): 130-144. ] | |
| [24] | 陈明华, 张晓萌, 刘玉鑫, 等. 绿色TFP增长的动态演进及趋势预测——基于中国五大城市群的实证研究[J]. 南开经济研究, 2020(1): 20-44. |
| [ Chen Minghua, Zhang Xiaomeng, Liu Yuxin, et al. Dynamic evolution and trend prediction of green TFP growth: Empirical research based on five urban agglomerations in China[J]. Nankai Economic Studies, 2020(1): 20-44. ] | |
| [25] | 白天骄, 孙才志. 中国人均灰水足迹区域差异及因素分解[J]. 生态学报, 2018, 38(17): 6314-6325. |
| [ Bai Tianjiao, Sun Caizhi. Regional inequality and factor decomposition of the per capita grey water footprint in China[J]. Acta Ecologica Sinica, 2018, 38(17): 6314-6325. ] | |
| [26] | Chen J, Gao Y Y, Qian H, et al. Insights into water sustainability from a grey water footprint perspective in an irrigated region of the Yellow River Basin[J]. Journal of Cleaner Production, 2021, 316: 128329, doi: 10.1016/j.jclepro.2021.128329. |
| [27] | 程鹏, 孙明东, 宋晓伟. 中国灰水足迹时空动态演进及驱动因素研究[J]. 生态环境学报, 2024, 33(5): 745-756. |
| [ Cheng Peng, Sun Mingdong, Song Xiaowei. Study on the spatial and temporal dynamic evolution and driving factors of grey water footprint in China[J]. Ecology and Environmental Sciences, 2024, 33(5): 745-756. ] | |
| [28] | 陈岩, 童国平, 王蕾. 淮河流域农业灰水足迹效率的时空分布与驱动模式[J]. 水资源保护, 2020, 36(6): 60-66, 85. |
| [ Chen Yan, Tong Guoping, Wang Lei. Spatial-temporal distribution and driving models of agricultural grey water footprint efficiency in the Huai River Basin[J]. Water Resources Protection, 2020, 36(6): 60-66, 85. ] | |
| [29] | Fu T B, Xu C X, Yang L H, et al. Measurement and driving factors of grey water footprint efficiency in Yangtze River Basin[J]. Science of the Total Environment, 2022, 802: 149587, doi: 10.1016/j.scitotenv.2021.149587. |
| [30] | 王少剑, 谢紫寒, 王泽宏. 中国县域碳排放的时空演变及影响因素[J]. 地理学报, 2021, 76(12): 3103-3118. |
| [ Wang Shaojian, Xie Zihan, Wang Zehong. The spatiotemporal pattern evolution and influencing factors of CO2 emissions at the county level of China[J]. Acta Geographica Sinica, 2021, 76(12): 3103-3118. ] | |
| [31] | 毕茜, 于连超. 环境税的企业绿色投资效应研究——基于面板分位数回归的实证研究[J]. 中国人口·资源与环境, 2016, 26(3): 76-82. |
| [ Bi Qian, Yu Lianchao. Relationship between environmental taxes and enterprise green investment behavior: A panel quantile regression approach[J]. China Population, Resources and Environment, 2016, 26(3): 76-82. ] | |
| [32] | 刘志涛, 王少剑, 方创琳. 粤港澳大湾区生态系统服务价值的时空演化及其影响机制[J]. 地理学报, 2021, 76(11): 2797-2813. |
| [ Liu Zhitao, Wang Shaojian, Fang Chuanglin. Spatiotemporal evolution and influencing mechanism of ecosystem service value in the Guangdong-Hong Kong-Macao Greater Bay Area[J]. Acta Geographica Sinica, 2021, 76(11): 2797-2813. ] | |
| [33] | 刘佳琪, 周璐红, 席小雅. 2000—2020年黄河流域土地生态质量及其变化趋势预测[J]. 干旱区地理, 2023, 46(10): 1654-1662. |
| [ Liu Jiaqi, Zhou Luhong, Xi Xiaoya. Land ecological quality and its change trend prediction in the Yellow River Basin from 2000 to 2020[J]. Arid Land Geography, 2023, 46(10): 1654-1662. ] | |
| [34] | 黄万华, 王婷婷, 高红贵. 由“政区单元”河长制到“流域单元”河长制的转向——基于黄河流域河长制政策的准自然实验[J]. 东北财经大学学报, 2022(6): 74-84. |
| [ Huang Wanhua, Wang Tingting, Gao Honggui. Transforming of river chief system from district unit to basin unit: A quasi-natural experiment based on the policy of river chief system in the Yellow River Basin[J]. Journal of Dongbei University of Finance and Economics, 2022(6): 74-84. ] | |
| [35] | 罗静怡, 东梅. 中国粮食生产用水绿色效率与回弹效应研究——基于三阶段超效率SBM-Malmquist模型[J]. 干旱区地理, 2024, 47(9): 1508-1517. |
| [ Luo Jingyi, Dong Mei. Green efficiency and rebound effect of water for grain production in China: Based on the three-stage super-efficiency SBM-Malmquist model[J]. Arid Land Geography, 2024, 47(9): 1508-1517. ] | |
| [36] | 韩琴, 孙才志, 邹玮. 1998—2012年中国省际灰水足迹效率测度与驱动模式分析[J]. 资源科学, 2016, 38(6): 1179-1191. |
| [ Han Qin, Sun Caizhi, Zou Wei. Grey water footprint efficiency measure and its driving pattern analysis on provincial scale in China from 1998 to 2012[J]. Resources Science, 2016, 38(6): 1179-1191. ] | |
| [37] | Feng H Y, Sun F Y, Liu Y Y, et al. Mapping multiple water pollutants across China using the grey water footprint[J]. Science of the Total Environment, 2021, 785: 147255, doi: 10.1016/j.scitotenv.2021.147255. |
| [38] | Dagum C. A new approach to the decomposition of the Gini income inequality ratio[M]. Berlin: Springer, 1998. |
| [39] | 陈明华, 岳海珺, 郝云飞, 等. 黄河流域生态效率的空间差异、动态演进及驱动因素[J]. 数量经济技术经济研究, 2021, 38(9): 25-44. |
| [ Chen Minghua, Yue Haijun, Hao Yunfei, et al. The spatial disparity, dynamic evolution and driving factors of ecological efficiency in the Yellow River Basin[J]. The Journal of Quantitative & Technical Economics, 2021, 38(9): 25-44. ] | |
| [40] | 穆学青, 郭向阳, 明庆忠, 等. 黄河流域旅游生态安全的动态演变特征及驱动因素[J]. 地理学报, 2022, 77(3): 714-735. |
| [ Mu Xueqing, Guo Xiangyang, Ming Qingzhong, et al. Dynamic evolution characteristics and driving factors of tourism ecological security in the Yellow River Basin[J]. Acta Geographica Sinica, 2022, 77(3): 714-735. ] | |
| [41] | 刘帅宾, 杨山, 王钊. 基于人口流的中国省域城镇化空间关联特征及形成机制[J]. 地理学报, 2019, 74(4): 648-663. |
| [ Liu Shuaibin, Yang Shan, Wang Zhao. Characteristics and formation mechanism of China’s provincial urbanization spatial correlation based on population flow[J]. Acta Geographica Sinica, 2019, 74(4): 648-663. ] | |
| [42] | 刘统兵, 方瑜, 黄峰, 等. 中国广义农业水土资源匹配及利用状况动态评价[J]. 农业工程学报, 2023, 39(10): 56-65. |
| [ Liu Tongbing, Fang Yu, Huang Feng. Dynamic evaluation of the matching degree and utilization condition of generalized agricultural water and arable land resources in China[J]. Transactions of the Chinese Society of Agricultural Engineering, 2023, 39(10): 56-65. ] | |
| [43] | Zhang X Y, Xiao Y A, Ramsey T S, et al. Decoupling agricultural grey water footprint from economic growth in the Yellow River Basin[J]. Water, 2024, 16(8): 1129, doi: 10.3390/w16081129. |
| [44] | 徐瑞璠, 刘文新. 黄河流域农业灰水足迹与经济增长的关系研究——基于脱钩及回弹效应[J]. 中国农业资源与区划, 2023, 44(11): 79-91. |
| [ Xu Ruifan, Liu Wenxin. Relationship between agricultural grey water footprint and economic growth in the Yellow River Basin: Based on decoupling and rebound effects[J]. Chinese Journal of Agricultural Resources and Regional Planning, 2023, 44(11): 79-91. ] | |
| [45] | 郭玮, 胡西武. 黄河流域农业灰水足迹效率时空格局演变与驱动因素[J]. 水土保持通报, 2024, 44(2): 437-445. |
| [ Guo Wei, Hu Xiwu. Spatial-temporal pattern evolution and driving factors of agricultural grey water footprint efficiency in Yellow River Basin[J]. Bulletin of Soil and Water Conservation, 2024, 44(2): 437-445. ] |
| [1] | 徐铭璟, 段宝玲, 冯强, 吕萌. 生态系统服务及其权衡/协同关系多情景模拟——以黄河流域山西段为例[J]. 干旱区地理, 2025, 48(7): 1206-1219. |
| [2] | 任诗琦, 王永瑜. 黄河流域地级市绿色发展水平测度与空间收敛性研究[J]. 干旱区地理, 2025, 48(6): 1031-1042. |
| [3] | 郭念发, 王录仓. 兰州市主城区幼儿园入学可达性及影响因素分析[J]. 干旱区地理, 2025, 48(6): 1043-1054. |
| [4] | 魏建飞, 袁悠燃, 李强, 董佩佩, 刘玖榕. 黄河流域国土空间效率时空变化及障碍因子分析[J]. 干旱区地理, 2025, 48(6): 1055-1066. |
| [5] | 王佩佩, 王娇, 蔡咏梅. 多尺度视域下中国滑雪场空间分异格局及其驱动因素研究[J]. 干旱区地理, 2025, 48(6): 1080-1088. |
| [6] | 聂寒玉, 张颜辉, 李慧, 郑姚闽. 黄河流域旅游生态韧性发展水平的时空演化及多尺度障碍因子分析[J]. 干旱区地理, 2025, 48(6): 1089-1102. |
| [7] | 谢宇, 薛选登. 数字经济赋能绿色发展福利——基于黄河流域资源型城市的经验证据[J]. 干旱区地理, 2025, 48(6): 1127-1139. |
| [8] | 王瑞芳, 吕宝奇, 张文静. 黄河流域植被动态及其对气候变化的响应——基于气候干湿分区尺度[J]. 干旱区地理, 2025, 48(6): 973-984. |
| [9] | 卢晗, 曾永年, 王盼成. 青藏高原东北部实际蒸散发时空变化特征及影响因素[J]. 干旱区地理, 2025, 48(5): 753-764. |
| [10] | 程兰花, 杨显明, 吴昕燕. 黄河流域城市紧凑度对碳排放绩效的影响[J]. 干旱区地理, 2025, 48(5): 838-853. |
| [11] | 李梦冉, 徐小任, 王梁, 段健, 史舒琪, 任丹丹. 黄河流域农业碳排放时空变化特征及影响因素分析[J]. 干旱区地理, 2025, 48(5): 854-865. |
| [12] | 刘海军, 张海虹, 闫俊杰, 李想, 李高峰. 新疆农业碳排放效率时空异质性及其影响因素[J]. 干旱区地理, 2025, 48(5): 866-878. |
| [13] | 王立奇, 李国柱. 中国城市生态韧性时空特征及影响因素分析[J]. 干旱区地理, 2025, 48(5): 893-904. |
| [14] | 庞家朋, 李梦园. 中国旅游休闲街区空间差异及成因分析[J]. 干旱区地理, 2025, 48(5): 905-915. |
| [15] | 崔盼盼, 张丽君, 秦耀辰, 夏四友. 黄河流域市域可持续发展状态评价及其驱动因素分析[J]. 干旱区地理, 2025, 48(5): 916-929. |
|
||