Arid Land Geography ›› 2022, Vol. 45 ›› Issue (4): 1071-1081.doi: 10.12118/j.issn.1000-6060.2021.446
• Climatology and Hydrology • Previous Articles Next Articles
HAN Dianchen1( ),ZHANG Fangmin1(),CHEN Jiquan2,LI Yunpeng3,LU Qi4,5,LU Yanyu6
Received:2021-10-01
Revised:2021-10-25
Online:2022-07-25
Published:2022-08-11
Contact:
Fangmin ZHANG
E-mail:20191208013@nuist.edu.cn;fmin.zhang@nuist.edu.cn
HAN Dianchen,ZHANG Fangmin,CHEN Jiquan,LI Yunpeng,LU Qi,LU Yanyu. Evapotranspiration of a semi-arid landscape in Inner Mongolia: Estimation and attribution[J].Arid Land Geography, 2022, 45(4): 1071-1081.

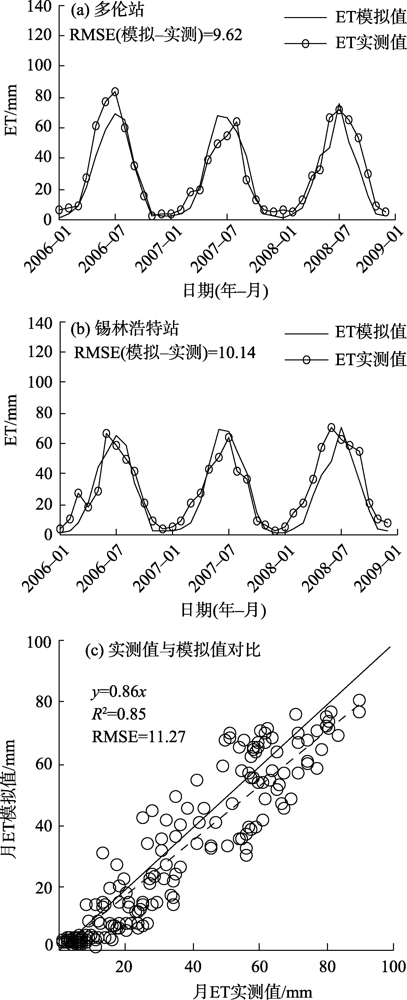
Fig. 1
Distribution map of study area"

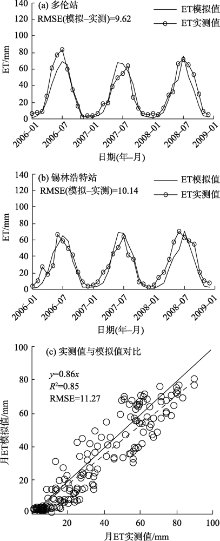
Fig. 2
Changes and comparison of simulated and measured values of monthly evapotranspiration from 2006 to 2008"
Tab. 1
Comparisons of simulated values from BEPS model and measured data"
| 纬度/°N | 经度/°E | 年份 | ET实测值/mm | ET模拟值/mm | T实测值/mm | T模拟值/mm | T/ET实测值 | T/ET模拟值 | 参考文献 |
|---|---|---|---|---|---|---|---|---|---|
| 42.05 | 116.28 | 2006 | 433.53 | 423.60 | - | - | - | - | [ |
| 43.55 | 116.67 | 2006 | 281.57 | 317.76 | - | - | - | - | [ |
| 44.13 | 116.33 | 2004 | 323.14 | 294.12 | - | - | - | - | [ |
| 2006 | 318.04 | 297.60 | - | - | - | - | [ | ||
| 43.53 | 116.67 | 2006 | 307.70 | 316.92 | - | - | - | - | [ |
| 2011 | 415.12 | 389.25 | - | - | - | - | [ | ||
| 43.63 | 116.71 | 2004 | - | - | 155.25 | 158.64 | - | - | [ |
| 2006 | - | - | 95.70 | 99.80 | - | - | [ | ||
| 43.60 | 116.70 | 2003—2005 | - | - | - | - | 0.44 | 0.45 | [ |
| 43.50 | 116.70 | 2003(5—9月) | - | - | - | - | 0.62 | 0.63 | [ |
Tab. 2
Average annual water consumption of different surface types in the study area from 1981 to 2018 /mm"
| 地表类型 | PRE | E | T | ET | PRE-ET |
|---|---|---|---|---|---|
| 草地 | 309.54 | 170.20 | 108.02 | 278.22 | 31.32 |
| 农田 | 350.07 | 149.73 | 212.77 | 362.50 | -12.43 |
| 森林 | 362.33 | 119.17 | 189.64 | 308.81 | 53.52 |
Fig. 3
Trends of evaporation, transpiration, evapotranspiration and transpiration/evapotranspiration in the study area from 1981 to 2018"
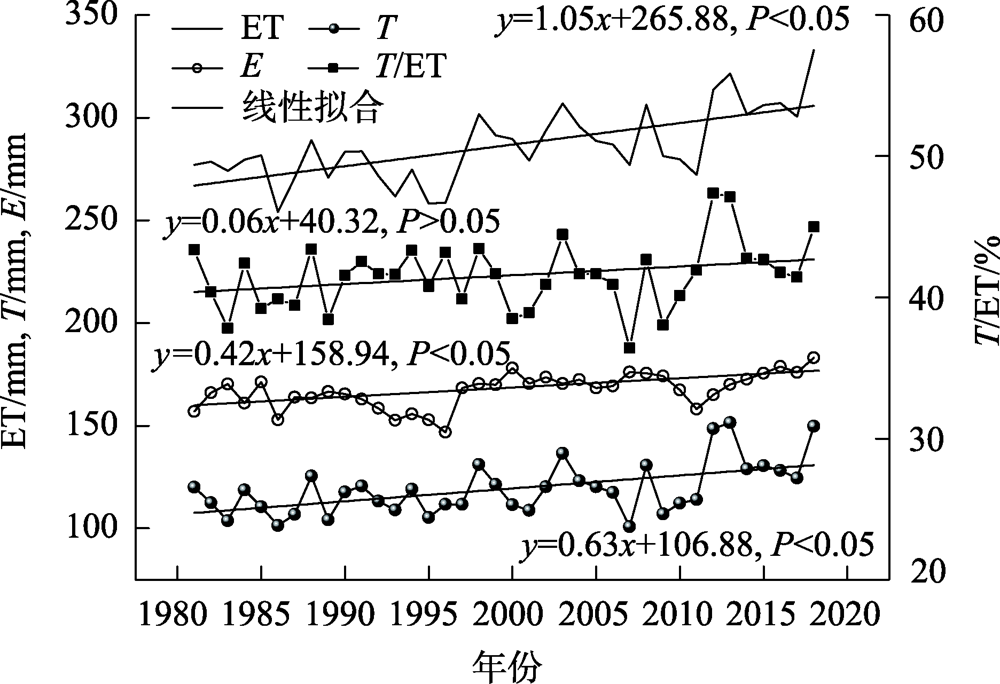

Fig. 4
Spatial distributions of evaporation, transpiration, evapotranspiration and transpiration/evapotranspiration in the study area from 1981 to 2018"
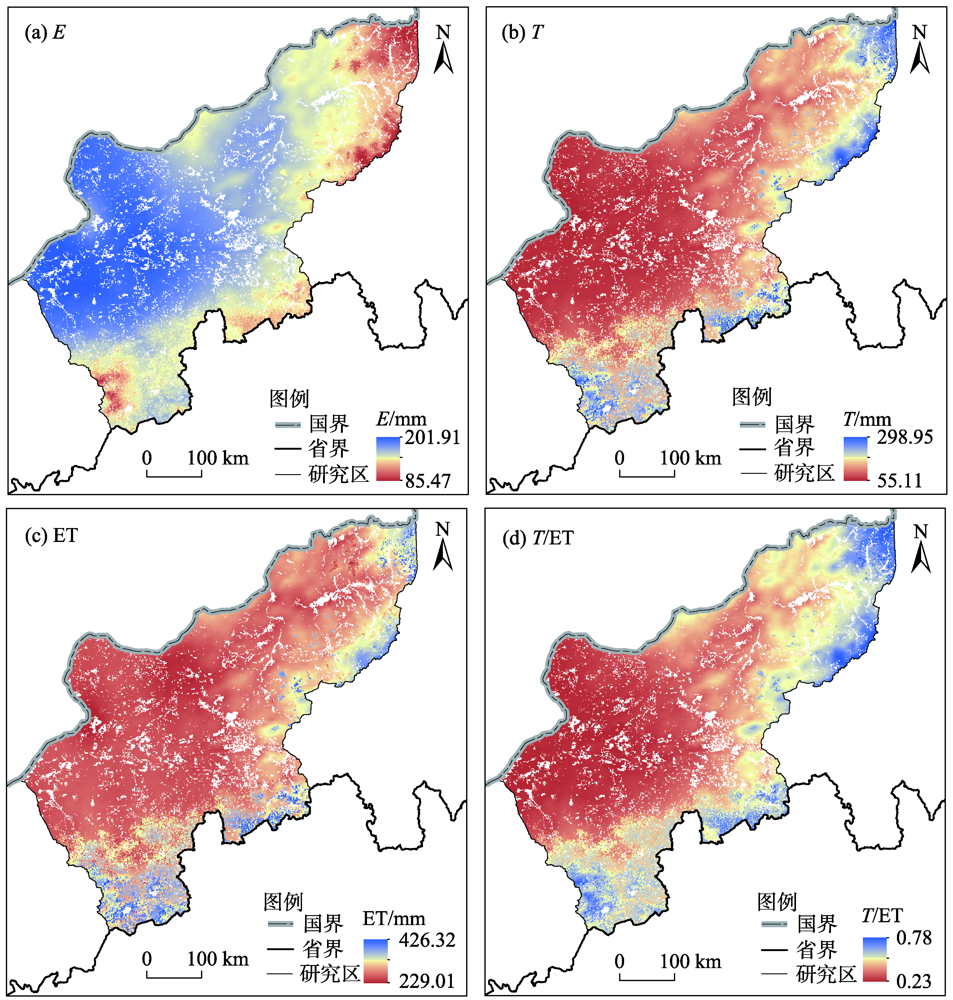
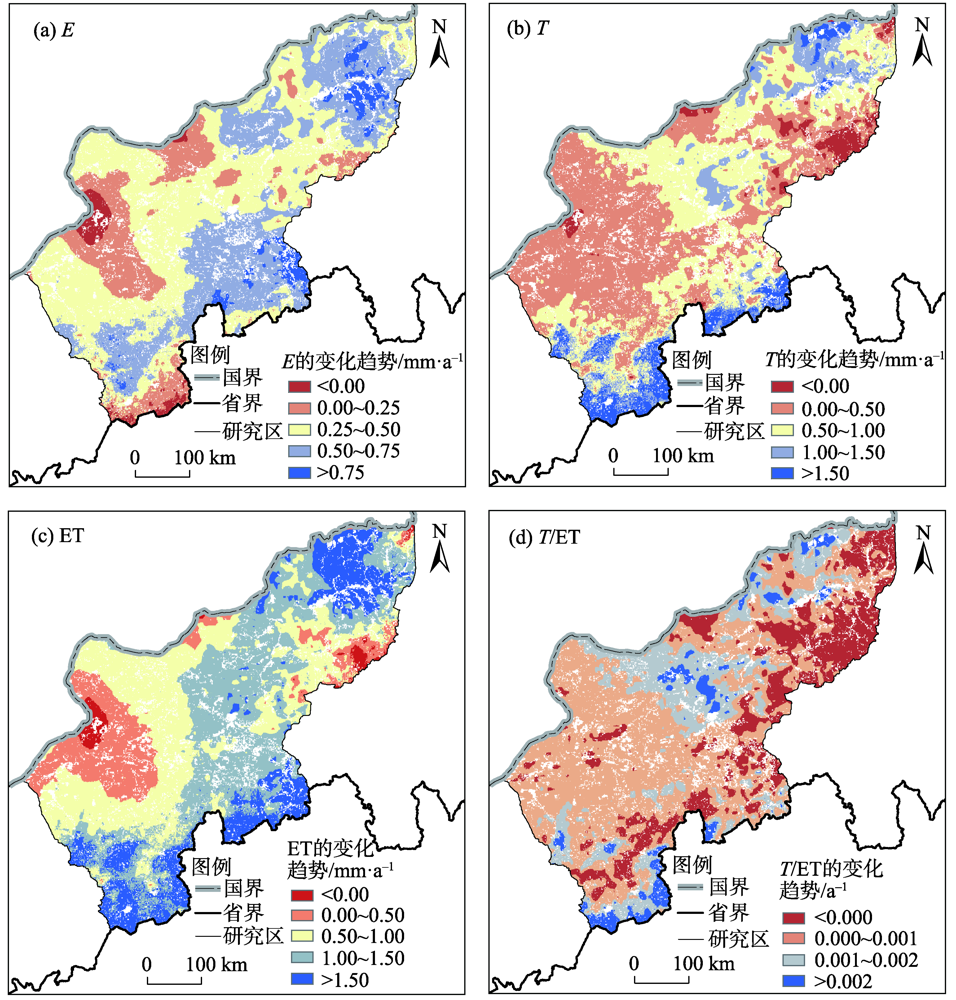
Fig. 5
Spatial distributions of change rates for evaporation, transpiration, evapotranspiration and transpiration/evapotranspiration in the study area from 1981 to 2018"
Tab. 3
Change statistics of main influencing factors of the study area from 1981 to 2018"
| 地表类型 | NDVI/a-1 | TEMP/°C·a-1 | PRE/mm·a-1 | VPD/kPa·a-1 | RAD/W·m-2·a-1 |
|---|---|---|---|---|---|
| 全区域 | 0.0001 | 0.05 | -0.88 | 0.002 | -0.11 |
| 草地 | 0.0002 | 0.05 | -0.92 | 0.002 | -0.10 |
| 农田 | -0.0003 | 0.05 | -0.32 | 0.002 | -0.17 |
| 森林 | -0.0004 | 0.05 | -1.00 | 0.002 | -0.08 |
Tab. 4
Contribution analysis of influencing regulators to evaporation dynamics in the study area from 1981 to 2018"
| 地表类型 | 相对贡献/% | E相对变化率/% | R2 | 主导因子排序 | ||||
|---|---|---|---|---|---|---|---|---|
| NDVI | TEMP | PRE | VPD | RAD | ||||
| 全区域 | -0.08 | 1.11 | 1.94 | 7.32 | -1.32 | 9.55 | 0.94 | VPD>PRE>RAD>TEMP>NDVI |
| 草地 | -0.17 | 1.09 | 1.50 | 7.38 | -0.72 | 9.38 | 0.96 | VPD>PRE>TEMP>RAD>NDVI |
| 农田 | 1.45 | 1.11 | 1.02 | 8.54 | -1.84 | 10.90 | 0.94 | VPD>RAD>NDVI>TEMP>PRE |
| 森林 | 1.46 | 2.25 | 1.19 | 12.22 | -2.46 | 15.90 | 0.92 | VPD>RAD>TEMP>NDVI>PRE |
Tab. 5
Contribution analysis of influencing regulators to transpiration dynamics in the study area from 1981 to 2018"
| 地表类型 | 相对贡献/% | T相对变化率/% | R2 | 主导因子排序 | ||||
|---|---|---|---|---|---|---|---|---|
| NDVI | TEMP | PRE | VPD | RAD | ||||
| 全区域 | 3.42 | 5.41 | -1.12 | 11.50 | -2.37 | 20.09 | 0.84 | VPD>TEMP>NDVI>RAD>PRE |
| 草地 | 4.67 | 5.35 | -1.63 | 10.13 | -1.74 | 19.34 | 0.86 | VPD>TEMP>NDVI>RAD>PRE |
| 农田 | -1.31 | 8.37 | -1.12 | 16.49 | -1.63 | 24.80 | 0.84 | VPD>TEMP>RAD>NDVI>PRE |
| 森林 | -3.49 | 3.27 | -0.63 | 13.04 | -1.14 | 13.83 | 0.85 | VPD>NDVI>TEMP>RAD>PRE |
Tab. 6
Contribution analysis of influencing regulators to evapotranspiration dynamics in the study area from 1981 to 2018"
| 地表类型 | 相对贡献/% | ET相对变化率/% | R2 | 主导因子排序 | ||||
|---|---|---|---|---|---|---|---|---|
| NDVI | TEMP | PRE | VPD | RAD | ||||
| 全区域 | 0.79 | 4.96 | -1.01 | 10.84 | -2.84 | 13.93 | 0.91 | VPD>TEMP>RAD>PRE>NDVI |
| 草地 | 2.44 | 2.88 | -0.33 | 8.65 | -1.49 | 13.25 | 0.91 | VPD>TEMP>NDVI>RAD>PRE |
| 农田 | -1.54 | 6.65 | -0.65 | 15.34 | -2.07 | 19.10 | 0.92 | VPD>TEMP>RAD>NDVI>PRE |
| 森林 | -1.32 | 3.27 | -0.63 | 13.04 | -1.14 | 14.64 | 0.90 | VPD>TEMP>NDVI>RAD>PRE |
| [1] |
Thornthwaite C W. An approach toward a rational classification of climate[J]. Geographical Review, 1948, 38(1): 55-94.
doi: 10.2307/210739 |
| [2] |
Burba G G, Verma S B. Seasonal and interannual variability in evapotranspiration of native tallgrass prairie and cultivated wheat ecosystems[J]. Agricultural and Forest Meteorology, 2005, 135(1-4): 190-201.
doi: 10.1016/j.agrformet.2005.11.017 |
| [3] |
Li Z, Liu X, Niu T, et al. Ecological restoration and its effects on a regional climate: The source region of the Yellow River, China[J]. Environmental Science and Technology, 2015, 49(10): 5897-5904.
doi: 10.1021/es505985q |
| [4] | 宁亚洲, 张福平, 冯起, 等. 基于SEBAL模型的疏勒河流域蒸散发估算与灌溉效率评价[J]. 干旱区地理, 2020, 43(4): 928-938. |
| [ Ning Yazhou, Zhang Fuping, Feng Qi, et al. Estimation of evapotranspiration in Shule River Basin based on SEBAL model and evaluation on irrigation efficiency[J]. Arid Land Geography, 2020, 43(4): 928-938. ] | |
| [5] | 黄建平, 季明霞, 刘玉芝, 等. 干旱半干旱区气候变化研究综述[J]. 气候变化研究进展, 2013, 9(1): 9-14. |
| [ Huang Jianping, Ji Mingxia, Liu Yuzhi, et al. An overview of arid and semi-arid climate change[J]. Climate Change Research, 2013, 9(1): 9-14. ] | |
| [6] | 李鹏飞, 孙小明, 赵昕奕. 近50年中国干旱半干旱地区降水量与潜在蒸散量分析[J]. 干旱区资源与环境, 2012, 26(7): 57-63. |
| [ Li Pengfei, Sun Xiaoming, Zhao Xinyi. Analysis of precipitation and potential evapotranspiration in arid and semi-arid area of China in recent 50 years[J]. Journal of Arid Land Resources and Environment, 2012, 26(7): 57-63. ] | |
| [7] | 吴国栋, 薛河儒, 刘廷玺. 1961-2016年锡林河流域降水及平均气温变化特征及趋势[J]. 干旱区地理, 2021, 44(3): 769-777. |
| [ Wu Guodong, Xue Heru, Liu Tingxi. Change characteristics and trends of precipitation and average temperature in the Xilinhe River Basin from 1961 to 2016[J]. Arid Land Geography, 2021, 44(3): 769-777. ] | |
| [8] |
Zhang K, John S, Kimball, et al. A review of remote sensing based actual evapotranspiration estimation[J]. Wiley Interdisciplinary Reviews: Water, 2016, 3(6): 834-853.
doi: 10.1002/wat2.1168 |
| [9] | 代鹏超, 牛苏娟, 毋兆鹏, 等. 新疆精河流域实际蒸散发时空变化特征[J]. 生态与农村环境学报, 2017, 33(7): 600-606. |
| [ Dai Pengchao, Niu Sujuan, Wu Zhaopeng, et al. Temporal and spatial characteristics of actual evapotranspiration in Jinghe Watershed, Xinjiang[J]. Journal of Ecology and Rural Environment, 2017, 33(7): 600-606. ] | |
| [10] | 金学杰, 周剑. 基于SEBS模型和Landsat 8数据的黑河下游蒸散发时空特性分析[J]. 冰川冻土, 2017, 39(3): 572-582. |
| [ Jin Xuejie, Zhou Jian. Analysis of spatial-temporal characteristics of evapotranspiration in the lower reaches of Heihe River based on surface energy balance system model and Landsat 8 data[J]. Journal of Glaciology and Geocryology, 2017, 39(3): 572-582. ] | |
| [11] | 蹇东南, 李修仓, 陶辉, 等. 基于互补相关理论的塔里木河流域实际蒸散发时空变化及影响因素分析[J]. 冰川冻土, 2016, 38(3): 750-760. |
| [ Jian Dongnan, Li Xiucang, Tao Hui, et al. Spatio-temporal variation of actual evapotranspiration and its influence factors in the Tarim River Basin based on the complementary relationship approach[J]. Journal of Glaciology and Geocryology, 2016, 38(3): 750-760. ] | |
| [12] | 王思如, 雷慧闽, 段利民, 等. 气候变化对科尔沁沙地蒸散发和植被的影响[J]. 水利学报, 2017, 48(5): 535-544. |
| [ Wang Siru, Lei Huimin, Duan Limin, et al. Simulated impacts of climate change on evapotranspiration and vegetation in Horqin Sandy Land[J]. Journal of Hydraulic Engineering, 2017, 48(5): 535-544. ] | |
| [13] | 赵水霞, 王文君, 吴英杰, 等. 近59a锡林郭勒草原旱灾驱动气候因子分析[J]. 干旱区研究, 2021, 38(3): 785-793. |
| [ Zhao Shuixia, Wang Wenjun, Wu Yingjie, et al. Analysis of drought-driving climatic factors of Xilin Gol grassland in the past 59 years[J]. Arid Zone Research, 2021, 38(3): 785-793. ] | |
| [14] | 韩典辰, 张方敏, 陈吉泉, 等. 半干旱区草地站蒸散特征及其对气象因子和植被的响应[J]. 草地学报, 2021, 29(1): 166-173. |
| [ Han Dianchen, Zhang Fangmin, Chen Jiquan, et al. Charcteristics of grassland evapotranspiration in semi-arid area and its responses to meteorological factors and vegetation[J]. Acta Agrestia Sinica, 2021, 29(1): 166-173. ] | |
| [15] |
Liu J, Chen J M, Cihlar J, et al. A process-based Boreal ecosystem productivity simulator using remote sensing inputs[J]. Remote Sensing of Environment, 1997, 62: 158-175.
doi: 10.1016/S0034-4257(97)00089-8 |
| [16] |
Chen J M, Liu J, Cihlar J, et al. Daily canopy photosynthesis model through temporal and spatial scaling for remote sensing applications[J]. Ecological Modeling, 1999, 124: 99-119.
doi: 10.1016/S0304-3800(99)00156-8 |
| [17] |
Zhang F M, Ju W M, Shen S H, et al. Variations of terrestrial net primary productivity in East Asia[J]. Terrestrial Atmospheric and Oceanic Sciences, 2012, 23(4): 425-437.
doi: 10.3319/TAO.2012.03.28.01(A) |
| [18] | 张方敏, 居为民, 陈镜明, 等. 基于BEPS生态模型对亚洲东部地区蒸散量的模拟[J]. 自然资源学报, 2010, 25(9): 1596-1606. |
| [ Zhang Fangmin, Ju Weimin, Chen Jingming, et al. Study on evapotranspiration in East Asia using the BEPS ecological model[J]. Journal of Natural Resources, 2010, 25(9): 1596-1606. ] | |
| [19] |
Zhang F M, Ju W M, Shen S H, et al. How recent climate change influences water use efficiency in East Asia[J]. Theoretical and Applied Climatology, 2014, 116(1): 359-370.
doi: 10.1007/s00704-013-0949-2 |
| [20] |
Chen J M, Chen X Y, Ju W M, et al. Distributed hydrological model for mapping evapotranspiration using remote sensing inputs[J]. Journal of Hydrology, 2005, 305: 15-39.
doi: 10.1016/j.jhydrol.2004.08.029 |
| [21] | Liu J, Chen J M, Cihlar J. Mapping evapotranspiration based on remote sensing: An application to Canada’s landmass[J]. Water Resources Research, 2003, 39: 1189-1200. |
| [22] | 肇毓锋, 吴奇. 多时间尺度下Kriging与IDW空间插值方法的适用性研究[J]. 黑龙江水利科技, 2020, 48(11): 9-14. |
| [ Zhao Yufeng, Wu Qi. Applicability of Kriging and IDW spatial interpolation methods on multiple time scales[J]. Heilongjiang Hydraulic Science and Technology, 2020, 48(11): 9-14. ] | |
| [23] |
Liu Y, Liu R G, Chen J M. Retrospective retrieval of long-term consistent global leaf area index (1981-2011) from combined AVHRR and MODIS data[J]. Journal of Geophysical Research, 2012, 117: G04003, doi: 10.1029/2012JG002084.
doi: 10.1029/2012JG002084 |
| [24] |
Brent N H. Characteristics of maximum-value composite images from temporal AVHRR data[J]. International Journal of Remote Sensing, 1986, 7(11): 1417-1434.
doi: 10.1080/01431168608948945 |
| [25] |
Falge E, Baldocchi D, Olson R, et al. Gap filling strategies for defensible annual sums of net ecosystem exchange[J]. Agricultural and Forest Meteorology, 2001, 107(1): 43-69.
doi: 10.1016/S0168-1923(00)00225-2 |
| [26] | 翁升恒, 张方敏, 冯妍, 等. 江淮流域稻麦轮作蒸散特征及其影响因子[J]. 节水灌溉, 2020(8): 27-33. |
| [ Weng Shengheng, Zhang Fangmin, Feng Yan, et al. Characteristics of evapotranspiration and its influencing factors in rice-wheat rotation in the Jianghuai River Basin[J]. Water Saving Irrigation, 2020(8): 27-33. ] | |
| [27] |
Miao H, Chen S, Chen J, et al. Cultivation and grazing altered evapotranspiration and dynamics in Inner Mongolia steppes[J]. Agricultural and Forest Meteorology, 2009, 149(11): 1810-1819.
doi: 10.1016/j.agrformet.2009.06.011 |
| [28] |
Tian D, Niu S, Pan Q, et al. Nonlinear responses of ecosystem carbon fluxes and water-use efficiency to nitrogen addition in Inner Mongolia grassland[J]. Functional Ecology, 2016, 30(3): 490-499.
doi: 10.1111/1365-2435.12513 |
| [29] | 毕彦杰, 赵晶, 赵勇, 等. 京津冀地区潜在蒸散量时空演变特征及归因分析[J]. 农业工程学报, 2020, 36(5): 130-140. |
| [ Bi Yanjie, Zhao Jing, Zhao Yong, et al. Spatial-temporal variation characteristics and attribution analysis of potential evapotranspiration in Beijing-Tianjin-Hebei region[J]. Transactions of the Chinese Society of Agricultural Engineering, 2020, 36(5): 130-140. ] | |
| [30] |
Chen S, Chen J, Lin G, et al. Energy balance and partition in Inner Mongolia steppe ecosystems with different land use types[J]. Agricultural and Forest Meteorology, 2009, 149(11): 1800-1809.
doi: 10.1016/j.agrformet.2009.06.009 |
| [31] | Zheng Han, Yu Guirui, Wang Qiufeng, et al. Spatial variation in annual actual evapotranspiration of terrestrial ecosystems in China: Results from eddy covariance measurements[J]. Journal of Geographical Sciences, 2016(10): 1391-1411. |
| [32] |
Niu Z, He H, Zhu G, et al. A spatial-temporal continuous dataset of the transpiration to evapotranspiration ratio in China from 1981-2015[J]. Scientific Data, 2020, 7(1): 369, doi: 10.1038/s41597-020-00693-x.
doi: 10.1038/s41597-020-00693-x |
| [33] |
Chen Y, Lee G, Lee P, et al. Model analysis of grazing effect on above-ground biomass and above-ground net primary production of a Mongolian grassland ecosystem[J]. Journal of Hydrology, 2007, 333(1): 155-164.
doi: 10.1016/j.jhydrol.2006.07.019 |
| [34] | Hu Z, Yu G, Zhou Y, et al. Partitioning of evapotranspiration and its controls in four grassland ecosystems: Application of a two-source model[J]. Agricultural & Forest Meteorology, 2009, 149(9): 1410-1420. |
| [35] |
Huang X, Hao Y, Wang Y, et al. Partitioning of evapotranspiration and its relation to carbon dioxide fluxes in Inner Mongolia steppe[J]. Journal of Arid Environments, 2010, 74(12): 1616-1623.
doi: 10.1016/j.jaridenv.2010.07.005 |
| [36] |
Li X, Lin C J, Sun Z, et al. A simple and objective method to partition evapotranspiration into transpiration and evaporation at eddy-covariance sites[J]. Agricultural and Forest Meteorology, 2019, 265: 171-182.
doi: 10.1016/j.agrformet.2018.11.017 |
| [37] | 牛忠恩, 胡克梅, 何洪林, 等. 2000-2015年中国陆地生态系统蒸散时空变化及其影响因素[J]. 生态学报, 2019, 39(13): 4697-4709. |
| [ Niu Zhong’en, Hu Kemei, He Honglin, et al. The spatial-temporal patterns of evapotranspiration and its influencing factors in Chinese terrestrial ecosystem from 2000 to 2015[J]. Acta Ecologica Sinica, 2019, 39(13): 4697-4709. ] | |
| [38] |
Liu S, Li S G, Yu G R, et al. Seasonal and interannual variations in water vapor exchange and surface water balance over a grazed steppe in central Mongolia[J]. Agricultural Water Management, 2010, 97(6): 857-864.
doi: 10.1016/j.agwat.2010.01.016 |
| [39] |
Jiang Z, Yang Z, Zhang S, et al. Revealing the spatio-temporal variability of evapotranspiration and its components based on an improved Shuttleworth-Wallace model in the Yellow River Basin[J]. Journal of Environmental Management, 2020, 262: 110310, doi: 10.1016/j.jenvman.2020.110310.
doi: 10.1016/j.jenvman.2020.110310 |
| [40] |
Xiao L R, Lu Q Q, He H L, et al. Estimation and analysis of the ratio of transpiration to evapotranspiration in forest ecosystems along the north-south transect of east China[J]. Journal of Geographical Sciences, 2019, 29(11): 1807-1822.
doi: 10.1007/s11442-019-1691-1 |
| [41] |
Zhao J, Liang W, Yang Y T, et al. Separating vegetation greening and climate change controls on evapotranspiration trend over the Loess Plateau[J]. Scientific Reports, 2017, 7(1): 951-954.
doi: 10.1038/s41598-017-01122-7 |
| [42] | 赵晓涵, 张方敏, 韩典辰, 等. 内蒙古半干旱区蒸散特征及归因分析[J]. 干旱区研究, 2021, 38(6): 1614-1623. |
| [ Zhao Xiaohan, Zhang Fangmin, Han Dianchen, et al. Evapotranspiration changes and its attribution in semi-arid regions of Inner Mongolia[J]. Arid Zone Research, 2021, 38(6): 1614-1623. ] | |
| [43] |
Naama R Y, Dan Y, Gabriel S, et al. Dynamics of evapotranspiration partitioning in a semi-arid forest as affected by temporal rainfall patterns[J]. Agricultural and Forest Meteorology, 2012, 157: 77-85.
doi: 10.1016/j.agrformet.2012.01.015 |
| [44] |
Gokmen M, Vekerdy Z, Verhoef W, et al. Satellite-based analysis of recent trends in the ecohydrology of a semi-arid region[J]. Hydrology and Earth System Sciences, 2013, 17(10): 3779-3794.
doi: 10.5194/hess-17-3779-2013 |
| [1] | LI Hongyang, CHEN Tianyu, WANG Shengjie, ZHANG Mingjun. Spatiotemporal variations of potential evapotranspiration on the northern slope of the Kunlun Mountains in Xinjiang from 1979 to 2021 [J]. Arid Land Geography, 2024, 47(9): 1443-1450. |
| [2] | LI Zhi, ZHU Chenggang, WANG Jiayou, LIU Yongchang, WANG Chuan, ZHANG Xueqi, HAN Shiru, FANG Gonghuan. Estimation of evaporation loss from typical lakes in the Kumukuli Basin, East Kunlun Mountains [J]. Arid Land Geography, 2024, 47(8): 1263-1276. |
| [3] | LIU Yu, MEI Hua, FAN Wenbo, REN Congzhe, WANG Shiwei, LI Shunshun. Temporal and spatial characteristics of drought in the Ta’e Basin from 1992 to 2022 based on the SPEI index [J]. Arid Land Geography, 2024, 47(8): 1338-1347. |
| [4] | MA Yali, NIU Zuirong, SUN Dongyuan. Relationship between changes in spatial and temporal patterns of potential evapotranspiration and meteorological factors in the Hexi Corridor [J]. Arid Land Geography, 2024, 47(2): 192-202. |
| [5] | LIU Wenli, CHEN Zhang, ZHAO Yong, LIANG Yuxin. Influences of soil moisture anomalies in May on June precipitation in Central Asia [J]. Arid Land Geography, 2024, 47(1): 38-47. |
| [6] | WANG Xin, JIN Zhengzhong, SHI Jianfei, YANG Xiaoliang, XU Xinwen. Effect of plant fiber blanket cover on hydrothermal distribution of tailing sand in arid area [J]. Arid Land Geography, 2023, 46(9): 1467-1480. |
| [7] | GUO Min, LI Xinhu, WANG Hongchao, LI Jialin. Effect of salt crust thickness on distribution characteristics of soil water and salt [J]. Arid Land Geography, 2023, 46(8): 1303-1313. |
| [8] | GAO Xiaoyu, HAO Haichao, ZHANG Xueqi, CHEN Yaning. Responses of vegetation water use efficiency to meteorological factors in arid areas of northwest China: A case of Xinjiang [J]. Arid Land Geography, 2023, 46(7): 1111-1120. |
| [9] | WEI Tao, WANG Yunquan. Temporal and spatial dynamic analysis of terrestrial evapotranspiration in China based on PML-V2 product [J]. Arid Land Geography, 2023, 46(6): 857-867. |
| [10] | YANG Yifei, YANG Pengnian, WANG Changshu, KOU Xin, TAN Fan, XU Jie, WANG Cui. Effectiveness evaluation of water consumption in agricultural land of Yanqi Basin, Xinjiang [J]. Arid Land Geography, 2023, 46(5): 730-741. |
| [11] | CAO Yujuan, SI Wenyang, DU Ziqiang, LIANG Hanxue, LEI Tianjie, SUN Bin, WU Zhitao. Changes in GPP of China during the typical drought years from 1982 to 2017 [J]. Arid Land Geography, 2023, 46(10): 1577-1590. |
| [12] | HE Xugang, Mamat SAWUT, SHENG Yanfang, LI Rongpeng. Remote sensing estimation of cotton water productivity in Ugan-Kuqa River Oasis based on Google Earth Engine [J]. Arid Land Geography, 2023, 46(10): 1632-1642. |
| [13] | MEI Jing, SUN Meiping, LI Lin. Variations of evapotranspiration and its components in alpine meadow on the Tibetan Plateau based on SWH model [J]. Arid Land Geography, 2022, 45(6): 1740-1751. |
| [14] | FU Yinghao, SHEN Xiaojing, LI Wangcheng, WU Xu, ZHANG Qingqing. Applicability of reference crop evapotranspiration calculation based on Hargreaves-Samani regression correction [J]. Arid Land Geography, 2022, 45(6): 1752-1760. |
| [15] | HAN Rucun,ZHANG Ying,LI Zhanling. Effects of two uncertainty sources on drought index of SPEI and on drought assessment [J]. Arid Land Geography, 2022, 45(5): 1392-1401. |
|
||