Arid Land Geography ›› 2025, Vol. 48 ›› Issue (12): 2143-2157.doi: 10.12118/j.issn.1000-6060.2025.044
• Climate Change and Surface Process • Previous Articles Next Articles
GUO Jiali1( ), MA Yonggang2,3(), PAN Heng1, LI Na1, SUN Changning1, SUN Qian1, ZHOU Wenchang1, DANG Yuxuan1
Received:2025-05-21
Revised:2025-05-28
Online:2025-12-25
Published:2025-12-30
Contact:
MA Yonggang
E-mail:107552201225@stu.xju.edu.cn;mayg@xju.edu.cn
GUO Jiali, MA Yonggang, PAN Heng, LI Na, SUN Changning, SUN Qian, ZHOU Wenchang, DANG Yuxuan. Comparative analysis of satellite monitoring of soil salinization in Ebinur Lake during spring and summer[J].Arid Land Geography, 2025, 48(12): 2143-2157.

Fig. 1
Distribution of sampling sites in the study area"
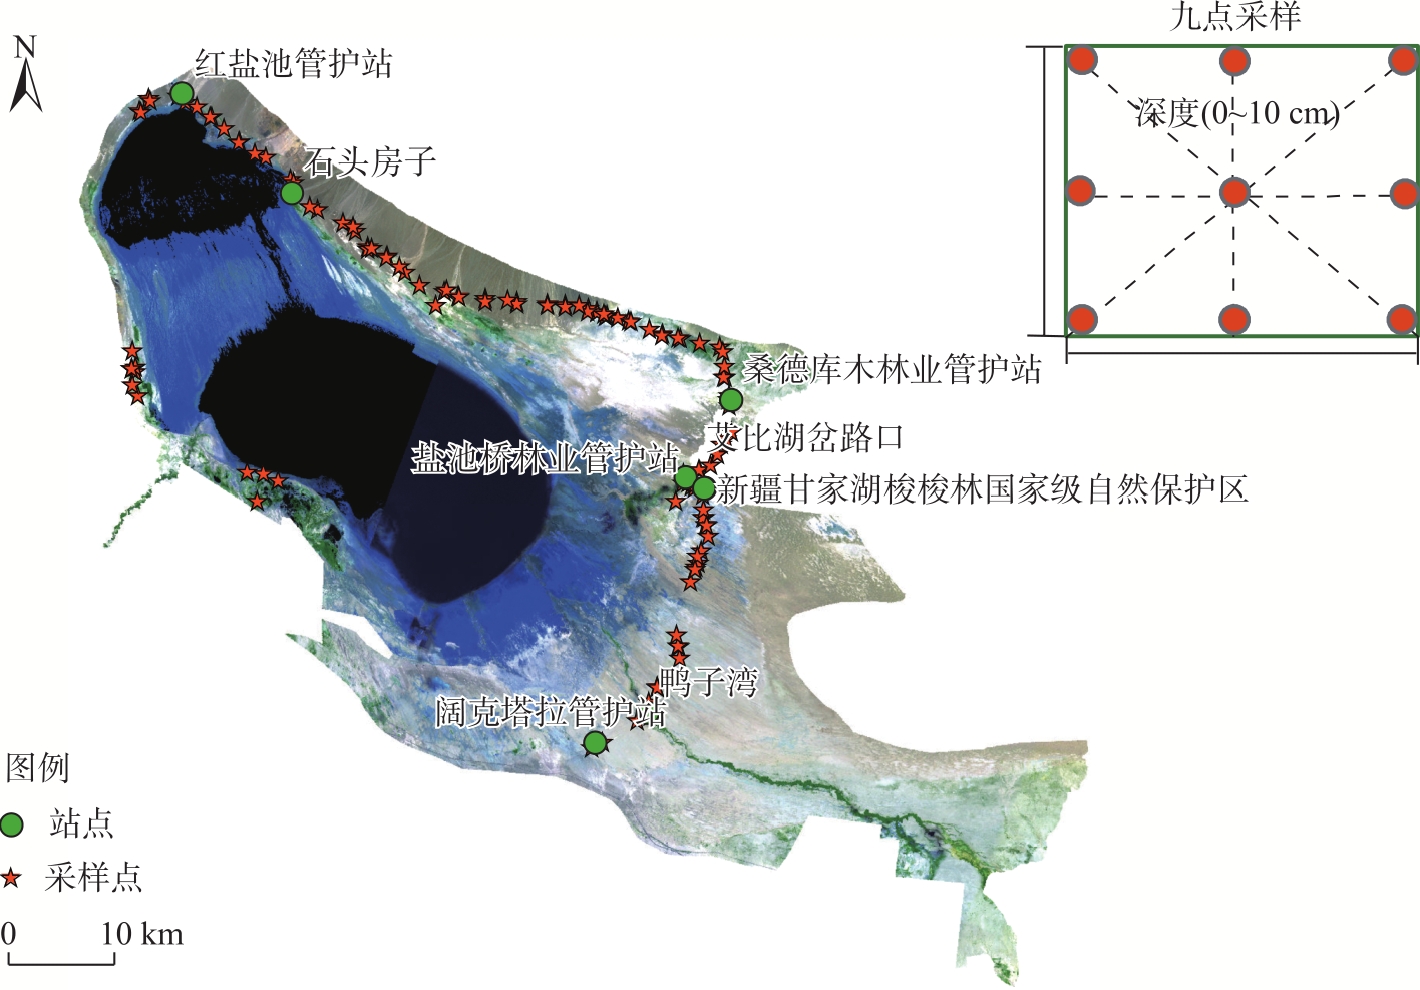
Fig. 2
Schematic diagram of sample plots"

Tab. 1
Introduction to Sentinel-2A bands"
| 波段 | 中心波长/nm | 分辨率/m | 描述 |
|---|---|---|---|
| 沿海气溶液(B1) | 443 | 60 | 气溶胶、海岸带监测 |
| 蓝波段(B2) | 490 | 10 | 识别表层盐结皮 |
| 绿波段(B3) | 560 | 10 | 区分植被覆盖与裸土盐渍化 |
| 红波段(B4) | 665 | 10 | 与植被指数结合减少植被干扰 |
| 红边1波段(B5) | 705 | 20 | 生物量监测 |
| 红边2波段(B6) | 740 | 20 | 作物胁迫检测 |
| 红边3波段(B7) | 783 | 20 | 叶绿素含量 |
| 近红外波段(B8) | 842 | 10 | 植被覆盖度 |
| 窄近红外波段(B8A) | 865 | 20 | 植被水分 |
| 水汽波段(B9) | 940 | 60 | 水汽吸收 |
| 卷云波段(B10) | 1375 | 60 | 大气水汽吸收(无地表信息) |
| 短波红外1波段(B11) | 1610 | 20 | 水分、盐分敏感 |
| 短波红外2波段(B12) | 2190 | 20 | 盐分敏感 |
Tab. 2
Calculation formulae for the main remote sensing indices"
| 类型 | 光谱指数 | 简称 | 计算公式 | 参考文献 |
|---|---|---|---|---|
| 植被指数 | 增强植被指数 | EVI | [ | |
| 比值植被指数 | RVI | B8/B4 | [ | |
| 差值植被指数 | DVI | B8-B4 | [ | |
| 归一化植被指数 | NDVI | [ | ||
| 修正归一化差值植被指数 | MNDVI | [ | ||
| 土壤调整植被指数 | TNDVI | [ | ||
| 土壤条件植被指数 | SAVI | [ | ||
| 绿光归一化差值植被指数 | GNDVI | [ | ||
| 盐分指数 | 盐分指数 | SI | [ | |
| SI1 | [ | |||
| SI2 | [ | |||
| SI3 | [ | |||
| S1 | B2/B4 | [ | ||
| S2 | [ | |||
| S3 | [ | |||
| S5 | [ | |||
| S6 | [ | |||
| 归一化盐分指数 | NDSI | [ | ||
| 比值指数 | RI | B4/B12 | [ | |
| 差值指数 | DI | B3-B7 | [ | |
| 归一化差值指数 | NDI | [ | ||
| 强度指数1 | Int1 | [ | ||
| 强度指数2 | Int2 | [ |
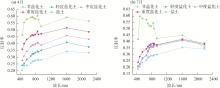
Fig. 3
Wavelength-multispectral reflectance curve"

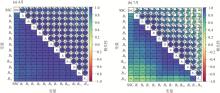
Fig. 4
Correlation of bands and soil salinity"

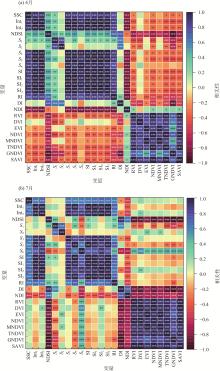
Fig. 5
Correlation of multispectral index with soil salinity"

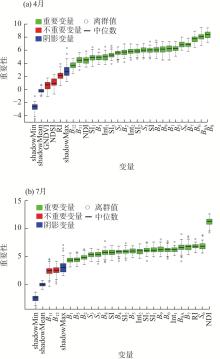
Fig. 6
Boruta variable screening"
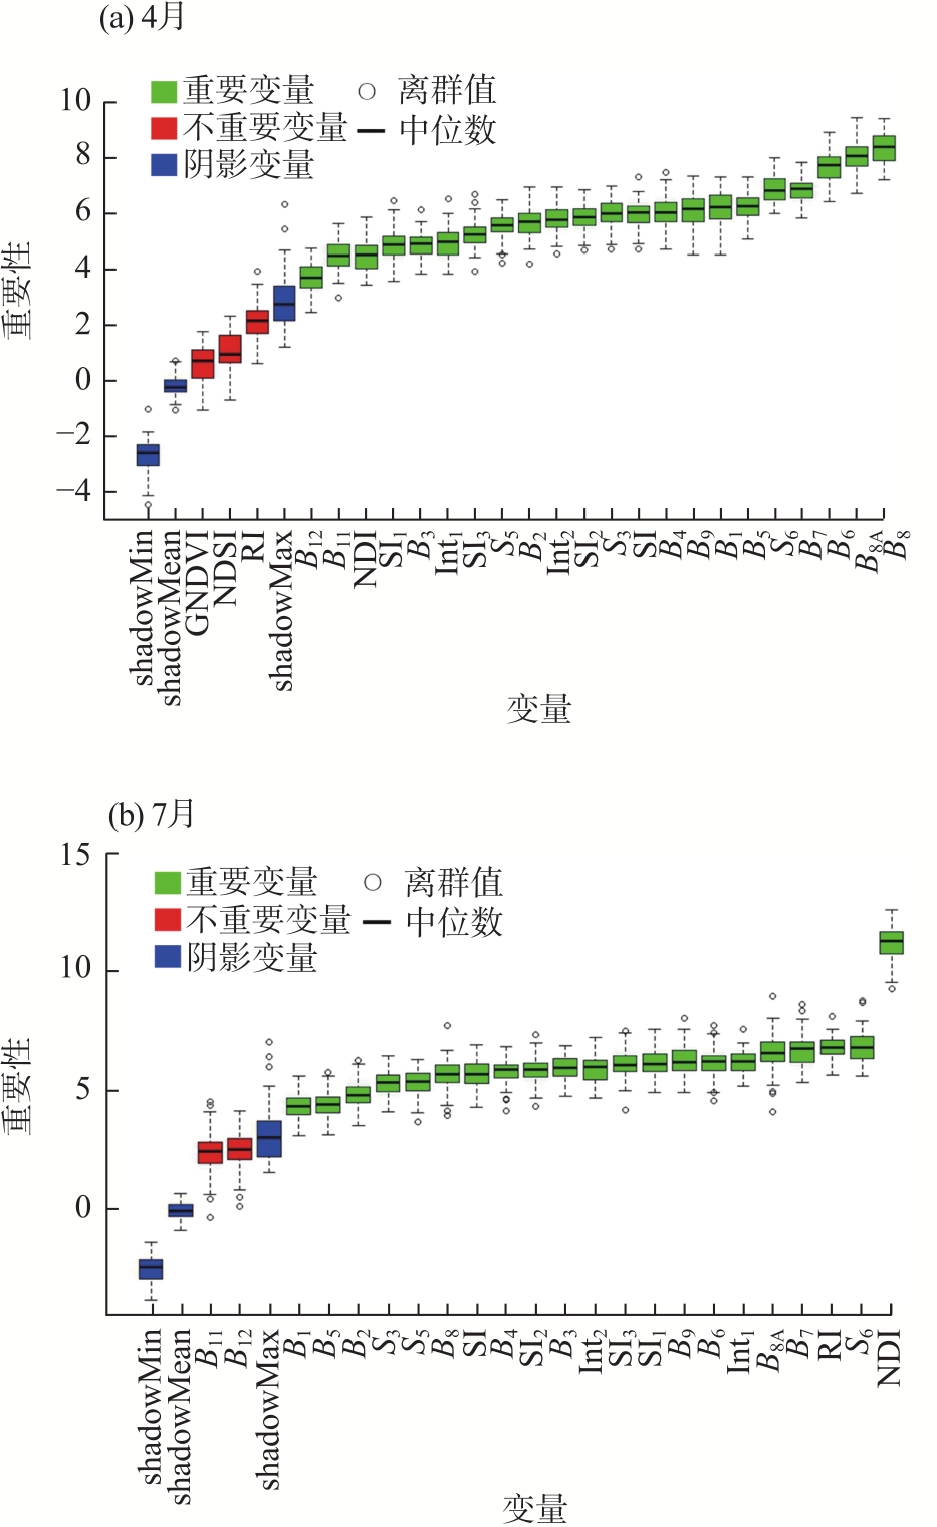
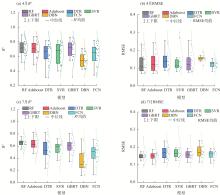
Fig. 7
Accuracy evaluation of soil salinity inversion using Boruta algorithm for variable selection"


Fig. 8
Comparison of measured and predicted soil salinity value"
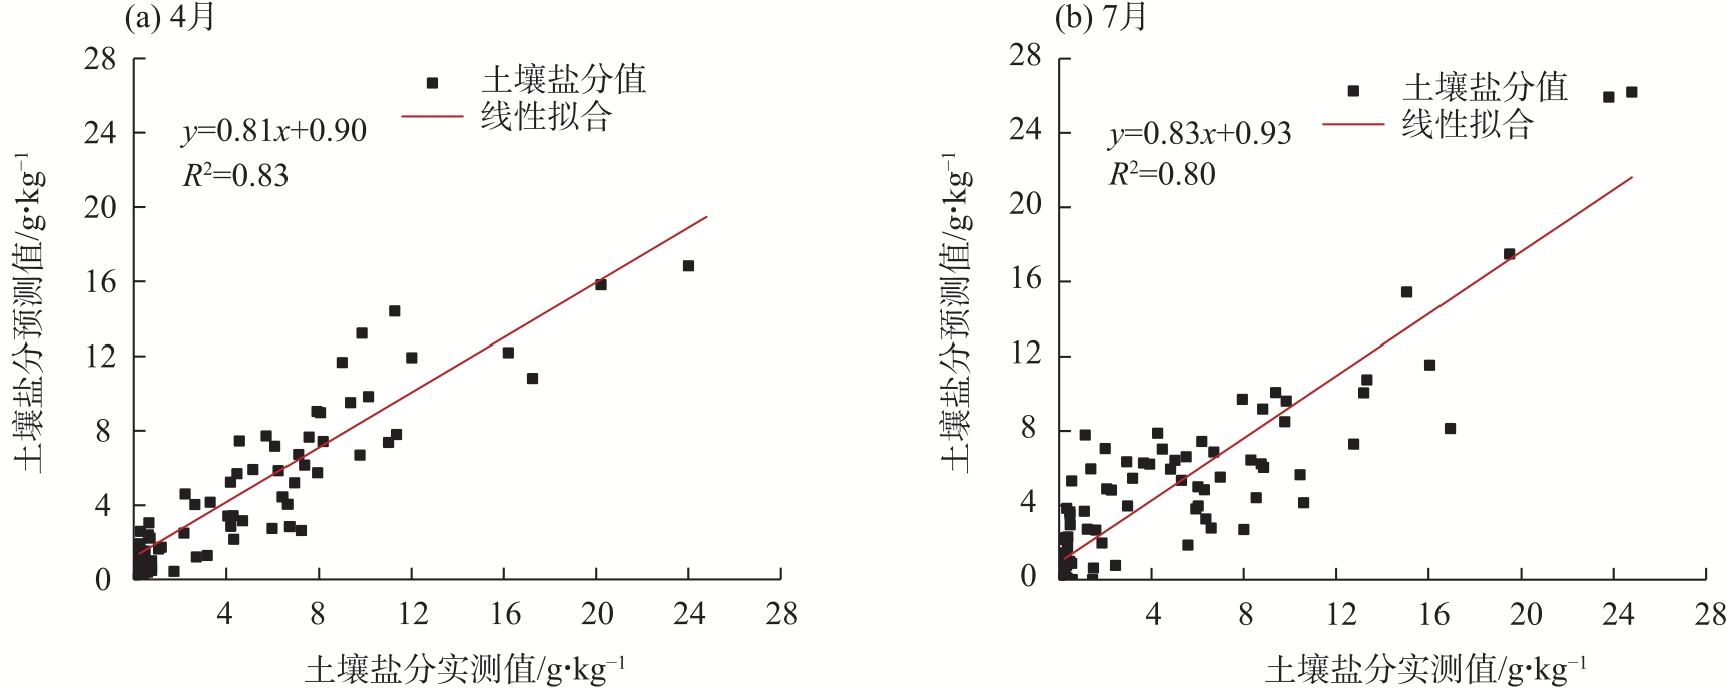

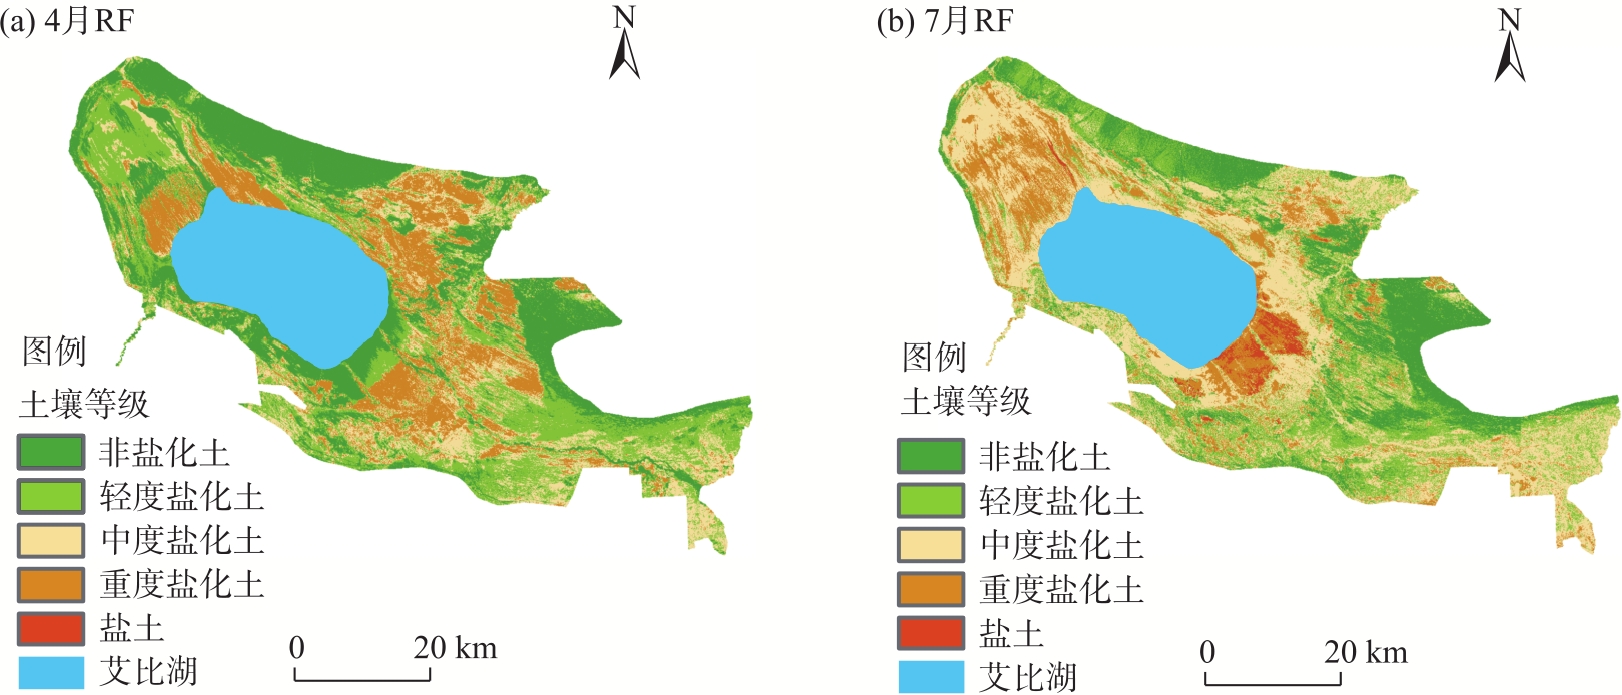
Fig. 9
Distributions of soil salinity"
| [1] |
谢俊博, 王兴鹏, 何帅, 等. 基于光谱指数建模的沙井子灌区土壤盐分反演[J]. 干旱区地理, 2024, 47(7): 1199-1209.
doi: 10.12118/j.issn.1000-6060.2023.584 |
|
[Xie Junbo, Wang Xingpeng, He Shuai, et al. Soil salinity inversion in the Shajingzi irrigation district based on spectral index modeling[J]. Arid Land Geography, 2024, 47(7): 1199-1209.]
doi: 10.12118/j.issn.1000-6060.2023.584 |
|
| [2] | Jiang H N, Shu H. Optical remote-sensing data based research on detecting soil salinity at different depth in an arid-area oasis, Xinjiang, China[J]. Earth Sscience Informatics, 2019, 12: 43-56. |
| [3] | Liu J, Zhang L, Dong T, et al. The applicability of remote sensing models of soil salinization based on feature space[J]. Sustainability, 2021, 13(24): 13711, doi: 10.3390/su132413711. |
| [4] |
刘瑞亮, 贾科利, 李小雨, 等. 组合光学和微波遥感的耕地土壤含盐量反演[J]. 干旱区地理, 2024, 47(3): 433-444.
doi: 10.12118/j.issn.1000-6060.2023.375 |
|
[Liu Ruiliang, Jia Keli, Li Xiaoyu, et al. Inversion of soil salt content by combining optical and microwave remote sensing in cultivated land[J]. Arid Land Geography, 2024, 47(3): 433-444.]
doi: 10.12118/j.issn.1000-6060.2023.375 |
|
| [5] | Chen H, Wu J, Xu C. Monitoring soil salinity classes through remote sensing-based ensemble learning concept: Considering scale effects[J]. Remote Sensing, 2024, 16(4): 642, doi: 10.3390/rs-16040642. |
| [6] | Salcedo F P, Cutillas P P, Cabañero J J A, et al. Use of remote sensing to evaluate the effects of environmental factors on soil salinity in a semi-arid area[J]. Science of the Total Environment, 2022, 815: 152524, doi: 10.1016/j.scitotenv.2021.152524. |
| [7] | 杨欢, 何学敏, 热依汗·阿布力孜, 等. 小叶碱蓬和白麻土壤-叶片生态化学计量学特征对不同盐生境的响应[J]. 水土保持通报, 2023, 43(5): 45-52. |
| [Yang Huan, He Xuemin, Abliz Zeyhan, et al. Characteristics and response of soil-leaf ecological stoichiometry of Suaeda microphylla and Apocynum pictum under different salt habitats[J]. Bulletin of Soil and Water Conservation, 2023, 43(5): 45-52.] | |
| [8] |
吕宁, 国语, 彭琴, 等. 新疆耕地利用碳源/汇效应时空演变特征及其贡献因子[J]. 干旱区研究, 2025, 42(1): 179-190.
doi: 10.13866/j.azr.2025.01.16 |
|
[Lü Ning, Guo Yu, Peng Qin, et al. Spatiotemporal evolution characteristics and contributing factors of the carbon effect in cultivated land use in Xinjiang[J]. Arid Zone Research, 2025, 42(1): 179-190.]
doi: 10.13866/j.azr.2025.01.16 |
|
| [9] | 曹家睿, 陈蜀江, 范贺娟, 等. 艾比湖湖滨隐域性植被与地带性植被交错带土壤盐分对水域面积变化的响应[J]. 西南农业学报, 2021, 34(4): 862-871. |
| [Cao Jiarui, Chen Shujiang, Fan Hejuan, et al. Response of soil salinity to change of water area in crisscross between foreshore vegetation and zonal vegetation in Aibi Lake[J]. Southwest China Journal of Agricultural Sciences, 2021, 34(4): 862-871.] | |
| [10] | Avdan U, Kaplan G, Kucuk M K, et al. Soil salinity prediction models constructed by different remote sensors[J]. Physics and Chemistry of the Earth, 2022, 128: 103230, doi: 10.1016/j.pce.2022.103230. |
| [11] | Chen H, Ma Y, Zhu A, et al. Soil salinity inversion based on differentiated fusion of satellite image and ground spectra[J]. International Journal of Applied Earth Observation and Geoinformation, 2021, 101: 102360, doi: 10.1016/j.jag.2021.102360. |
| [12] | 任建强, 张宁丹, 刘杏认, 等. 基于哨兵-2A模拟反射率及其影像的冬小麦收获指数估算[J]. 农业机械学报, 2022, 53(12): 231-243. |
| [Ren Jianqiang, Zhang Ningdan, Liu Xingren, et al. Estimation of harvest index of winter wheat based on simulated sentinel-2A reflectance data and its real remote sensing imagery[J]. Transactions of the Chinese Society for Agricultural Machinery, 2022, 53(12): 231-243.] | |
| [13] |
An D, Zhao G, Chang C, et al. Hyperspectral field estimation and remote-sensing inversion of salt content in coastal saline soils of the Yellow River Delta[J]. International Journal of Remote Sensing, 2016, 37(2): 455-470.
doi: 10.1080/01431161.2015.1129562 |
| [14] | Haq Y, Shahbaz M, Asif H M S, et al. Spatial mapping of soil salinity using machine learning and remote sensing in Kot Addu, Pakistan[J]. Sustainability, 2023, 15(17): 12943, doi: 10.3390/su15-1712943. |
| [15] |
赵欣悦, 席海洋, 赵静, 等. 阿拉善地区土壤盐渍化的遥感反演及分布特征[J]. 中国沙漠, 2023, 43(1): 27-36.
doi: 10.7522/j.issn.1000-694X.2022.00070 |
|
[Zhao Xinyue, Xi Haiyang, Zhao Jing, et al. Inversion and spatial distribution characteristics of soil salinity in Alxa area, China[J]. Journal of Desert Research, 2023, 43(1): 27-36.]
doi: 10.7522/j.issn.1000-694X.2022.00070 |
|
| [16] | 赵文举, 马芳芳, 马宏, 等. 基于无人机多光谱影像的土壤盐分反演模型[J]. 农业工程学报, 2022, 38(24): 93-101. |
| [Zhao Wenju, Ma Fangfang, Ma Hong, et al. Soil salinity inversion model based on the multispectral images of UAV[J]. Transactions of the Chinese Society of Agricultural Engineering, 2022, 38(24): 93-101.] | |
| [17] |
Wang J Z, Ding J L, Yu D L, et al. Capability of Sentinel-2 MSI data for monitoring and mapping of soil salinity in dry and wet seasons in the Ebinur Lake region, Xinjiang, China[J]. Geoderma, 2019, 353(5): 172-187.
doi: 10.1016/j.geoderma.2019.06.040 |
| [18] | 马驰, 刘晓波. 基于Sentinel-1/2的土壤盐分含量反演研究[J]. 干旱地区农业研究, 2022, 40(5): 252-259. |
| [Ma Chi, Liu Xiaobo. Inversion of soil salt content based on Sentinel-1/2[J]. Agricultural Research in the Arid Areas, 2022, 40(5): 252-259.] | |
| [19] | 姚一飞, 王爽, 张珺锐, 等. 基于GF-1卫星遥感的河套灌区土壤含水率反演模型研究[J]. 农业机械学报, 2022, 53(9): 239-251. |
| [Yao Yifei, Wang Shuang, Zhang Junrui, et al. Inversion model of soil moisture in Hetao irrigation district based on GF-1 satellite remote sensing[J]. Transactions of the Chinese Society for Agricultural Machinery, 2022, 53(9): 239-251.] | |
| [20] | 王飞, 丁建丽, 魏阳, 等. 基于Landsat系列数据的盐分指数和植被指数对土壤盐度变异性的响应分析——以新疆天山南北典型绿洲为例[J]. 生态学报, 2017, 37(15): 5007-5022. |
| [Wang Fei, Ding Jianli, Wei Yang, et al. Sensitivity analysis of soil salinity and vegetation indices to detect soil salinity variation by using Landsat series images: Applications in different oases in Xinjiang, China[J]. Acta Ecologica Sinica, 2017, 37(15): 5007-5022.] | |
| [21] | Hussain S, Raza A, Abdo H G, et al. Relation of land surface temperature with different vegetation indices using multi-temporal remote sensing data in Sahiwal region, Pakistan[J]. Geoscience Letters, 2023, 10(1): 33, doi: 10.1186/s40562-023-00287-6. |
| [22] | 陈怡欣, 莫登奎, 严恩萍. 基于Sentinel-2的复杂山区常用植被指数地形效应分析[J]. 生态学杂志, 2023, 42(4): 956-965. |
|
[Chen Yixin, Mo Dengkui, Yan Enping. Analysis on topographic effects of commonly used vegetation indices in complex mountain area based on Sentinel-2 data[J]. Chinese Journal of Ecology, 2023, 42(4): 956-965.]
doi: DOI: 10.13292/j.1000-4890.202304.014 |
|
| [23] | 马明东, 江洪, 刘世荣, 等. 森林生态系统立地指数的遥感分析[J]. 生态学报, 2006, 26(9): 2810-2816. |
|
[Ma Mingdong, Jiang Hong, Liu Shirong, et al. The preliminary analysis of forest ecosystem site index using remote sensed data[J]. Acta Ecologica Sinica, 2006, 26(9): 2810-2816.]
doi: 10.1016/S1872-2032(06)60045-0 |
|
| [24] |
陈悦, 赵庚星, 常春艳, 等. 基于Sentinel-2多光谱影像的小麦-玉米轮作耕地粮食产量估测——以曹县为例[J]. 应用生态学报, 2023, 34(12): 3347-3356.
doi: 10.13287/j.1001-9332.202312.014 |
|
[Chen Yue, Zhao Gengxing, Chang Chunyan, et al. Grain yield estimation of wheat-maize rotation cultivated land based on Sentinel-2 multi-spectral image: A case study in Caoxian County, Shandong, China[J]. Chinese Journal of Applied Ecology, 2023, 34(12): 3347-3356.]
doi: 10.13287/j.1001-9332.202312.014 |
|
| [25] | 曹雷, 丁建丽, 玉米提·哈力克, 等. 基于国产高分一号卫星数据的区域土壤盐渍化信息提取与建模[J]. 土壤学报, 2016, 53(6): 1399-1409. |
| [Cao Lei, Ding Jianli, Halik Umut, et al. Extraction and modeling of regional soil salinization based on data from GF-1 satellite[J]. Acta Pedologica Sinica, 2016, 53(6): 1399-1409.] | |
| [26] |
刘旭辉, 白云岗, 柴仲平, 等. 基于多光谱遥感的典型绿洲棉田春季土壤盐分反演及验证[J]. 干旱区地理, 2022, 45(4): 1165-1175.
doi: 10.12118/j.issn.1000-6060.2021.477 |
|
[Liu Xuhui, Bai Yungang, Chai Zhongping, et al. Inversion and validation of soil salinity based on multispectral remote sensing in typical oasis cotton field in spring[J]. Arid Land Geography, 2022, 45(4): 1165-1175.]
doi: 10.12118/j.issn.1000-6060.2021.477 |
|
| [27] | 梁静, 丁建丽, 王敬哲, 等. 基于反射光谱与Landsat 8 OLI多光谱数据的艾比湖湿地土壤盐分估算[J]. 土壤学报, 2019, 56(2): 320-330. |
| [Liang Jing, Ding Jianli, Wang Jingzhe, et al. Estimation of soil salinity in Ebinur Lake wetland based on reflectance spectroscopy and Landsat 8 OLI multispectral data[J]. Acta Pedologica Sinica, 2019, 56(2): 320-330.] | |
| [28] | 赵明松, 谢毅, 陆龙妹, 等. 基于高光谱特征指数的土壤有机质含量建模[J]. 土壤学报, 2021, 58(1): 42-54. |
| [Zhao Mingsong, Xie Yi, Lu Longmei, et al. Modeling for soil organic matter content based on hyperspectral feature indices[J]. Acta Pedologica Sinica, 2021, 58(1): 42-54.] | |
| [29] |
Breiman L. Random forests[J]. Machine Learning, 2001, 45: 5-32.
doi: 10.1023/A:1010933404324 |
| [30] | 陈海洋, 孟令奎, 周元. 基于随机森林的遥感影像雪冰云信息检测方法[J]. 测绘地理信息, 2022, 47(2): 105-110. |
| [Chen Haiyang, Meng Lingkui, Zhou Yuan. Ice snow and cloud detection in remote sensing images based on random forest[J]. Journal of Geomatics, 2022, 47(2): 105-110.] | |
| [31] | Gao Z T, Pena-arancibia J L, Siyal A A. Three-dimensional soil salinity mapping with uncertainty using Bayesian hierarchical modelling, random forest regression and remote sensing data[J]. Agricultural Water Management, 2025, 309(4): 109318, doi: 10.1016/j.agwat.2025.109318. |
| [32] |
Cortes C, Vapnik V. Support-vector networks[J]. Machine Learning, 1995, 20: 273-297.
doi: 10.1023/A:1022627411411 |
| [33] | Pedregosa F, Varoquaux G, Gramfort A, et al. Scikit-learn: Machine learning in Python[J]. The Journal of Machine Learning Research, 2011, 12: 2825-2830. |
| [34] | Hunt E B, Marin J, Stone P J. Experiments in induction[J]. The American Journal of Psychology, 1966, 80(4): 1421207, doi: 10.2307/1421207. |
| [35] | 罗虹, 徐京华, 蔡国林. 决策树算法在西藏遥感影像分类中的应用研究[J]. 测绘, 2011, 34(1): 3-6. |
| [Luo Hong, Xu Jinghua, Cai Guolin. The application research of decision tree algorithm in Tibet remote sensing image classification[J]. Surveying and Mapping, 2011, 34(1): 3-6.] | |
| [36] |
Freund Y, Schapire R E. A desicion-theoretic generalization of on-line learning and an application to boosting[J]. Journal of Computer and System Sciences, 1997, 55: 119-139.
doi: 10.1006/jcss.1997.1504 |
| [37] | 曹莹, 苗启广, 刘家辰, 等. AdaBoost算法研究进展与展望[J]. 自动化学报, 2013, 39(6): 745-758. |
| [Cao Ying, Miao Qiguang, Liu Jiachen, et al. Advance and prospects of AdaBoost algorithm[J]. Acta Automatica Sinica, 2013, 39(6): 745-758.] | |
| [38] |
Friedman J H. Greedy function approximation: A gradient boosting machine[J]. Annals of Statistics, 2001, 29(5): 1189-1232.
doi: 10.1214/aos/1013203450 |
| [39] | 孟然, 沈蔚, 纪茜, 等. GBDT模型在遥感水深反演中的应用[J]. 环境生态学, 2021, 3(5): 1-5. |
| [Meng Ran, Shen Wei, Ji Qian, et al. The application of GBDT model in remote sensing water depth introverse[J]. Environmental Ecology, 2021, 3(5): 1-5.] | |
| [40] | 巴亚岚, 张智韬, 谢坪良, 等. 集成Sentinel-1/2和环境变量的新疆农田土壤含盐量反演[J]. 农业工程学报, 2024, 40(16): 171-179. |
| [Ba Yalan, Zhang Zhitao, Xie Pingliang, et al. Inverting soil salinity of farmland in Xinjiang by integrating Sentinel-1/2 and environmental variables[J]. Transactions of the Chinese Society of Agricultural Engineering, 2024, 40(16): 171-179.] | |
| [41] |
Hinton G E, Salakhutdinov R R. Reducing the dimensionality of data with neural networks[J]. Science, 2006, 313(5786): 504-507.
doi: 10.1126/science.1127647 pmid: 16873662 |
| [42] | Zaccone G, Karim M R. Deep learning with tensorflow: Explore neural networks and build intelligent systems with python[M]. Birmingham, UK: Packt Publishing, 2018: 484. |
| [43] |
Lecun Y, Bottou L. Gradient-based learning applied to document recognition[J]. Proceedings of the IEEE, 1998, 86(11): 2278-2324.
doi: 10.1109/5.726791 |
| [44] |
Long J, Shelhamer E, Darrell T. Fully convolutional networks for semantic segmentation[J]. IEEE Transactions on Pattern Analysis and Machine Intelligence, 2015, 39(4): 640-651.
doi: 10.1109/TPAMI.2016.2572683 |
| [45] | Abadi M, Barham P, Chen J, et al. Tensorflow: A system for large-scale machine learning[J]. Usenix Association, 2016: 265-283. |
| [46] | 宋柯馨, 蒋馥根, 胡宗达. 西藏自治区草地地上生物量遥感反演研究[J]. 生态学报, 2023, 43(13): 5600-5613. |
| [Song Kexin, Jiang Fugen, Hu Zongda. Remote sensing inversion of above-ground biomass of grassland in the Tibet autonomous region[J]. Acta Ecologica Sinica, 2023, 43(13): 5600-5613.] | |
| [47] | 李顿, 王雪梅, 李坤玉, 等. 基于变量筛选与机器学习算法的渭-库绿洲土壤有机质含量估测研究[J]. 地球与环境, 2024, 52(3): 375-385. |
| [Li Dun, Wang Xuemei, Li Kunyu, et al. Estimation of soil organic matter content in Wei-Ku Oasis based on variables screening and machine learning algorithms[J]. Earth and Environment, 2024, 52(3): 375-385.] | |
| [48] | 新疆维吾尔自治区农业厅, 新疆维吾尔自治区土壤普查办公室编著. 新疆土壤[M]. 北京: 科学出版社, 1996. |
| [Department of Agriculture of Xinjiang Uygur Autonomous Region, Soil Survey Office of Xinjiang Uygur Autonomous Region. Xinjiang soil[M]. Beijing: Science Press, 1996.] | |
| [49] | 刘旭辉, 白云岗, 柴仲平, 等. 典型绿洲灌区棉田土壤盐分多光谱遥感反演与季节差异性研究[J]. 农业资源与环境学报, 2023, 40(3): 598-609. |
| [Liu Xuhui, Bai Yungang, Chai Zhongping, et al. Multispectral remote sensing inversion and seasonal difference in soil salinity of cotton field in typical oasis irrigation area[J]. Journal of Agricultural Resources and Environment, 2023, 40(3): 598-609.] | |
| [50] | 白建铎, 彭杰, 白子金, 等. 干旱区棉田表层土壤盐渍化时空变异研究[J]. 土壤通报, 2021, 52(3): 527-534. |
| [Bai Jianduo, Peng Jie, Bai Zijin, et al. Clarifying spatial-temporal variability of surface soil salinization in arid cotton fields[J]. Soil Bulletin, 2021, 52(3): 527-534.] | |
| [51] |
丁建丽, 葛翔宇, 王敬哲. 中国艾比湖湿地识别及其时空动态变化[J]. 自然资源学报, 2021, 36(8): 1949-1963.
doi: 10.31497/zrzyxb.20210804 |
| [Ding Jianli, Ge Xiangyu, Wang Jingzhe. Ebinur Lake wetland identification and its spatio-temporal dynamic changes[J]. Journal of Natural Reso-urces, 2021, 36(8): 1949-1963.] | |
| [52] | 李顿, 王雪梅, 李坤玉, 等. 基于合成影像和多变量的博湖流域土壤有机碳含量估测[J]. 环境科学, 2025, 46(7): 4428-4440. |
| [Li Dun, Wang Xuemei, Li Kunyu, et al. Estimation of soil organic carbon content in the Bohu Basin based on synthetic images and multi-variables[J]. Environmental Science, 2025, 46(7): 4428-4440.] | |
| [53] | 李泽, 杜哲, 毕善婷, 等. 基于GWRF模型的滨海平原土壤含盐量预测及影响因素分析[J]. 环境科学, 2025, 46(8): 4982-4992. |
| [Li Ze, Du Zhe, Bi Shanting, et al. Prediction of soil salinity and analysis of influencing factors in coastal plains based on the geographically weighted random forests[J]. Environmental Science, 2025, 46(8): 4982-4992.] | |
| [54] | 马国林, 丁建丽, 韩礼敬, 等. 基于变量优选与机器学习的干旱区湿地土壤盐渍化数字制图[J]. 农业工程学报, 2020, 36(19): 124-131. |
| [Ma Guolin, Ding Jianli, Han Lijing, et al. Digital mapping of soil salinization in arid area wetland based on variable optimized selection and machine learning[J]. Transactions of the Chinese Society of Agricultural Engineering, 2020, 36(19): 124-131.] | |
| [55] | 杨丽萍, 任杰, 王宇, 等. 基于多源遥感数据的居延泽地区土壤盐分估算模型[J]. 农业机械学报, 2022, 53(11): 226-235. |
| [Yang Liping, Ren Jie, Wang Yu, et al. Soil salinity estimation model in Juyanze based on multi-source remote sensing data[J]. Transactions of the Chinese Society for Agricultural Machinery, 2022, 53(11): 226-235.] |
| [1] | GAO Ruixiang, LUO Geping, ZHANG Wenqiang, XIE Mingjuan, WANG Yuangang. Ecosystem carbon flux inversion method combining LSTM and fuzzy mathematics [J]. Arid Land Geography, 2025, 48(12): 2210-2219. |
| [2] | XIN Yue, SU Lijuan, ZHENG Xucheng, LI Hui, YI Nana, JIN Yuchen. Hail characteristics and hail recognition method based on machine learning in Inner Mongolia [J]. Arid Land Geography, 2025, 48(1): 11-19. |
| [3] | LYU Na, GUO Mengjing, ZHAO Xin, LIU Kele, HUANG Yujia. Remote sensing inversion of water quality and spatiotemporal evolution characteristics of the Bosten Inland Freshwater Lake [J]. Arid Land Geography, 2024, 47(6): 953-966. |
| [4] | LIU Ruiliang, JIA Keli, LI Xiaoyu, CHEN Ruihua, WANG Yijing, ZHANG Junhua. Inversion of soil salt content by combining optical and microwave remote sensing in cultivated land [J]. Arid Land Geography, 2024, 47(3): 433-444. |
| [5] | CUI Jintao, Mamat SAWUT. Estimation of leaf water content in upland cotton based on feature band selection and machine learning [J]. Arid Land Geography, 2023, 46(11): 1836-1847. |
| [6] | WEI Huimin, JIA Keli, ZHANG Xu, ZHANG Junhua. Prediction of soil salinity based on machine learning and multispectral remote sensing in Yinchuan Plain [J]. Arid Land Geography, 2023, 46(1): 103-114. |
| [7] | ZHAO Shuang,DING Jianli,HAN Lijing,HUANG Shuai,GE Xiangyu. Response analysis and modeling of microwave dielectric properties of typical saline soil in Xinjiang [J]. Arid Land Geography, 2022, 45(5): 1534-1546. |
| [8] | LIU Xuhui,BAI Yungang,CHAI Zhongping,ZHANG Jianghui,DING Bangxin,JIANG Zhu. Inversion and validation of soil salinity based on multispectral remote sensing in typical oasis cotton field in spring [J]. Arid Land Geography, 2022, 45(4): 1165-1175. |
| [9] | YIN Hanmin,Guli JIAPAER,YU Tao,Jeanine UMUHOZA,LI Xu. Wheat yield estimation with remote sensing in northern Kazakhstan [J]. Arid Land Geography, 2022, 45(2): 488-498. |
| [10] | YUAN Panli,WANG Chuanjian,ZHAO Qingzhan,WANG Xuewen,REN Yuanyuan,YANG Qiyuan. Dynamic monitoring of land-use/land-cover change in cold and arid region based on deep learning: A case study of Mosuowan reclamation area in Xinjiang [J]. Arid Land Geography, 2021, 44(6): 1717-1728. |
| [11] | HU Guigui,YANG Fenli,YANG Lian’an,ZHENG Yurong,WANG Hui,CHEN Weijun,LI Yali. Spatial prediction modeling of soil organic matter content based on principal components and machine learning [J]. Arid Land Geography, 2021, 44(4): 1114-1124. |
| [12] | LI Hui-rong. Estimation of snow depth based on reflectance and bright temperature in Xilin Gol League [J]. Arid Land Geography, 2020, 43(6): 1567-1572. |
| [13] | XIA Zi-shu, BAI Yi-ru, BAO Wei-bin, ZHONG Yan-xia, WANG You-qi. Spatial distribution of soil organic carbon in Shizuishan based on multispectral and geographically weighted regression model [J]. Arid Land Geography, 2020, 43(5): 1348-1357. |
| [14] |
LU Wen-lu, LIU Zhi-feng, HE Chun-yang, XIA Pei.
A new method for detecting urban construction land based on Sentinel-1A synthetic aperture radar data and fully convolutional network [J]. Arid Land Geography, 2020, 43(3): 750-760. |
| [15] |
LIU Fei, CHEN Pei-yuan, YU Hai-chao, MA Jin-zhu .
Spatial distribution characteristics of soil water and salt under different land use types in Minqin Oasis [J]. Arid Land Geography, 2020, 43(2): 406-414. |
|
||