- 2025年5月15日 星期四
干旱区地理 ›› 2021, Vol. 44 ›› Issue (5): 1199-1212.doi: 10.12118/j.issn.1000–6060.2021.05.01
• 气候与水文 • 下一篇
温煜华1( ),吕越敏2,李宗省2()
收稿日期:2021-01-05
修回日期:2021-08-23
出版日期:2021-09-25
发布日期:2021-09-22
通讯作者:
李宗省
作者简介:温煜华(1981-),女,副教授,博士,主要从事生态经济学与气候变化研究. E-mail: 基金资助:
WEN Yuhua1(),LYU Yuemin2,LI Zongxing2()
Received:2021-01-05
Revised:2021-08-23
Online:2021-09-25
Published:2021-09-22
Contact:
Zongxing LI
摘要:
利用祁连山24个气象台站1961-2017年逐日降水资料,选用12个极端降水指数,采用线性趋势法、Pearson相关性分析法等,分析了祁连山极端降水指数的时空变化特征,并分析了海拔、大气环流指数对祁连山极端降水指数时空变化的影响机制。结果表明:(1) 祁连山、河西内陆河流域、柴达木内陆河流域、黄河流域(外流)连续干旱日数(CDD)呈显著减少趋势,连续湿润日数(CWD)呈增加趋势,空间分布表现出东西差异;其他极端降水指数总体呈增加趋势,空间分布呈现出祁连山中部增加幅度较大,向外围呈环状递减的趋势。(2) 降水总量增加的主要原因在于雨日天数显著增加,中雨日数的天数也显著增大,这种降水分配模式将增大极端降水事件发生的概率,进一步证实祁连山降水活动增强,极端降水频度更高,持续时间更短,降水向降雨日数更多、时间更集中的方向发展。极端降水空间分异表现在极端降水强度的降低幅度随海拔的升高而减少,高海拔区降水量和降水日数增加更为明显,CDD的减少主要发生在高海拔区。(3) 在所选的11个大气环流异常因子中,祁连山极端降水受北大西洋年代际振荡(AMO)指数影响最大,北极涛动(AO)指数与祁连山极端降水的关系最为复杂,大西洋海平面表面温度指数越大、南海夏季风(SCSSMI)指数、南美夏季风(SAMSMI)指数越低则流域发生多雨、洪涝现象的概率越大,反之发生少雨现象的概率越大。
温煜华,吕越敏,李宗省. 近60a祁连山极端降水变化研究[J]. 干旱区地理, 2021, 44(5): 1199-1212.
WEN Yuhua,LYU Yuemin,LI Zongxing. Changes of extreme precipitation in Qilian Mountains in recent 60 years[J]. Arid Land Geography, 2021, 44(5): 1199-1212.
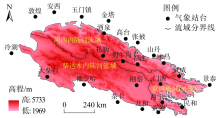
图1
祁连山区域图及气象台站位置分布"

表1
祁连山气象台站分布位置"
| 流域 | 台站编号 | 台站名称 | 纬度/N | 经度/E | 海拔/m |
|---|---|---|---|---|---|
| 河西内陆河 流域 | 52418 | 敦煌 | 40°05′ | 94°24′ | 1139.0 |
| 52424 | 安西 | 40°19′ | 95°27′ | 1170.9 | |
| 52436 | 玉门镇 | 40°09′ | 97°01′ | 1526.0 | |
| 52447 | 金塔 | 40°00′ | 98°32′ | 1270.5 | |
| 52533 | 酒泉 | 39°27′ | 98°17′ | 1477.2 | |
| 52546 | 高台 | 39°13′ | 99°30′ | 1332.2 | |
| 52652 | 张掖 | 39°03′ | 100°10′ | 1461.1 | |
| 52661 | 山丹 | 38°28′ | 101°03′ | 1764.6 | |
| 52674 | 永昌 | 38°08′ | 101°34′ | 1976.9 | |
| 52679 | 武威 | 37°33′ | 102°24′ | 1531.5 | |
| 52797 | 景泰 | 37°06′ | 104°01′ | 1630.9 | |
| 52657 | 祁连 | 38°06′ | 100°09′ | 2787.4 | |
| 52633 | 托勒 | 38°28′ | 98°15′ | 3367.0 | |
| 柴达木内陆河流域 | 52602 | 冷湖 | 38°27′ | 93°12′ | 2770.0 |
| 52737 | 德令哈 | 37°13′ | 97°13′ | 2981.5 | |
| 52856 | 共和 | 36°09′ | 100°22′ | 2835.0 | |
| 52868 | 贵德 | 36°00′ | 101°13′ | 2237.1 | |
| 52713 | 大柴旦 | 37°30′ | 95°13′ | 3173.2 | |
| 52754 | 刚察 | 37°12′ | 100°04′ | 3301.5 | |
| 52842 | 茶卡 | 36°28′ | 99°03′ | 3087.6 | |
| 黄河流域 (外流) | 52876 | 民和 | 36°12′ | 102°30′ | 1813.9 |
| 52765 | 门源 | 37°13′ | 101°22′ | 2850.0 | |
| 52866 | 西宁 | 36°26′ | 101°27′ | 2295.2 | |
| 52645 | 野牛沟 | 38°15′ | 99°21′ | 3320.0 |
表2
极端降水指数"
| 指数代码 | 名称 | 定义 | 单位 |
|---|---|---|---|
| PRCPTOT | 雨日降水总量 | 日降水量大于1 mm的总降水量 | mm |
| SDII | 雨日降水强度 | 日降水量大于1 mm雨日的平均雨量 | mm·d-1 |
| RX1DAY | 单日最大降水量 | 年内单日最大降水量 | mm |
| RX5DAY | 五日最大降水量 | 年内连续五日最大降水量 | mm |
| R95 | 极端降水量 | 日降水量大于第95个百分位的雨日降水总量 | mm |
| R99 | 非常极端降水量 | 日降水量大于第99个百分位的雨日降水总量 | mm |
| CDD | 连续干旱日数 | 日降水量小于1 mm的连续日数 | d |
| CWD | 连续湿润日数 | 日降水量大于1 mm的连续日数 | d |
| R10MM | 日降水大于10 mm日数 | 日降水量大于10 mm的日数 | d |
| R20MM | 日降水大于20 mm日数 | 日降水量大于20 mm的日数 | d |
| R25MM | 日降水大于25 mm日数 | 日降水量大于25 mm的日数 | d |
| \ | 雨日日数 | 日降水量大于1 mm的日数 | d |
表3
祁连山及其流域极端降水指数年际变化趋势"
| 区域 | PRCPTOT | SDII | RX1DAY | RX5DAY | R95 | R99 | ||||||
|---|---|---|---|---|---|---|---|---|---|---|---|---|
| 变化速率 /mm·(10a)-1 | 变化幅度/% | 变化速率 /mm·(d·10a)-1 | 变化幅度/% | 变化速率 /mm·(10a)-1 | 变化幅度/% | 变化速率 /mm·(10a)-1 | 变化幅度/% | 变化速率 /mm·(10a)-1 | 变化幅度/% | 变化速率 /mm·(10a)-1 | 变化幅度/% | |
| 祁连山 | 13.86* | 41.8 | -0.01 | 3.8 | 0.76* | 27.2 | 1.37* | 31.9 | 4.10* | 72.8 | 1.29* | 66.1 |
| 河西内陆河流域 | 10.51* | 47.8 | -0.02 | 3.8 | 0.81* | 31.1 | 1.11* | 33.0 | 3.60* | 92.6 | 1.10* | 78.2 |
| 柴达木内陆河流域 | 14.05* | 43.3 | 0.01 | 8.3 | 0.75* | 33.5 | 1.97* | 44.0 | 4.48* | 97.7 | 1.60* | 153.5 |
| 黄河流域(外流) | 24.40* | 33.6 | -0.03 | -2.4 | 0.63 | 12.5 | 1.17 | 17.4 | 5.06* | 34.4 | 1.39 | 6.5 |
| 区域 | CDD | CWD | R10MM | R20MM | R25MM | 雨日日数 | ||||||
| 变化速率 /d·(10a)-1 | 变化幅度/% | 变化速率 /d·(10a)-1 | 变化幅度/% | 变化速率 /d·(10a)-1 | 变化幅度/% | 变化速率 /d·(10a)-1 | 变化幅度/% | 变化速率 /d·(10a)-1 | 变化幅度/% | 变化速率 /d·(10a)-1 | 变化幅度/% | |
| 祁连山 | -26.35* | -49.0 | 0.06 | 12.6 | 0.40* | 47.0 | 0.09* | 62.9 | 0.05* | 64.6 | 5.79* | 43.5 |
| 河西内陆河流域 | -26.74* | -50.2 | 0.05 | 15.7 | 0.28* | 57.4 | 0.07* | 93.2 | 0.04* | 87.5 | 4.00* | 47.6 |
| 柴达木内陆河流域 | -24.42* | -42.0 | 0.10 | 14.6 | 0.43* | 48.4 | 0.11* | 89.2 | 0.05* | 125.0 | 4.20* | 37.4 |
| 黄河流域(外流) | -28.43* | -59.0 | 0.01 | 5.3 | 0.75* | 35.8 | 0.12 | 26.0 | 0.06 | 18.6 | 7.93* | 42.2 |
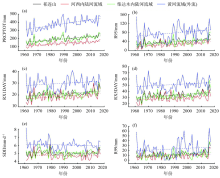
图2
1961—2017年祁连山及其流域极端降水量指数年际变化 注:实线为年际变化,虚线为多年趋势。PRCPTOT为雨日降水总量,R95为极端降水量,RX1DAY为单日最大降水量,RX5DAY为五日最大降水量,SDII为雨日降水强度,R99为非常极端降水量。"

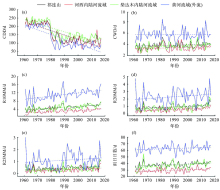
图3
1961—2017年祁连山及其流域极端降水日数指数年际变化 注:实线为年际变化,虚线为多年趋势。CDD为连续干旱日数,CWD为连续湿润日数,R10MM为日降水大于10 mm日数,R20MM为日降水大于20 mm日数,R25MM为日降水大于25 mm日数。 "

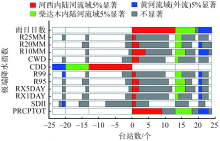
图4
极端降水指数显示正趋势和负趋势的气象台站数"


图5
1961—2017年祁连山及其流域极端降水量指数变化幅度的空间分布"
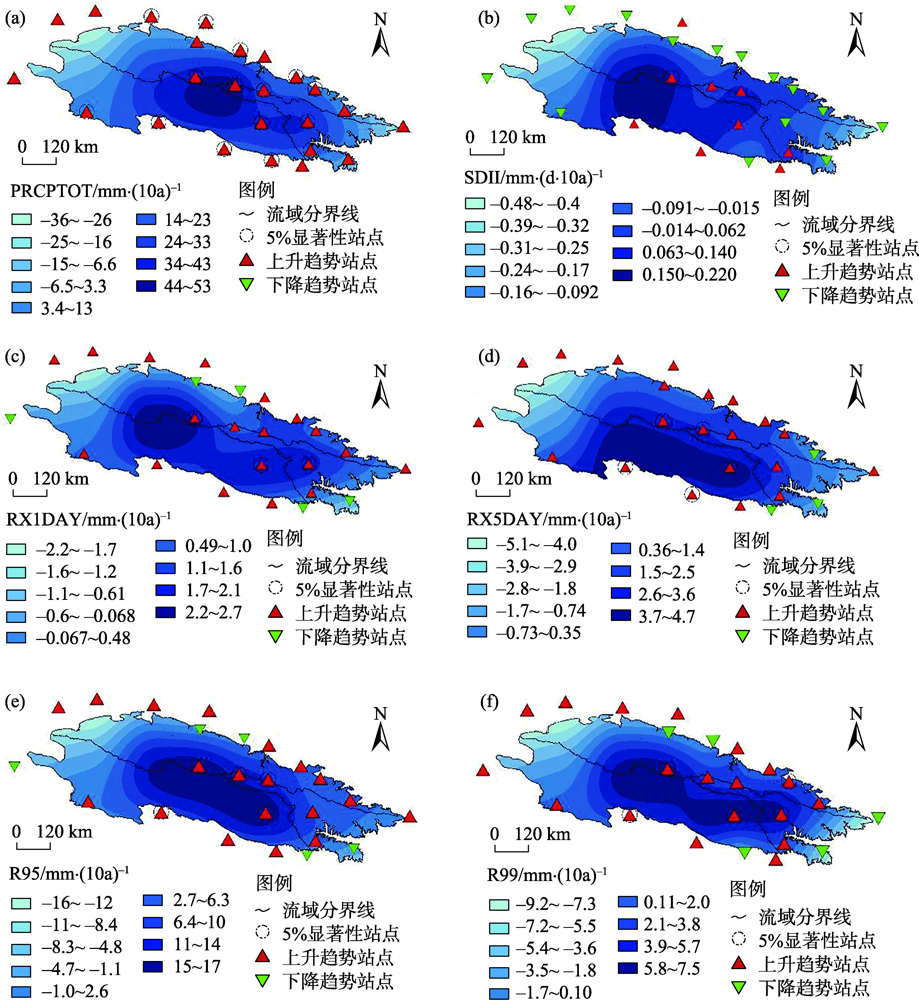
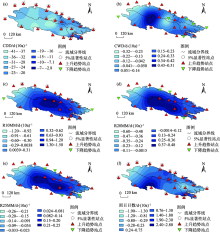
图6
1961—2017年祁连山及其流域极端降水日数指数变化幅度的空间分布"

表4
1961—2017年祁连山及其流域极端降水指数变化幅度与海拔的相关系数"
| 区域 | PRCPTOT | SDII | RX1DAY | RX5DAY | R95 | R99 |
|---|---|---|---|---|---|---|
| 祁连山 | 0.74* | 0.48* | 0.43* | 0.60* | 0.68* | 0.55* |
| 河西内陆河流域 | 0.98* | 0.68* | 0.65* | 0.69* | 0.96* | 0.83* |
| 柴达木内陆河流域 | 0.65 | 0.20 | 0.80* | 0.66 | 0.73 | 0.60 |
| 黄河流域(外流) | 0.99* | 0.71 | 0.76 | 0.93 | 0.98* | 0.81 |
| 区域 | CDD | CWD | R10MM | R20MM | R25MM | 雨日日数 |
| 祁连山 | -0.24 | 0.24 | 0.73* | 0.64* | 0.56* | 0.66* |
| 河西内陆河流域 | -0.19 | 0.50 | 0.95* | 0.91* | 0.86* | 0.95* |
| 柴达木内陆河流域 | -0.77* | 0.57 | 0.53 | 0.63 | 0.54 | 0.82* |
| 黄河流域(外流) | -0.99* | -0.75 | 0.96* | 0.93 | 0.86 | 0.99* |
表5
1961—2017年祁连山不同海拔区域的极端降水指数的平均变化趋势"
| 海拔/m | PRCPTOT /mm | SDII /mm·d-1 | RX1DAY /mm | RX5DAY /mm | R95 /mm | R99 /mm |
|---|---|---|---|---|---|---|
| 1000~1500 | 4.29* | -0.04 | 0.40 | 0.82 | 0.63 | -0.03 |
| 1500~2000 | 7.47* | -0.07 | 0.70 | 0.56 | 2.36 | -0.16 |
| 2000~2500 | 11.56* | 0.02 | 0.11 | 0.60 | 1.42 | 0.71 |
| 2500~3000 | 19.36* | 0.01 | 0.93* | 2.04* | 5.17* | 2.29* |
| 3000~3500 | 28.41* | 0.05 | 1.34* | 2.64* | 10.35* | 3.86* |
| 海拔/m | CDD /d | CWD /d | R10MM /d | R20MM /d | R25MM /d | 雨日日数 /d |
| 1000~1500 | -26.94* | 0.05 | 0.12 | 0.00 | 0.01 | 2.77* |
| 1500~2000 | -24.83* | 0.00 | 0.13 | 0.05 | 0.02 | 3.78* |
| 2000~2500 | -15.98* | 0.06 | 0.46 | 0.04 | 0.05 | 3.59* |
| 2500~3000 | -27.04* | 0.11 | 0.61* | 0.12* | 0.06 | 5.34* |
| 3000~3500 | -30.89* | 0.08 | 0.84* | 0.25* | 0.12* | 7.99* |
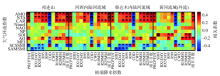
图7
极端降水指数与大气环流指数相关系数 注:*表示通过95%的置信度显著性检验。AMO为北大西洋年代际振荡,NTA为北热带大西洋海表温度指数,CAR为加勒比地区海温指数,Nino4为中热带太平洋海温,NAO为北大西洋涛动,NP为北太平洋模式,SOI为南方涛动指数,AO为北极涛动,MEI为混合ENSO指数,SCSSMI为南海夏季风、SAMSMI为南美夏季风。"

| [1] | IPCC. Summary for policymakers[C]// Stocker T F, Qin D, Plattner G K, et al. Climate Change 2013: The Physical Science Basis. Contribution of Working Group I to the Fifth Assessment Report of the Intergovernmental Panel on Climate Change. Cambridge: Cambridge University Press, 2013. |
| [2] | Changnon S A, Pielke R A, Changnon D, et al. Human factors explain the increased losses from weather and climate extremes[J]. Bulletin of the American Meteorological Society, 2000(81):437-442. |
| [3] |
Omondi P A, Awange J L, Forootan E, et al. Changes in temperature and precipitation extremes over the Greater Horn of Africa region from 1961 to 2010[J]. International Journal of Climatology, 2014, 34(4):1262-1277.
doi: 10.1002/joc.3763 |
| [4] | 陈洪滨, 范学花. 2011年极端天气和气候事件及其他相关事件的概要回顾[J]. 气候与环境研究, 2012, 17(3):365-380. |
| [ Chen Hongbin, Fan Xuehua. Some extreme events of weather, climate, and related phenomena in 2011[J]. Climatic and Environmental Research, 2012, 17(3):365-380. ] | |
| [5] | 陈海山, 范苏丹, 张新华. 中国近50 a极端降水事件变化特征的季节性差异[J]. 大气科学学报, 2009, 32(6):744-751. |
| [ Chen Haishan, Fan Sudan, Zhang Xinhua. Seasons differences of variation characteristics of extreme precipitation events over China in the last 50 years[J]. Transactions of Atmospheric Sciences, 2009, 32(6):744-751. ] | |
| [6] | 杨金虎, 江志红, 王鹏祥, 等. 中国年极端降水事件的时空分布特征[J]. 气候与环境研究, 2008, 13(1):75-83. |
| [ Yang Jinhu, Jiang Zhihong, Wang Pengxiang, et al. Temporal and spatial characteristic of extreme precipitation event in China[J]. Climatic and Environmental Research, 2008, 13(1):75-83. ] | |
| [7] |
Choi G, Collins D, Ren G, et al. Changes in means and extreme events of temperature and precipitation in the Asia-Pacific network region, 1955-2007[J]. International Journal of Climatology, 2009, 29(13):1906-1925.
doi: 10.1002/joc.1979 |
| [8] |
Caesar J, Alexander L V, Trewin B, et al. Changes in temperature and precipitation extremes over the Indo-Pacific region from 1971 to 2005[J]. International Journal of Climatology, 2011, 31(6):791-801.
doi: 10.1002/joc.2118 |
| [9] | Kunkel K E, Easterling D R, Redmond K, et al. Temporal variations of extreme precipitation events in the United States: 1895-2000[J]. Geophysical Research Letters, 2003, 30(17):1895-2000. |
| [10] | Aguilar E, Barry A A, Brunet M, et al. Changes in temperature and precipitation extremes in western central Africa, Guinea Conakry, and Zimbabwe, 1955-2006[J]. Journal of Geophysical Research Atmospheres, 2009, 114(D2):356-360. |
| [11] |
You Q L, Kang S C, Aguila E, et al. Changes in daily climate extremes in China and their connection to the large scale atmospheric circulation during 1961-2003[J]. Climate Dynamics, 2011, 36:2399-2417.
doi: 10.1007/s00382-009-0735-0 |
| [12] |
Zhai P M, Zhang X B, Wan H, et al. Trends in total precipitation and frequency of daily precipitation extremes over China[J]. Journal of Climate, 2005, 18(7):1096-1108.
doi: 10.1175/JCLI-3318.1 |
| [13] |
任正果, 张明军, 王圣杰, 等. 1961-2011年中国南方地区极端降水事件变化[J]. 地理学报, 2014, 69(5):640-649.
doi: 10.11821/dlxb201405007 |
|
[ Ren Zhengguo, Zhang Mingjun, Wang Shengjie, et al. Changes in precipitation extremes in south China during 1961-2011[J]. Acta Geographica Sinica, 2014, 69(5):640-649. ]
doi: 10.11821/dlxb201405007 |
|
| [14] | 蔡敏, 丁裕国, 江志红. 我国东部极端降水时空分布及其概率特征[J]. 高原气象, 2007, 26(2):309-318. |
| [ Cai Min, Ding Yuguo, Jiang Zhihong. Extreme precipitation experimentation over eastern China based on L-moment estimation[J]. Plateau Meteorology, 2007, 26(2):309-318. ] | |
| [15] | 丁之勇, 葛拥晓, 吉力力·阿不都外力, 等. 1957-2012年新疆艾比湖流域极端气温与降水变化趋势[J]. 中国科学院大学学报, 2018, 35(2):160-171. |
| [ Ding Zhiyong, Ge Yongxiao, Abuduwaili Jilili, et al. Trends of extreme temperature and precipitation in Ebinur Lake Basin in Xinjiang during the period from 1957 to 2012[J]. Journal of University of Chinese Academy of Sciences, 2018, 35(2):160-171. ] | |
| [16] | 高妍, 冯起, 李宗省, 等. 祁连山讨赖河流域1957-2012年极端气候变化[J]. 中国沙漠, 2014, 34(3):814-826. |
| [ Gao Yan, Feng Qi, Li Zongxing, et al. The variation of climate extremes in the Taolaihe River Basin in the Qilian Mountains of China during 1957-2012[J]. Journal of Desert Research, 2014, 34(3):814-826. ] | |
| [17] | 刘江涛, 徐宗学, 赵焕, 等. 1973-2016年雅鲁藏布江流域极端降水事件时空变化特征[J]. 山地学报, 2018, 36(5):750-764. |
| [ Liu Jiangtao, Xu Zongxue, Zhao Huan, et al. Spatiotemporal variation of extreme precipitation events in the Yarlung Zangbo River Basin from 1973 to 2016, China[J]. Mountain Research, 2018, 36(5):750-764. ] | |
| [18] | 王莉萍, 王维国, 张建忠. 我国主要流域降水过程时空分布特征分析[J]. 自然灾害学报, 2018, 27(2):161-173. |
| [ Wang Liping, Wang Weiguo, Zhang Jianzhong. Analysis on spatial and temporal distribution characteristics of precipitation processes over main river basin in China[J]. Journal of Natural Disasters, 2018, 27(2):161-173. ] | |
| [19] |
闫慧敏, 陈伟娜, 杨方兴, 等. 过去50年内蒙古极端气候事件时空格局特征[J]. 地理研究, 2014, 33(1):13-22.
doi: 10.11821/dlyj201401002 |
|
[ Yan Huimin, Chen Weina, Yang Fangxing, et al. The spatial and temporal analysis of extreme climatic events in Inner Mongolia during the past 50 years[J]. Geographical Research, 2014, 33(1):13-22. ]
doi: 10.11821/dlyj201401002 |
|
| [20] |
慈晖, 张强, 张江辉, 等. 1961-2010年新疆极端降水过程时空特征[J]. 地理研究, 2014, 33(10):1881-1891.
doi: 10.11821/dlyj201410009 |
|
[ Ci Hui, Zhang Qiang, Zhang Jianghui, et al. Spatiotemporal variations of extreme precipitation events within Xinjiang during 1961-2010[J]. Geographical Research, 2014, 33(10):1881-1891. ]
doi: 10.11821/dlyj201410009 |
|
| [21] | 尹泽生, 徐叔鹰. 祁连山区域地貌与制图研究[M]. 北京: 科学出版社, 1992: 97-106. |
| [ Yin Zesheng, Xu Shuying. Study on regional geomorphology and mapping in Qilian Mountains[M]. Beijing: Science Press, 1992: 97-106. ] | |
| [22] | 王宗太. 中国冰川目录(I): 祁连山区[M]. 兰州: 中国科学院兰州冰川冻土研究所, 1981: 58-61. |
| [ Wang Zongtai. Chinese glacier catalogue (I): Qilian Mountains Region[M]. Lanzhou: Lanzhou Institute of Glaciology and Cryopedology, Chinese Academy of Sciences, 1981: 58-61. ] | |
| [23] |
贾文雄, 张禹舜, 李宗省. 近50年来祁连山及河西走廊地区极端降水的时空变化研究[J]. 地理科学, 2014, 34(8):1002-1009.
doi: 10.13249/j.cnki.sgs.2014.08.1002 |
|
[ Jia Wenxiong, Zhang Yushun, Li Zongxing. Spatial and temporal change of precipitation extremes in Qilian Mountains and Hexi Corridor in recent fifty years[J]. Scientia Geographica Sinica, 2014, 34(8):1002-1009. ]
doi: 10.13249/j.cnki.sgs.2014.08.1002 |
|
| [24] | 付建新, 曹广超, 李玲琴, 等. 1960-2014年祁连山南坡及其附近地区降水时空变化特征[J]. 水土保持研究, 2018, 25(4):152-161. |
| [ Fu Jianxin, Cao Guangchao, Li Lingqin, et al. Analysis of temporal and spatial variation characteristics of precipitation in the south slope of Qilian Mountains and its nearby regions during 1960-2014[J]. Research of Soil and Water Conservation, 2018, 25(4):152-161. ] | |
| [25] | 汪宝龙, 张明军, 魏军林, 等. 1960-2009年青海省极端降水事件的变化特征[J]. 水土保持通报, 2012, 32(4):92-96, 317. |
| [ Wang Baolong, Zhang Mingjun, Wei Junlin, et al. Changes of extreme precipitation events in Qinghai Province during 1960-2009[J]. Bulletin of Soil and Water Conservation, 2012, 32(4):92-96, 317. ] | |
| [26] | 王婷婷, 冯起, 李宗省, 等. 1960-2012年祁连山东段古浪河流域极端气候事件研究[J]. 冰川冻土, 2018, 40(3):598-606. |
| [ Wang Tingting, Feng Qi, Li Zongxing, et al. Extreme climate research on Gulang River Basin in eastern Qilian Mountains during 1960-2012[J]. Journal of Glaciology and Geocryology, 2018, 40(3):598-606. ] | |
| [27] | Peterson T C, Folland C, Gruza G, et al. Report on the activities of the Working Group on Climate Change Detection and Related Rapporteurs 1998-2001, Rep. WCDMP-47, WMO-TD 1071[M]. Geneva: World Meteorological Organization, 2001. |
| [28] | 魏凤英. 现代气候统计诊断与预测技术[M]. 北京: 气象出版社, 1999: 17-31. |
| [ Wei Fengying. Modern climatic statistical diagnosis and forecasting technology[M]. Beijing: China Meteorological Press, 1999: 17-31. ] | |
| [29] | 于秀林, 任雪松. 多元统计分析[M]. 北京: 中国统计出版社, 1999: 75-90. |
| [ Yu Xiulin, Ren Xuesong. Multivariate statistical analysis[M]. Beijing: China Statistics Press, 1999: 75-90. ] | |
| [30] |
Folland C K, Palmer T N, Parker D E. Sahel rainfall and worldwide sea temperatures, 1901-85[J]. Nature, 1986, 320(6063):602-607.
doi: 10.1038/320602a0 |
| [31] |
Delworth T L, Mann M E. Observed and simulated multidecadal variability in the Northern Hemisphere[J]. Climate Dynamics, 2000, 16(9):661-676.
doi: 10.1007/s003820000075 |
| [32] | 李双林, 王彦明, 郜永祺. 北大西洋年代际振荡(AMO)气候影响的研究评述[J]. 大气科学学报, 2009, 32(3):458-465. |
| [ Li Shuanglin, Wang Yanming, Gao Yongqi. A review of the researches on the Atlantic Multidecadal Oscillation (AMO) and its climate influence[J]. Transactions of Atmospheric Sciences, 2009, 32(3):458-465. ] | |
| [33] | 陈发虎, 陈建徽, 黄伟. 中纬度亚洲现代间冰期气候变化的“西风模式”讨论[J]. 地学前缘, 2009, 16(6):23-32. |
| [ Chen Fahu, Chen Jianhui, Huang Wei. A discussion on the westerly-dominated climate model in mid-latitude Asia during the modern interglacial period[J]. Earth Science Frontiers, 2009, 16(6):23-32. ] | |
| [34] |
Alexander M A, Bladé I, Newman M, et al. The atmospheric bridge: The influence of ENSO teleconnections on air-sea interaction over the global oceans[J]. Journal of Climate, 2002, 15(16):2205-2231.
doi: 10.1175/1520-0442(2002)015<2205:TABTIO>2.0.CO;2 |
| [35] |
Wang B, Liu J, Yang J, et al. Distinct principal modes of early and late summer rainfall anomalies in East Asia[J]. Journal of Climate, 2009, 22(13):3864-3875.
doi: 10.1175/2009JCLI2850.1 |
| [36] | 张国斌. 近54年祁连山地区干旱时空变化及成因分析[D]. 兰州: 西北师范大学, 2016. |
| [ Zhang Guobin. Spatial-temporal variation and factors of drought in Qilian Mountain area in recent 54 years[D]. Lanzhou: Northwest Normal University, 2006. ] | |
| [37] |
Hurrell J W. Decadal trends in the North Atlantic Oscillation: Regional temperatures and precipitation[J]. Science, 1995, 269(5224):676-679.
pmid: 17758812 |
| [38] |
Thompson D W J, Wallace J M. The Arctic oscillation signature in the wintertime geopotential height and temperature fields[J]. Geophysical Research Letters, 1998, 25(9):1297-1300.
doi: 10.1029/98GL00950 |
| [39] | Alexander L V, Zhang X, Peterson T C, et al. Global observed changes in daily climate extremes of temperature and precipitation[J]. Journal of Geophysical Research Atmospheres, 2006, 111(D5):1042-1063. |
| [40] |
Wang X L, Hou X Y, Wang Y D, et al. Spatiotemporal variations and regional differences of extreme precipitation events in the coastal area of China from 1961 to 2014[J]. Atmospheric Research, 2017, 197:94-104.
doi: 10.1016/j.atmosres.2017.06.022 |
| [41] |
Madsen H, Lawrence D, Lang M, et al. Review of trend analysis and climate change projections of extreme precipitation and floods in Europe[J]. Journal of Hydrology, 2014, 519:3634-3650.
doi: 10.1016/j.jhydrol.2014.11.003 |
| [42] | 翟盘茂, 潘晓华. 中国北方近50年温度和降水极端事件变化[J]. 地理学报, 2003, 58(增刊1):1-10. |
| [ Zhai Panmao, Pan Xiaohua. Change in extreme temperature and precipitation over northern China during the second half of the 20th century[J]. Acta Geographica Sinica, 2003, 58(Suppl. 1):1-10. ] | |
| [43] | 翟盘茂, 王萃萃, 李威. 极端降水事件变化的观测研究[J]. 气候变化研究进展, 2007, 3(3):144-148. |
| [ Zhai Panmao, Wang Cuicui, Li Wei. A review on study of change in precipitation extremes[J]. Climate Change Research, 2007, 3(3):144-148. ] | |
| [44] | 李培都, 司建华, 冯起, 等. 1958-2015年敦煌及周边地区极端降水事件的时空变化特征[J]. 高原气象, 2018, 37(2):535-544. |
| [ Li Peidu, Si Jianhua, Feng Qi, et al. Temporal and spatial variation of extreme precipitation events in Dunhuang and surrounding areas from 1958 to 2015[J]. Plateau Meteorology, 2018, 37(2):535-544. ] | |
| [45] | 宋连春, 张存杰. 20世纪西北地区降水量变化特征[J]. 冰川冻土, 2003, 25(2):143-148. |
| [ Song Lianchun, Zhang Cunjie. Changing features of precipitation over northwest China during the 20th century[J]. Journal of Glaciology and Geocryology, 2003, 25(2):143-148. ] | |
| [46] | 马学谦, 孙安平. 祁连山区降水的大气特征分析[J]. 高原气象, 2011, 30(5):1392-1398. |
| [ Ma Xueqian, Sun Anping. Analysis on atmospheric characteristic of precipitation in Qilian Mountain[J]. Plateau Meteorology, 2011, 30(5):1392-1398. ] | |
| [47] | 张良, 张强, 冯建英, 等. 祁连山地区大气水循环研究(I): 空中水汽输送年际变化分析[J]. 冰川冻土, 2014, 36(5):1079-1091. |
| [ Zhang Liang, Zhang Qiang, Feng Jianying, et al. A study of atmospheric water cycle over the Qilian Mountains (I): Variation of annual water vapor transport[J]. Journal of Glaciology and Geocryology, 2014, 36(5):1079-1091. ] | |
| [48] | 张强, 张杰, 孙国武, 等. 祁连山山区空中水汽分布特征研究[J]. 气象学报, 2007, 65(4):633-643. |
| [ Zhang Qiang, Zhang Jie, Sun Guowu, et al. Research on atmospheric water-vapor distribution over Qilian Mountains[J]. Acta Meteorologica Sinica, 2007, 65(4):633-643. ] | |
| [49] | 张强, 俞亚勋, 张杰. 祁连山与河西内陆河流域绿洲的大气水循环特征研究[J]. 冰川冻土, 2008, 30(6):907-913. |
| [ Zhang Qiang, Yu Yaxun, Zhang Jie. Characteristics of water cycle in the Qilian Mountains and the oases in Hexi inland river basins[J]. Journal of Glaciology and Geocryology, 2008, 30(6):907-913. ] | |
| [50] | 施雅风, 沈永平, 李栋梁, 等. 中国西北气候由暖干向暖湿转型的特征和趋势探讨[J]. 第四纪研究, 2003, 23(2):152-164. |
| [ Shi Yafeng, Shen Yongping, Li Dongliang, et al. Discussion on the present climate change from warm-dry to warm-wet in northwest China[J]. Quaternary Sciences, 2003, 23(2):152-164. ] |
| [1] | 隋露, 闫志明, 李开放, 何佩恩, 马英杰, 张汝萃. 人类活动及气候变化影响下伊犁河谷生境质量预测研究[J]. 干旱区地理, 2024, 47(1): 104-116. |
| [2] | 牛怡莹, 李春兰, 王军, 许瀚卿, 刘青. 内蒙古ERA5再分析降水数据性能评估与极端降水时空特征分析[J]. 干旱区地理, 2023, 46(9): 1418-1431. |
| [3] | 田昊玮, 陈伏龙, 龙爱华, 刘静, 海洋. 博尔塔拉河源流区径流对气候变化的响应及预测[J]. 干旱区地理, 2023, 46(9): 1432-1442. |
| [4] | 艾丽亚, 王永芳, 郭恩亮, 银山, 顾锡羚. 基于GEE的大青山国家级自然保护区NDVI变化及影响因素分析[J]. 干旱区地理, 2023, 46(8): 1279-1290. |
| [5] | 高晓宇, 郝海超, 张雪琪, 陈亚宁. 中国西北干旱区植被水分利用效率变化对气象要素的响应——以新疆为例[J]. 干旱区地理, 2023, 46(7): 1111-1120. |
| [6] | 冯宜明, 吕春燕, 王零, 赵维俊, 马雪娥, 杜军林, 何俊龄. 不同林分密度青海云杉林碳氮储量及其分配格局[J]. 干旱区地理, 2023, 46(7): 1133-1144. |
| [7] | 顾朝林, 苏鹤放, 顾江, 高喆, 陈乐琳, 郭力. 论地球科学的新时代[J]. 干旱区地理, 2023, 46(7): 1176-1195. |
| [8] | 陈淑君,许国昌,吕志平,马铭悦,李晗羽,朱玉岩. 中国植被覆盖度时空演变及其对气候变化和城市化的响应[J]. 干旱区地理, 2023, 46(5): 742-752. |
| [9] | 芦雄英, 刘贤德, 马瑞, 赵维俊, 敬文茂, 何晓玲, 赵长兴. 祁连山排露沟流域青海云杉林更新特征对地形因子的响应[J]. 干旱区地理, 2023, 46(4): 604-613. |
| [10] | 李娜,武永利,赵桂香,钱锦霞,李芬,赵海英,韩普. 近60 a山西省极端气温事件的年际变化及其对区域增暖的响应[J]. 干旱区地理, 2023, 46(3): 337-348. |
| [11] | 任涛涛,李双双,段克勤,何锦屏. 黄土高原热浪型和缺水型骤旱时空变化特征及其影响因素[J]. 干旱区地理, 2023, 46(3): 360-370. |
| [12] | 晋子振, 秦翔, 赵求东, 李延召, 刘宇硕, 陈记祖, 王利辉, 王强. 祁连山西段老虎沟流域消融季径流变化特征研究[J]. 干旱区地理, 2023, 46(2): 178-190. |
| [13] | 曹晓云,肖建设,郝晓华,史飞飞,刘致远,李素雲. 2001—2020年三江源地区积雪日数变化及地形分异[J]. 干旱区地理, 2022, 45(5): 1370-1380. |
| [14] | 梁鹏飞,辛惠娟,李宗省,张百娟,桂娟,段然,南富森,丁增扬平,杨盛梅. 祁连山黑河径流变化特征及影响因素研究[J]. 干旱区地理, 2022, 45(5): 1460-1471. |
| [15] | 胡可可,何建村,赵健,苏里坦,张音. 气候变化背景下尼雅河流域生态基流研究[J]. 干旱区地理, 2022, 45(5): 1472-1480. |
| Viewed | ||||||||||||||||||||||||||||||||||||||||||||||||||
|
Full text 813
|
|
|||||||||||||||||||||||||||||||||||||||||||||||||
|
Abstract 707
|
|
|||||||||||||||||||||||||||||||||||||||||||||||||
Cited |
|
|||||||||||||||||||||||||||||||||||||||||||||||||
| Shared | ||||||||||||||||||||||||||||||||||||||||||||||||||
|
||