- 2025年5月9日 星期五
干旱区地理 ›› 2021, Vol. 44 ›› Issue (2): 552-564.doi: 10.12118/j.issn.1000–6060.2021.02.26
王波1,2( ),杨太保1()
收稿日期:2020-07-01
修回日期:2020-12-06
出版日期:2021-03-25
发布日期:2021-04-14
通讯作者:
杨太保
作者简介:王波(1978-),男,博士研究生,讲师,主要从事景观与区域规划研究. E-mail:基金资助:
WANG Bo1,2(),YANG Taibao1()
Received:2020-07-01
Revised:2020-12-06
Online:2021-03-25
Published:2021-04-14
Contact:
Taibao YANG
摘要:
生态系统服务价值(Ecosystem service values,ESV)的准确评估及其驱动力分析,关乎区域生态安全和经济发展。基于1980—2018年银川市各区县的土地利用数据,结合变化率、动态度、敏感性和相关性核算了银川市的生态系统服务价值,并利用地理探测器分析了驱动因子。结果表明:1980—2018年不同生态服务类型总的ESV在减小,减少了0.753×10⁹元。绝大部分生态服务类型的生态系统服务价值变化幅度较小,水文调节的价值最高且变化显著。水资源供给的变化动态度最大,并且呈增长趋势;草地和水体生态系统服务价值的敏感性较强,水体与总的生态系统服务价值关联性最强。从分布来看,灵武市生态系统服务价值最高,金凤县最小。单因子主要驱动因子为国内生产总值(Gross domestic product,GDP)和数字高程模型(Digital elevation model,DEM),多因子交互驱动中GDP ∩ 气温和GDP ∩ DEM对银川市ESV分布的贡献最大,银川市生态系统服务价值分布主要受人为因素和自然因素的交互作用影响。
王波,杨太保. 1980—2018年银川市生态系统服务价值评价及驱动力分析[J]. 干旱区地理, 2021, 44(2): 552-564.
WANG Bo,YANG Taibao. Value evaluation and driving force analysis of ecosystem services in Yinchuan City from 1980 to 2018[J]. Arid Land Geography, 2021, 44(2): 552-564.
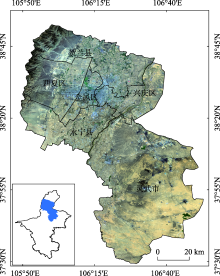
图1
银川市地理位置"

表1
银川市各土地利用类型的ESV计算指标"
| 服务类别 | 单项服务 | 林地 | 草地 | 耕地 | 水体 | 裸地 |
|---|---|---|---|---|---|---|
| 供给服务 | 食物生产 | 6.472 | 5.450 | 42.854 | 22.313 | 0.000 |
| 原料生产 | 14.648 | 8.005 | 5.178 | 12.434 | 0.000 | |
| 水资源供给 | 7.494 | 4.428 | -71.537 | 185.314 | 0.000 | |
| 调节服务 | 气体调节 | 48.032 | 28.104 | 34.814 | 45.477 | 0.681 |
| 气候调节 | 144.095 | 74.262 | 17.986 | 100.321 | 0.000 | |
| 净化环境 | 43.603 | 24.527 | 5.314 | 155.847 | 3.407 | |
| 水文调节 | 114.118 | 54.334 | 75.965 | 2154.100 | 1.022 | |
| 支持服务 | 土壤保持 | 58.592 | 34.235 | 7.290 | 55.185 | 0.681 |
| 维持养分循环 | 4.428 | 2.725 | 5.995 | 4.258 | 0.000 | |
| 生物多样性 | 53.482 | 31.169 | 6.609 | 177.479 | 0.681 | |
| 文化服务 | 美学景观 | 23.505 | 13.796 | 2.861 | 112.755 | 0.341 |
| 合计 | 518.469 | 281.035 | 133.329 | 3025.483 | 6.813 |
表2
两个自变量对因变量交互作用的类型"
| 判据 | 交互作用 |
|---|---|
| q(X1 ∩ X2)<min[q(X1),q(X2)] | 非线性减弱 |
| min[q(X1), q(X2)]<q(X1 ∩ X2)<max[q(X1), q(X2)] | 单因子非线性减弱 |
| q(X1 ∩ X2)>max[q(X1), q(X2)] | 双因子增强 |
| q(X1 ∩ X2)=q(X1) + q(X2) | 独立 |
| q(X1 ∩ X2)>q(X1) + q(X2) | 非线性增强 |
表3
银川市不同生态服务项目的ESV值"
| 服务项目 | 1980年 | 1990年 | 1995年 | 2000年 | 2005年 | 2010年 | 2015年 | 2018年 |
|---|---|---|---|---|---|---|---|---|
| 食物生产 | 1.066 | 1.067 | 1.199 | 1.277 | 1.216 | 1.225 | 1.245 | 1.182 |
| 原料生产 | 0.446 | 0.445 | 0.438 | 0.445 | 0.440 | 0.442 | 0.438 | 0.425 |
| 水资源供给 | -0.691 | -0.750 | -0.978 | -1.063 | -0.949 | -0.976 | -1.013 | -0.935 |
| 气体调节 | 1.877 | 1.877 | 1.908 | 1.964 | 1.920 | 1.930 | 1.925 | 1.858 |
| 气候调节 | 3.569 | 3.563 | 3.390 | 3.403 | 3.397 | 3.412 | 3.355 | 3.279 |
| 净化环境 | 1.527 | 1.491 | 1.450 | 1.476 | 1.483 | 1.476 | 1.459 | 1.423 |
| 水文调节 | 9.384 | 8.820 | 9.260 | 9.841 | 9.863 | 9.752 | 9.819 | 9.491 |
| 土壤保持 | 1.620 | 1.614 | 1.533 | 1.540 | 1.537 | 1.542 | 1.516 | 1.482 |
| 维持养分循环 | 0.229 | 0.229 | 0.241 | 0.251 | 0.243 | 0.245 | 0.246 | 0.236 |
| 生物多样性 | 1.813 | 1.774 | 1.721 | 1.756 | 1.760 | 1.757 | 1.738 | 1.695 |
| 美学景观 | 0.892 | 0.865 | 0.847 | 0.870 | 0.874 | 0.870 | 0.863 | 0.841 |
| 合计 | 21.732 | 20.995 | 21.009 | 21.760 | 21.784 | 21.675 | 21.591 | 20.977 |
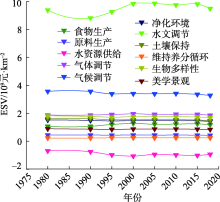
图2
1980—2018年银川市各生态服务类型的ESV变化趋势"

表4
1980—2018年银川市不同土地类型ESV的变化率"
| 土地类型 | 1980—1990年 | 1990—1995年 | 1995—2000年 | 2000—2005年 | 2005—2010年 | 2010—2015年 | 2015—2018年 | 1980—2018年 |
|---|---|---|---|---|---|---|---|---|
| 林地 | -0.286 | -1.768 | -4.663 | 6.348 | 0.681 | -1.814 | -1.878 | -0.087 |
| 草地 | 0.981 | -10.716 | -0.292 | -1.560 | 0.624 | -2.881 | -1.488 | -0.393 |
| 耕地 | 0.659 | 17.983 | 7.754 | -5.989 | 0.949 | 2.428 | -5.770 | 0.462 |
| 水体 | -10.268 | 7.120 | 8.782 | 1.974 | -2.285 | 1.295 | -3.185 | 0.088 |
| 裸地 | -1.172 | -4.188 | -12.051 | 6.332 | -7.601 | -4.544 | -4.158 | -0.702 |
表5
银川市不同生态服务类型的ESV变化动态度及其趋势"
| 服务项目 | 变化动态度/% | 等级 | 趋势 |
|---|---|---|---|
| 食物生产 | 0.295 | 2 | 增加 |
| 原料生产 | -0.118 | 6 | 减少 |
| 水资源供给 | 0.917 | 1 | 增加 |
| 气体调节 | -0.023 | 5 | 减少 |
| 气候调节 | -0.213 | 10 | 减少 |
| 净化环境 | -0.177 | 9 | 减少 |
| 水文调节 | 0.044 | 4 | 增加 |
| 土壤保持 | -0.223 | 11 | 减少 |
| 维持养分循环 | 0.086 | 3 | 增加 |
| 生物多样性 | -0.170 | 8 | 减少 |
| 美学景观 | -0.146 | 7 | 减少 |
表6
1980—2018年银川市不同土地类型VC调整(VC±50%VC)的敏感性指数"
| 土地类型 | 1980年 | 1990年 | 1995年 | 2000年 | 2005年 | 2010年 | 2015年 | 2018年 |
|---|---|---|---|---|---|---|---|---|
| 林地 | ±0.126 | ±0.130 | ±0.127 | ±0.117 | ±0.125 | ±0.126 | ±0.124 | ±0.126 |
| 草地 | ±0.384 | ±0.401 | ±0.358 | ±0.344 | ±0.339 | ±0.342 | ±0.334 | ±0.339 |
| 耕地 | ±0.116 | ±0.121 | ±0.143 | ±0.148 | ±0.139 | ±0.141 | ±0.145 | ±0.141 |
| 水体 | ±0.370 | ±0.343 | ±0.367 | ±0.386 | ±0.393 | ±0.386 | ±0.393 | ±0.391 |
| 裸地 | ±0.005 | ±0.005 | ±0.005 | ±0.004 | ±0.005 | ±0.004 | ±0.004 | ±0.004 |
表7
不同土地类型VC调整50%之后的ESV占比"
| 土地类型 | 1980年 | 1990年 | 1995年 | 2000年 | 2005年 | 2010年 | 2015年 | 2018年 |
|---|---|---|---|---|---|---|---|---|
| 林地 | 9.663 | 9.681 | 9.670 | 9.624 | 9.657 | 9.664 | 9.656 | 9.662 |
| 草地 | 10.834 | 10.913 | 10.717 | 10.656 | 10.630 | 10.647 | 10.608 | 10.629 |
| 耕地 | 9.619 | 9.641 | 9.739 | 9.765 | 9.724 | 9.734 | 9.752 | 9.732 |
| 水体 | 10.770 | 10.651 | 10.761 | 10.845 | 10.877 | 10.845 | 10.875 | 10.869 |
| 裸地 | 9.114 | 9.115 | 9.114 | 9.110 | 9.111 | 9.110 | 9.109 | 9.109 |
表8
土地类型与生态服务类型的相关性指标"
| 服务项目 | 林地 | 草地 | 耕地 | 水体 | 裸地 |
|---|---|---|---|---|---|
| 文化服务 | 0.364 | 0.559* | -0.346 | 0.169 | 0.465 |
| 供给服务 | 0.613* | 0.864** | -0.903** | -0.404 | 0.721** |
| 调节服务 | -0.203 | -0.438 | 0.629* | 0.903** | -0.413 |
| 支持服务 | 0.457 | 0.889** | -0.656** | -0.352 | 0.790** |
| 总价值 | 0.012 | -0.073 | 0.304 | 0.721** | -0.096 |
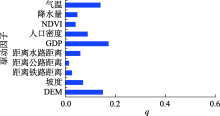
图3
银川市ESV单因子驱动力 注:NDVI为归一化植被指数;GDP为国内生产总值;DEM为数字高程模型;q为自变量X对属性Y的解释力。下同。"

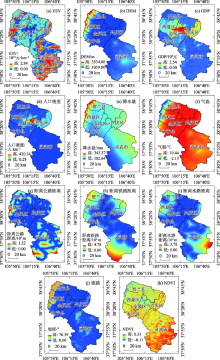
图4
银川市ESV及影响因子空间分布"

表9
银川市ESV因子组合驱动力"
| DEM | 坡度 | 距离铁路距离 | 距离公路距离 | 距离水路距离 | NDVI | 降水量 | 气温 | 人口密度 | GDP | |
|---|---|---|---|---|---|---|---|---|---|---|
| DEM | 0.151 | |||||||||
| 坡度 | 0.183 | 0.074 | ||||||||
| 距离铁路距离 | 0.184 | 0.132 | 0.028 | |||||||
| 距离公路距离 | 0.158 | 0.084 | 0.047 | 0.016 | ||||||
| 距离水路距离 | 0.164 | 0.131 | 0.102 | 0.072 | 0.061 | |||||
| NDVI | 0.174 | 0.155 | 0.075 | 0.058 | 0.096 | 0.042 | ||||
| 降水量 | 0.208 | 0.144 | 0.103 | 0.081 | 0.131 | 0.106 | 0.048 | |||
| 气温 | 0.168 | 0.186 | 0.185 | 0.152 | 0.161 | 0.174 | 0.226 | 0.141 | ||
| 人口密度 | 0.205 | 0.178 | 0.123 | 0.107 | 0.145 | 0.106 | 0.150 | 0.222 | 0.090 | |
| GDP | 0.304 | 0.262 | 0.207 | 0.186 | 0.231 | 0.212 | 0.230 | 0.320 | 0.203 | 0.173 |
| [1] | 黄敏, 杨飞, 郑士伟. 中国城镇化进程对生态系统服务价值的影响[J]. 水土保持研究, 2019,26(1):352-359. |
| [ Huang Min, Yang Fei, Zheng Shiwei. Impact of urbanization process on ecosystem service value in China[J]. Research of Soil and Water Conservation, 2019,26(1):352-359. ] | |
| [2] | 史慧慧, 程久苗, 费罗成, 等. 1990—2015年长三角城市群土地利用转型与生态系统服务功能变化[J]. 水土保持研究, 2019,26(1):301-307. |
| [ Shi Huihui, Cheng Jiumiao, Fei Luocheng, et al. Land use transition and changes of ecosystem service function in urban agglomerations of the Yangtze River Delta from 1990 to 2015[J]. Research of Soil and Water Conservation, 2019,26(1):301-307. ] | |
| [3] | 欧阳志云, 王如松, 赵景柱. 生态系统服务功能及其生态经济价值评价[J]. 应用生态学报, 1999,10(5):635-640. |
| [ Ouyang Zhiyun, Wang Rusong, Zhao Jingzhu. Ecosystem services and their economic valuation[J]. Chinese Journal of Applied Ecology, 1999,10(5):635-640. ] | |
| [4] | Reid W V, Mooney H A, Cropper A, et al. Ecosystems and human well-being-synthesis: A report of the millennium ecosystem assessment[M]. Washington DC: Island Press, 2005: 3-21. |
| [5] | Crossman N D, Burkhard B, Nedkov S, et al. A blueprint for mapping and modelling ecosystem services[J]. Ecosystem Services, 2013(4):4-14. |
| [6] | Costanza R D'Arge R, Groot R D, , et al. The value of the world’s ecosystem services and natural capital[J]. Nature, 1997,387(6630):253-260. |
| [7] | 谢高地, 张彩霞, 张昌顺, 等. 中国生态系统服务的价值[J]. 资源科学, 2015,37(9):1740-1746. |
| [ Xie Gaodi, Zhang Caixia, Zhang Changshun, et al. The value of ecosystem services in China[J]. Resources Science, 2015,37(9):1740-1746. ] | |
| [8] | 欧阳志云, 王效科, 苗鸿. 中国陆地生态系统服务功能及其生态经济价值的初步研究[J]. 生态学报, 1999,19(5):607-613. |
| [ Ouyang Zhiyun, Wang Xiaoke, Miao Hong. A primary study on Chinese terrestrial ecosystem services and their ecological-economic values[J]. Acta Ecologica Sinica, 1999,19(5):607-613. ] | |
| [9] | 谢高地, 张彩霞, 张雷明, 等. 基于单位面积价值当量因子的生态系统服务价值化方法改进[J]. 自然资源学报, 2015,30(8):1243-1254. |
| [ Xie Gaodi, Zhang Caixia, Zhang Leiming, et al. Improvement of the evaluation method for ecosystem service value based on per unit area[J]. Journal of Natural Resources, 2015,30(8):1243-1254. ] | |
| [10] | 张瑜. 黄土高原生态系统服务价值动态评估及其变化研究[D]. 北京: 中国科学院大学(中国科学院遥感与数字地球研究所), 2018. |
| [ Zhang Yu. Research on the dynamic evaluation and change of ecosystem service value in loess plateau[D]. Beijing: University of Chinese Academy of Sciences(Institute of Remote Sensing and Digital Earth Chinese Academy of Sciences, Beijing, China), 2018. ] | |
| [11] | 王鹏, 刘小鹏, 王亚娟, 等. 黄土丘陵沟壑区生态移民过程及其生态系统服务价值评价——以宁夏海原县为例[J]. 干旱区地理, 2019,42(2):433-443. |
| [ Wang Peng, Liu Xiaopeng, Wang Yajuan, et al. Ecological migration process and the evaluation of its ecosystem service value in Loess hilly and gully region: A case study of Haiyuan County, Ningxia[J]. Arid Land Geography, 2019,42(2):433-443. ] | |
| [12] | Feng J, Zhao L D, Zhang Y B, et al. Can climate change influence agricultural GTFP in arid and semi-arid regions of northwest China?[J]. Journal of Arid Land, 2020,12(5):837-853. |
| [13] | 赵建林, 康德奎, 彭维恩, 等. 景电灌区移民对祁连山植被恢复的相对生态价值[J]. 干旱区地理, 2020,43(1):182-189. |
| [ Zhao Jianlin, Kang Dekui, Peng Weien, et al. Relative ecological value of vegetation restoration after migrating people from Qilian Mountains to Jingdian Irrigation Area[J]. Arid Land Geography, 2020,43(1):182-189. ] | |
| [14] | 谢高地, 张钇锂, 鲁春霞, 等. 中国自然草地生态系统服务价值[J]. 自然资源学报, 2001,16(1):47-53. |
| [ Xie Gaodi, Zhang Yili, Lu Chunxia, et al. Study on valuation of rangeland ecosystem services of China[J]. Journal of Natural Resources, 2001,16(1):47-53. ] | |
| [15] | Costanza R T, Groot R D, Sutton P, et al. Changes in the global value of ecosystem services[J]. Global Environmental Change, 2014, (26):152-158. |
| [16] | 李怡, 郭力宇, 温豪. 陕西渭北旱塬区土地利用与生态系统服务价值变化——以陇县为例[J]. 水土保持研究, 2019,26(1):368-373. |
| [ Li Yi, Guo Liyu, Wen Hao. Dynamic changes of land use and ecosystem service values in the arid-highland, north of Weihe River in Shaanxi Province: A case study of the Long County[J]. Research of Soil and Water Conservation, 2019,26(1):368-373. ] | |
| [17] | 胡应龙, 陈颖彪, 郑子豪, 等. 广州市生态系统服务价值空间异质性变化[J]. 热带地理, 2018,38(4):475-486. |
| [ Hu Yinglong, Chen Yingbiao, Zheng Zihao, et al. Spatial heterogeneity change of Guangzhou ecosystem services value[J]. Tropical Geography, 2018,38(4):475-486. ] | |
| [18] | 约日古丽·卡斯木, 杨胜天, 孜比布拉·司马义. 新疆艾比湖流域土地利用变化对生态系统服务价值的影响[J]. 农业工程学报, 2019,35(2):260-269. |
| [ Yueriguli Kasimu, Yang Shengtian, Zibibula Simayi. Impact of land use change on ecosystem service value in Ebinur Lake Basin, Xinjiang[J]. Transactions of the Chinese Society of Agricultural Engineering, 2019,35(2):260-269. ] | |
| [19] | 熊鹰, 张方明, 龚长安, 等. LUCC影响下湖南省生态系统服务价值时空演变[J]. 长江流域资源与环境, 2018,27(6):1397-1408. |
| [ Xiong Ying, Zhang Fangming, Gong Chang’an, et al. Spatial-temporal evolvement of ecosystem service value in Hunan Province based on LUCC[J]. Resources and Environment in the Yangtze Basin, 2018,27(6):1397-1408. ] | |
| [20] | 赵育恒, 曾晨. 武汉城市圈生态服务价值时空演变分析及影响因素[J]. 生态学报, 2019,39(4):1426-1440. |
| [ Zhao Yuheng, Zeng Chen. Analysis of spatial-temporal evolution and factors that influences ecological service values in Wuhan urban agglomeration, China[J]. Acta Ecologica Sinica, 2019,39(4):1426-1440. ] | |
| [21] | Fang X, Tang G A, Li B C, et al. Spatial and temporal variations of ecosystem service values in relation to land use pattern in the Loess Plateau of China at town scale[J]. Plos One, 2014,9(10):e110745, doi: 101371/journal.pone.0110745. |
| [22] | 杨海超. 银川市土地利用与生态服务价值变化研究[J]. 农业科学研究, 2015,36(1):35-39. |
| [ Yang Haichao. Study on land-use and ecological service value of Yinchuan[J]. Journal of Agricultural Sciences, 2015,36(1):35-39. ] | |
| [23] | 郭婉婷, 邓宇. 银川市生态系统服务价值评价及驱动力分析[J]. 中国环境管理干部学院学报, 2019,29(6):26-29, 41. |
| [ Guo Wanting, Deng Yu. Evaluation of the value of ecosystem services in Yinchuan City and its driving force analysis[J]. Journal of Environmental Management College of China, 2019,29(6):26-29, 41. ] | |
| [24] | Schirpke U, Kohler M, Leitinger G, et al. Future impacts of changing land-use and climate on ecosystem services of mountain grassland and their resilience[J]. Ecosystem Services, 2017(26):79-94. |
| [25] | 张骞, 高明, 杨乐, 等. 1988—2013年重庆市主城九区生态用地空间结构及其生态系统服务价值变化[J]. 生态学报, 2017,37(2):566-575. |
| [ Zhang Qian, Gao Ming, Yang Le, et al. Changes in the spatial structure of ecological land and ecosystem service values in nine key districts of Chongqing City over the past 25 years[J]. Acta Ecologica Sinica, 2017,37(2):566-575. ] | |
| [26] | 王秀兰, 包玉海. 土地利用动态变化研究方法探讨[J]. 地理科学进展, 1999,18(1):81-87. |
| [ Wang Xiulan, Bao Yuhai. Study on the methods of land use dynamic change research[J]. Progress in Geography, 1999,18(1):81-87. ] | |
| [27] | Mengistie K, Thomas S, Martin D, et al. Scenario modelling of land use/land cover changes in Munessa-Shashemene landscape of the Ethiopian highlands[J]. Science of the Total Environment, 2018, (622-623):534-546. |
| [28] | 王劲峰, 徐成东. 地理探测器: 原理与展望[J]. 地理学报, 2017,72(1):116-134. |
| [ Wang Jingfeng, Xu Chengdong. Geodetector: Principle and prospective[J]. Acta Geographica Sinica, 2017,72(1):116-134. ] | |
| [29] | 刘丹, 王烜, 李春晖, 等. 水文连通性对湖泊生态环境影响的研究进展[J]. 长江流域资源与环境, 2019,28(7):1702-1715. |
| [ Liu Dan, Wang Xuan, Li Chunhui, et al. Eco-environmental effects of hydrological connectivity on lakes: A review[J]. Resources and Environment in the Yangtze Basin, 2019,28(7):1702-1715. ] | |
| [30] | 郑华, 欧阳志云, 赵同谦, 等. 人类活动对生态系统服务功能的影响[J]. 自然资源学报, 2003,18(1):118-126. |
| [ Zheng Hua, Ouyang Zhiyun, Zhao Tongqian, et al. The impact of human activities on ecosystem services[J]. Journal of Natural Resources, 2003,18(1):118-126. ] | |
| [31] | 张舟, 吴次芳, 谭荣. 生态系统服务价值在土地利用变化研究中的应用: 瓶颈和展望[J]. 应用生态学报, 2013,24(2):556-562. |
| [ Zhang Zhou, Wu Cifang, Tan Rong. Application of ecosystem service value in land use change research: Bottlenecks and prospects[J]. Chinese Journal of Applied Ecology, 2013,24(2):556-562. ] | |
| [32] | 肖强, 胡聃, 肖洋, 等. 基于协整理论的经济增长与生态环境变化关系分析——以重庆市渝东南地区为例[J]. 生态学报, 2012,32(11):3577-3585. |
| [ Xiao Qiang, Hu Dan, Xiao Yang, et al. Co-integration theory-based analysis on relationships between economic growth and eco-environmental changes: Taking the southeast district in Chongqing City as an example[J]. Acta Ecologica Sinica, 2012,32(11):3577-3585. ] | |
| [33] | 古力扎提·艾买提. 基于RS和GIS准东荒漠露天煤矿区景观格局变化及生态服务价值分析[D]. 乌鲁木齐: 新疆大学, 2017. |
| [ Gulzat Aimaiti. Study on landscape pattern change and ecological service value of Zhundong open-pit coalmine area based on RS and GIS[D]. Urumqi: Xinjiang University, 2017. ] | |
| [34] | 赵宇豪, 党虹, 叶苗, 等. 祁连山土地利用情景下生态系统水源供给特征[J]. 兰州大学学报(自然科学版), 2018,54(2):233-238. |
| [ Zhao Yuhao, Dang Hong, Ye Miao, et al. Characteristics of ecosystem water supply in the Qilian Mountains under land use scenarios[J]. Journal of Lanzhou University: Natural Sciences, 2018,54(2):233-238. ] | |
| [35] | 董中龙. 银川市水资源管理研究[D]. 北京: 中央民族大学, 2016. |
| [ Dong Zhonglong. Study on water resources management in Yinchuan City[D]. Beijing: Minzu University of China, 2016. ] | |
| [36] | 李建春. 银川市耕地变化与基本农田空间布局优化研究[D]. 北京: 中国农业大学, 2014. |
| [ Li Jianchun. Evolution of arable land and optimization of spatial distribution of basic farmland in Yinchuan[D]. Beijing: China Agricultural University, 2014. ] | |
| [37] | Liu X, Liu H L, Chen W Z, et al. Spatiotemporal fragmentation of urban residential land use: A case study from China[J]. Sustainability, 2017,9(7):1096. |
| [38] | 张微微, 李晶, 刘焱序. 关中-天水经济区农田生态系统服务价值评价[J]. 干旱地区农业研究, 2012,30(2):201-205. |
| [ Zhang Weiwei, Li Jing, Liu Yanxu. The farmland ecosystem service value of Guanzhong-Tianshui Economic Zone[J]. Agricultural Research in the Arid Areas, 2012,30(2):201-205. ] | |
| [39] | 赵艳霞, 武爱彬, 刘欣, 等. 浅山丘陵区土地利用地形梯度特征与生态服务价值响应[J]. 水土保持研究, 2014,21(3):141-145. |
| [ Zhao Yanxia, Wu Aibing, Liu Xin, et al. Terrain gradient features and response of ecological services value in shallow Hilly Region[J]. Research of Soil and Water Conservation, 2014,21(3):141-145. ] | |
| [40] | He Y, Yan H W, Ma L, et al. Spatiotemporal dynamics of the vegetation in Ningxia, China using MODIS imagery[J]. Frontiers of Earth Science, 2020,14(1):221-235. |
| [41] | 谭华, 智海, 李艳春, 等. 城市化及湖泊湿地修复对银川市气候影响初探[J]. 干旱区地理, 2019,42(3):509-516. |
| [ Tan Hua, Zhi Hai, Li Yanchun, et al. Influence of urbanization and lake wetland restoration on the climate evolution in Yinchuan City[J]. Arid Land Geography, 2019,42(3):509-516. ] | |
| [42] | 刘月亮, 成方龙, 李芳, 等. 广州市景观格局演变特征及驱动因素交互探测[J]. 资源与产业, 2019,21(4):68-80. |
| [ Liu Yueliang, Cheng Fanglong, Li Fang, et al. Interactive detection between evolutional features and driving forces of Guangzhou’s landscape pattern[J]. Resources & Industries, 2019,21(4):68-80. ] | |
| [43] | 胡凯衡, 魏丽, 刘双, 等. 横断山区泥石流空间格局和激发雨量分异性研究[J]. 地理学报, 2019,74(11):2303-2313. |
| [ Hu Kaiheng, Wei Li, Liu Shuang, et al. Spatial pattern of debris-flow catchments and the rainfall amount of triggering debris flows in the Hengduan Mountains region[J]. Acta Geographica Sinica, 2019,74(11):2303-2313. ] | |
| [44] | 王欢, 高江波, 侯文娟. 基于地理探测器的喀斯特不同地貌形态类型区土壤侵蚀定量归因[J]. 地理学报, 2018,73(9):1674-1686. |
| [ Wang Huan, Gao Jiangbo, Hou Wenjuan. Quantitative attribution analysis of soil erosion in different morphological types of geomorphology in karst areas: Based on the geographical detector method[J]. Acta Geographica Sinica, 2018,73(9):1674-1686. ] | |
| [45] | 邴广路, 石培基, 居玲华. 生态脆弱区土地利用变化及驱动因素分析——以张掖市为例[J]. 干旱区研究, 2010,27(2):169-175. |
| [ Bing Guanglu, Shi Peiji, Ju Linghua. Lanalysis on land use change and its driving factors in ecological fragile region: A case study in Zhangye City[J]. Arid Zone Research, 2010,27(2):169-175. ] | |
| [46] | 韩蕊, 孙思琦, 郭泺, 等. 川东地区生态系统服务价值时空演变及其驱动力分析[J]. 生态与农村环境学报, 2019,35(9):1136-1143. |
| [ Han Rui, Sun Siqi, Guo Li, et al. Evolution of ecosystem service value and analysis of driving forces in the east region of Sichuan Province, China[J]. Journal of Ecology and Rural Environment, 2019,35(9):1136-1143. ] |
| [1] | 彭娅, 王娟娟, 王珊珊, 田柳兰, 刘婕, 毋兆鹏. 生态安全视角下乌鲁木齐市土地利用冲突时空格局演变分析[J]. 干旱区地理, 2024, 47(1): 81-92. |
| [2] | 杨雨, 宋福铁, 张杰. 基于地理探测器的中国金融网络空间结构特征及影响因素研究[J]. 干旱区地理, 2023, 46(9): 1524-1535. |
| [3] | 李建辉, 陈琳, 党争. 黄河流域爱国主义教育基地空间格局及影响因素研究[J]. 干旱区地理, 2023, 46(9): 1536-1544. |
| [4] | 张昊, 韩增林, 乔国荣, 王辉, 王宏业, 段冶. 黄河流域城市间旅游经济联系格局及影响因素研究[J]. 干旱区地理, 2023, 46(8): 1344-1354. |
| [5] | 康利刚, 曹生奎, 曹广超, 严莉, 陈链璇, 李文斌, 赵浩然. 青海湖流域地表温度时空变化特征研究[J]. 干旱区地理, 2023, 46(7): 1084-1097. |
| [6] | 穆佳薇, 乔保荣, 余国新. 新疆塔里木河流域县域农业低碳生产率时空格局及影响效应研究[J]. 干旱区地理, 2023, 46(6): 968-981. |
| [7] | 孔德明, 郝丽莎, 夏四友, 李红波. 粮食单产视角下中国北方农牧交错带粮食安全研究[J]. 干旱区地理, 2023, 46(5): 782-792. |
| [8] | 罗嘉艳, 张靖, 徐梦冉, 莫宇, 同丽嘎. 浑善达克沙地植被变化定量归因及多情景预测[J]. 干旱区地理, 2023, 46(4): 614-624. |
| [9] | 朱磊, 李燕楠, 胡静, 田小波, 徐佳慧, 卿琪. 中国研学实践基地空间格局的多尺度特征及影响机理研究[J]. 干旱区地理, 2023, 46(4): 625-635. |
| [10] | 杨玉欢,贺建雄,张新红,芮旸. 中国农文旅耦合协调发展空间分异特征及影响肌理[J]. 干旱区地理, 2023, 46(3): 448-459. |
| [11] | 程静,王鹏,陈红翔,韩永贵. 渭河流域生境质量时空演变及其地形梯度效应与影响因素[J]. 干旱区地理, 2023, 46(3): 481-491. |
| [12] | 马丽娜, 张飞云, 翟玉鑫, 滕伦, 康建国. 1980—2020年新疆土地利用变化下生态系统服务价值时空演变分析[J]. 干旱区地理, 2023, 46(2): 253-263. |
| [13] | 鹿晨昱,黄萍,张彤,刘小莞,成薇. 甘肃省绿色发展效率时空演化与驱动因素研究[J]. 干旱区地理, 2023, 46(2): 305-315. |
| [14] | 杨洋, 乔家君, 王伟, 张二申. 扶贫资源配置对低收入农户收入影响——以青海省18村为例[J]. 干旱区地理, 2023, 46(2): 325-336. |
| [15] | 马晓敏, 张志斌, 郭倩倩, 吴志祥, 冯雪丽. 中国科普教育基地空间分布、类型结构及影响因素[J]. 干旱区地理, 2023, 46(11): 1879-1890. |
| Viewed | ||||||||||||||||||||||||||||||||||||||||||||||||||
|
Full text 89
|
|
|||||||||||||||||||||||||||||||||||||||||||||||||
|
Abstract 349
|
|
|||||||||||||||||||||||||||||||||||||||||||||||||
Cited |
|
|||||||||||||||||||||||||||||||||||||||||||||||||
| Shared | ||||||||||||||||||||||||||||||||||||||||||||||||||
|
||