干旱区地理 ›› 2026, Vol. 49 ›› Issue (9): 1815-1825.doi: 10.12118/j.issn.1000-6060.2025.685 cstr: 32274.14.ALG2025685
李晓鹏( ), 贾富贵, 雷双, 李康
收稿日期:2025-10-27
修回日期:2025-12-20
出版日期:2026-09-25
发布日期:2026-09-07
作者简介:李晓鹏(1981-),女,博士,教授,主要从事生态环境与区域发展研究. E-mail: lixiaopeng1396@163.com
基金资助:
LI Xiaopeng(), JIA Fugui, LEI Shuang, LI Kang
Received:2025-10-27
Revised:2025-12-20
Published:2026-09-25
Online:2026-09-07
摘要:
黄河流域作为我国生态脆弱性集中凸显的区域与农业灾害高发地带,农作物受灾问题对区域粮食安全及经济发展具有重要影响。基于2003—2023年黄河流域9省(区)的农作物受灾率数据,综合运用重心迁移-标准差椭圆、核密度估计、Dagum基尼系数以及时空地理加权回归(GTWR)模型来探究黄河流域农作物受灾的时空演变特征及致灾因子。结果表明:(1) 黄河流域农作物受灾率整体呈下降趋势。(2) 农作物受灾率重心始终位于上游和中游地区,反映出该区域是农作物受灾的主要承载区;核密度估计进一步揭示了上游地区内部差异加剧,中游地区内部差异较大,下游地区呈两极分化现象。Dagum基尼系数则表明农作物受灾率的总体差异较大,地区间差异是农作物受灾率总体差异的主要来源。(3) 黄河流域农作物受灾率的主要致灾因子包括年均降水量、森林覆盖率和坡度,其中坡度主要呈正向影响,年均降水量、森林覆盖率均呈负向影响。研究结果可为黄河流域精准制定防灾减灾策略、优化农业布局、保障粮食安全提供科学依据,助力黄河流域实现生态保护与高质量发展目标。
李晓鹏, 贾富贵, 雷双, 李康. 黄河流域农作物受灾时空演变特征及致灾因子[J]. 干旱区地理, 2026, 49(9): 1815-1825.
LI Xiaopeng, JIA Fugui, LEI Shuang, LI Kang. Spatiotemporal evolution characteristics and disaster-inducing factors of crop disasters in the Yellow River Basin[J]. Arid Land Geography, 2026, 49(9): 1815-1825.
图1
研究区示意图 注:基于自然资源部标准地图服务网站审图号为GS(2024)0650号的标准地图制作,底图边界无修改。下同。"
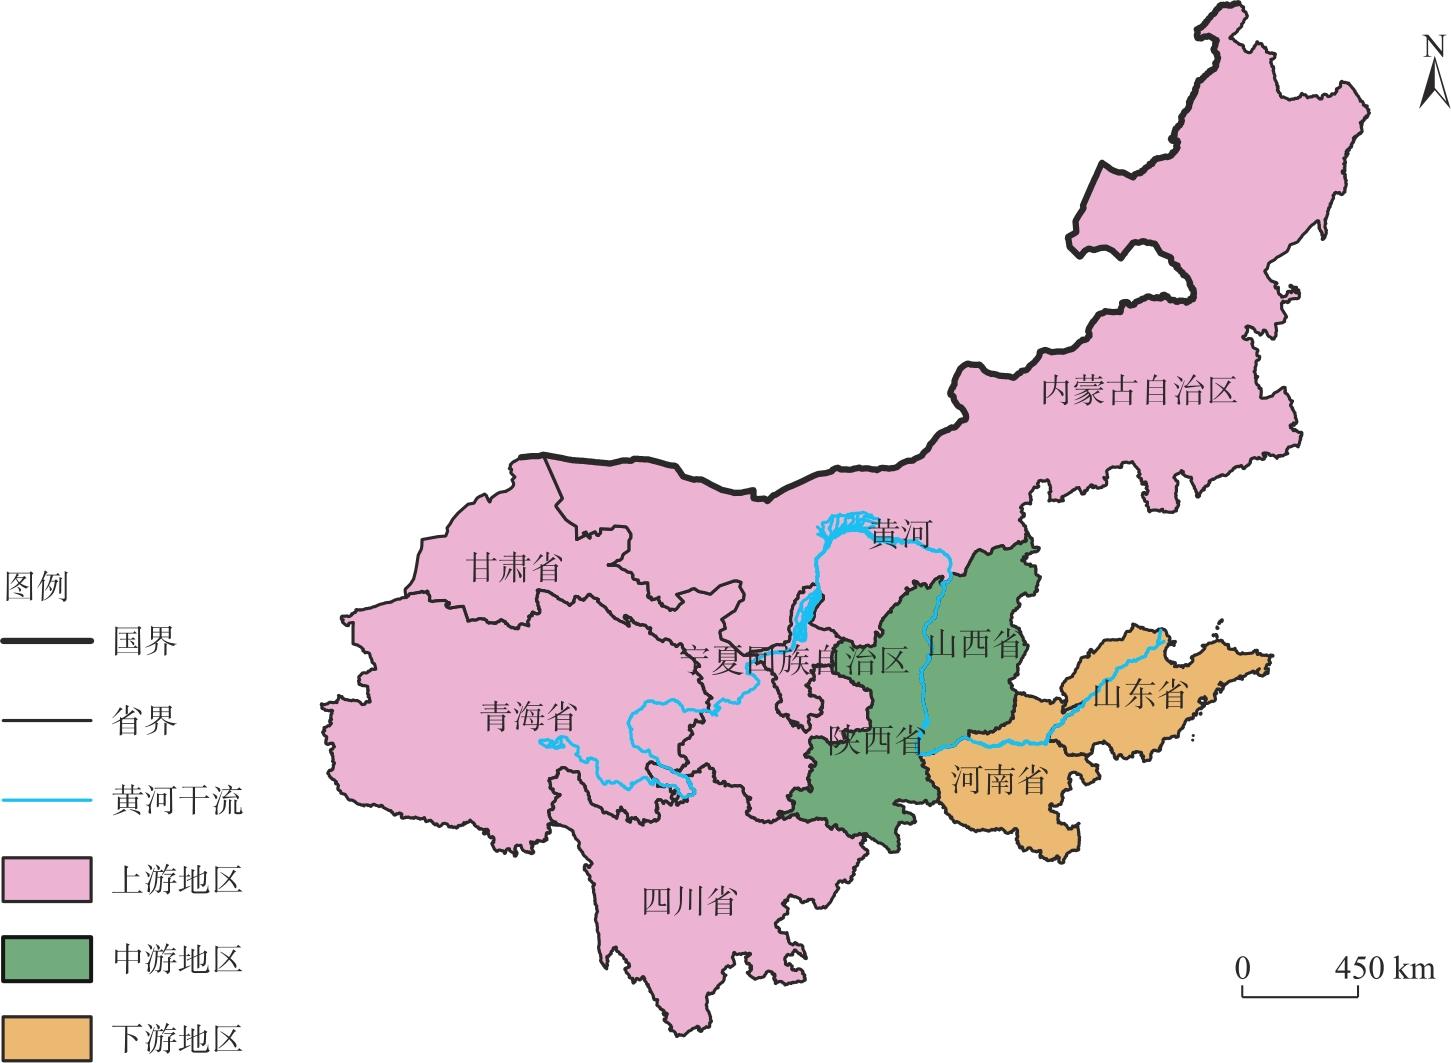
图2
2003—2023年黄河流域农作物受灾率的年际变化"
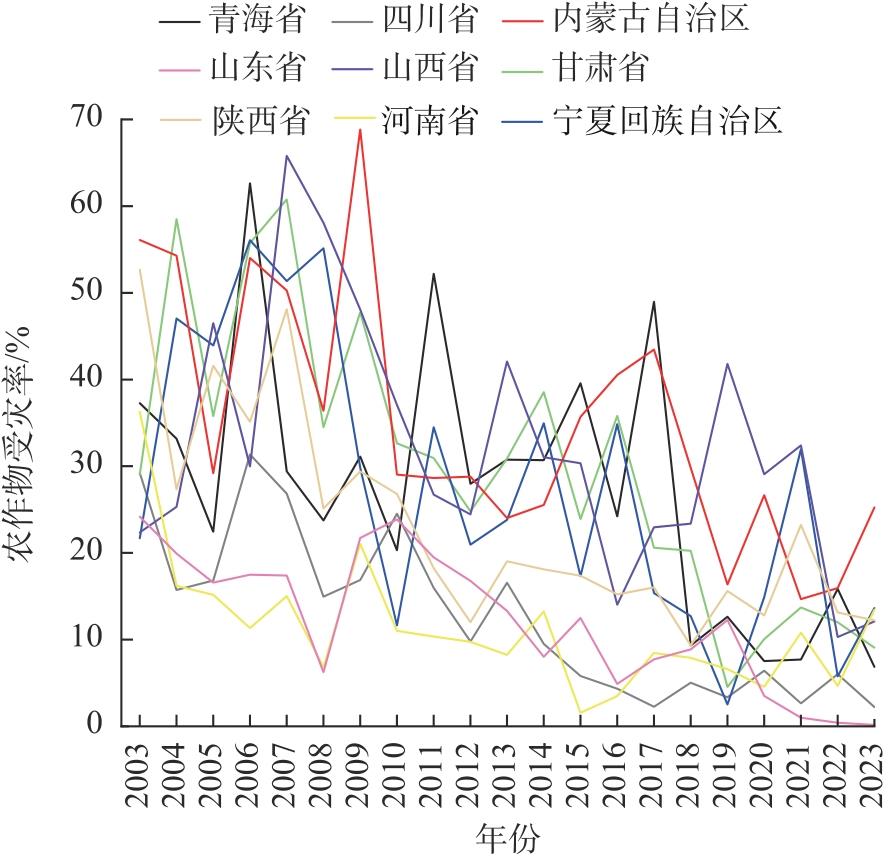
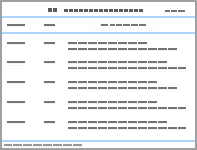
表1
2003—2023年黄河流域农作物受灾率重心迁移与标准差椭圆参数变化"
| 年份 | 面积/km2 | 重心经度坐标/E | 重心纬度坐标/N | 长轴标准差/km | 短轴标准差/km | 方位角/(°) |
|---|---|---|---|---|---|---|
| 2003 | 2487364.82 | 108°12′39″ | 37°00′10″ | 1139.95 | 694.60 | 63.53 |
| 2006 | 2187929.48 | 105°57′14″ | 37°15′57″ | 1156.14 | 602.44 | 65.59 |
| 2009 | 2342105.75 | 108°20′20″ | 37°58′54″ | 1136.42 | 656.07 | 63.54 |
| 2012 | 2359789.13 | 107°25′28″ | 37°32′34″ | 1196.27 | 627.96 | 71.06 |
| 2015 | 2248888.71 | 106°46′15″ | 37°57′41″ | 1250.20 | 572.64 | 68.08 |
| 2018 | 2241325.94 | 108°51′27″ | 38°18′14″ | 1099.77 | 648.76 | 62.92 |
| 2021 | 1403005.99 | 108°22′06″ | 37°20′54″ | 845.88 | 528.00 | 69.18 |
| 2023 | 2101323.99 | 109°06′47″ | 38°14′37″ | 1035.23 | 646.15 | 51.73 |
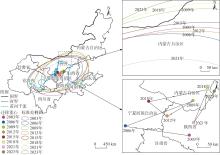
图3
2003—2023年黄河流域农作物受灾率重心迁移路径及标准差椭圆"
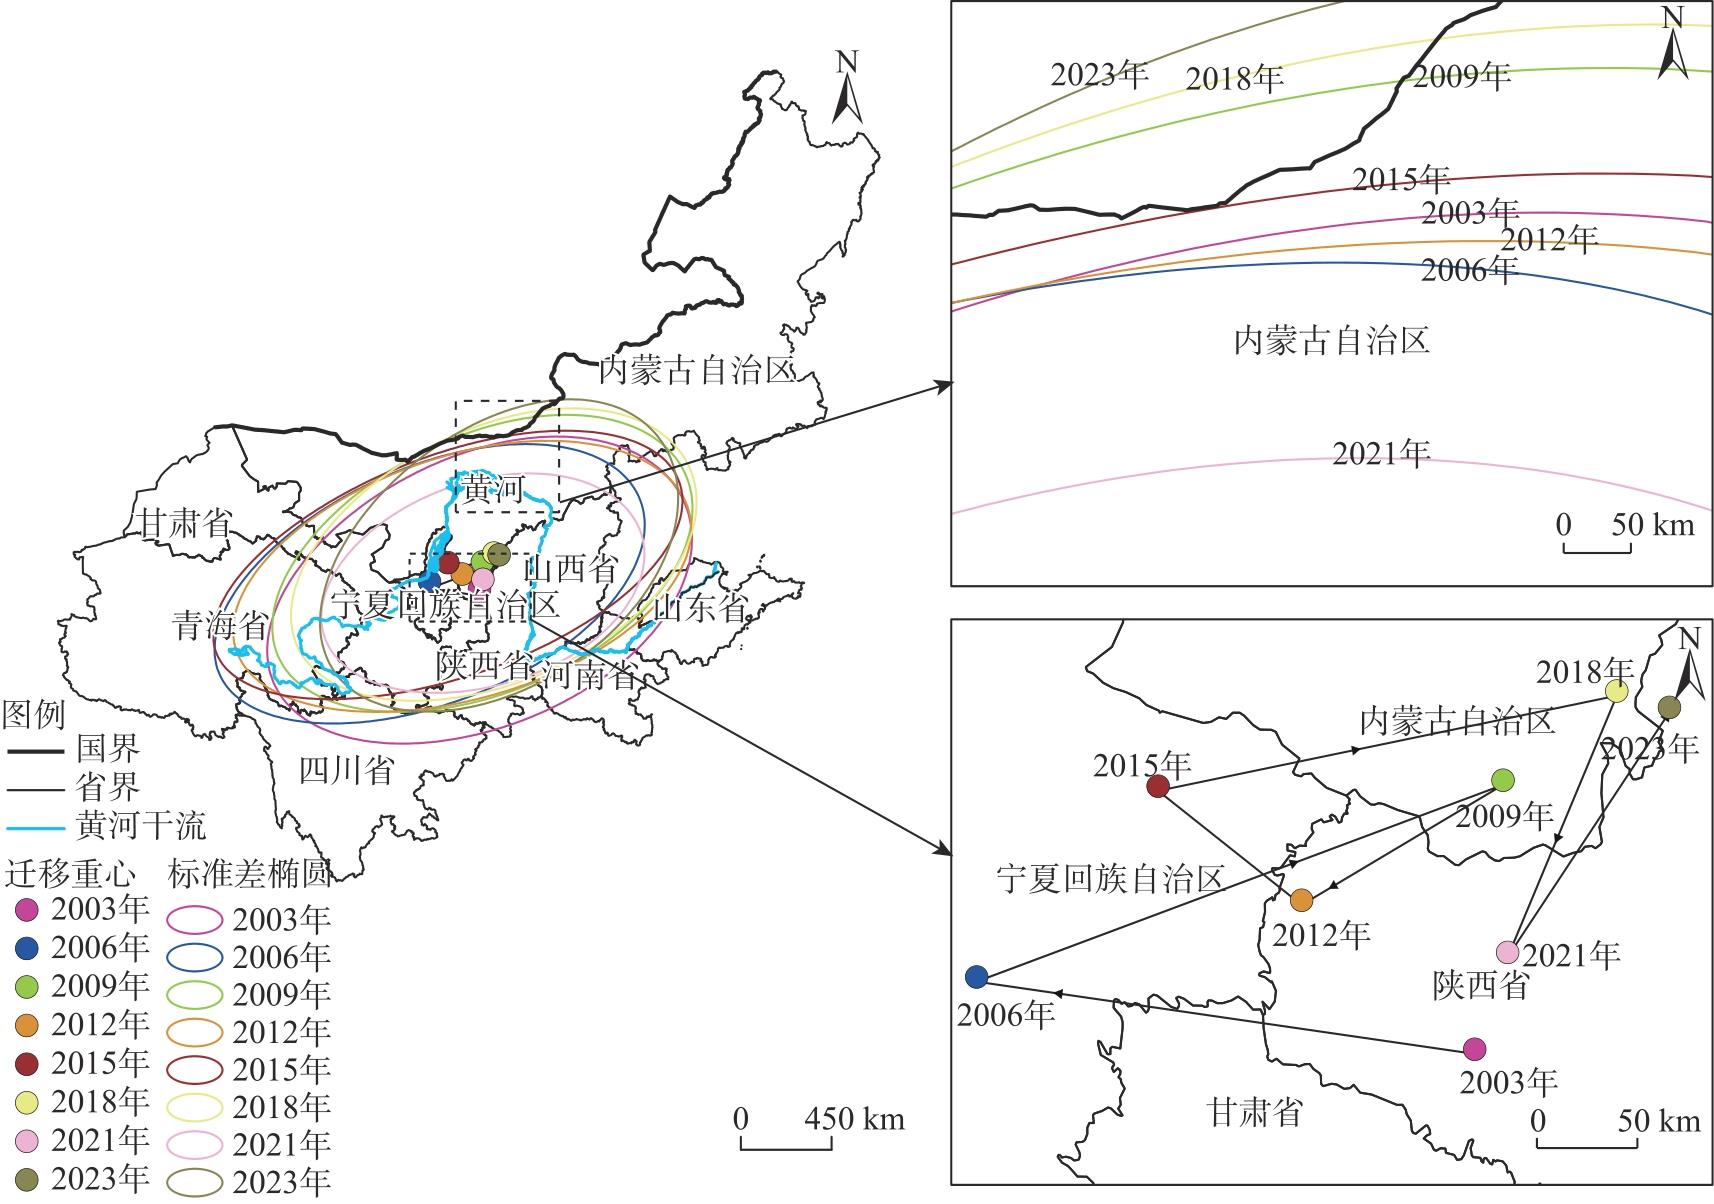
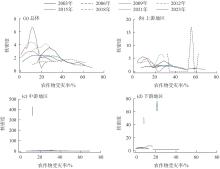
图4
2003—2023年黄河流域农作物受灾率的核密度估计结果"
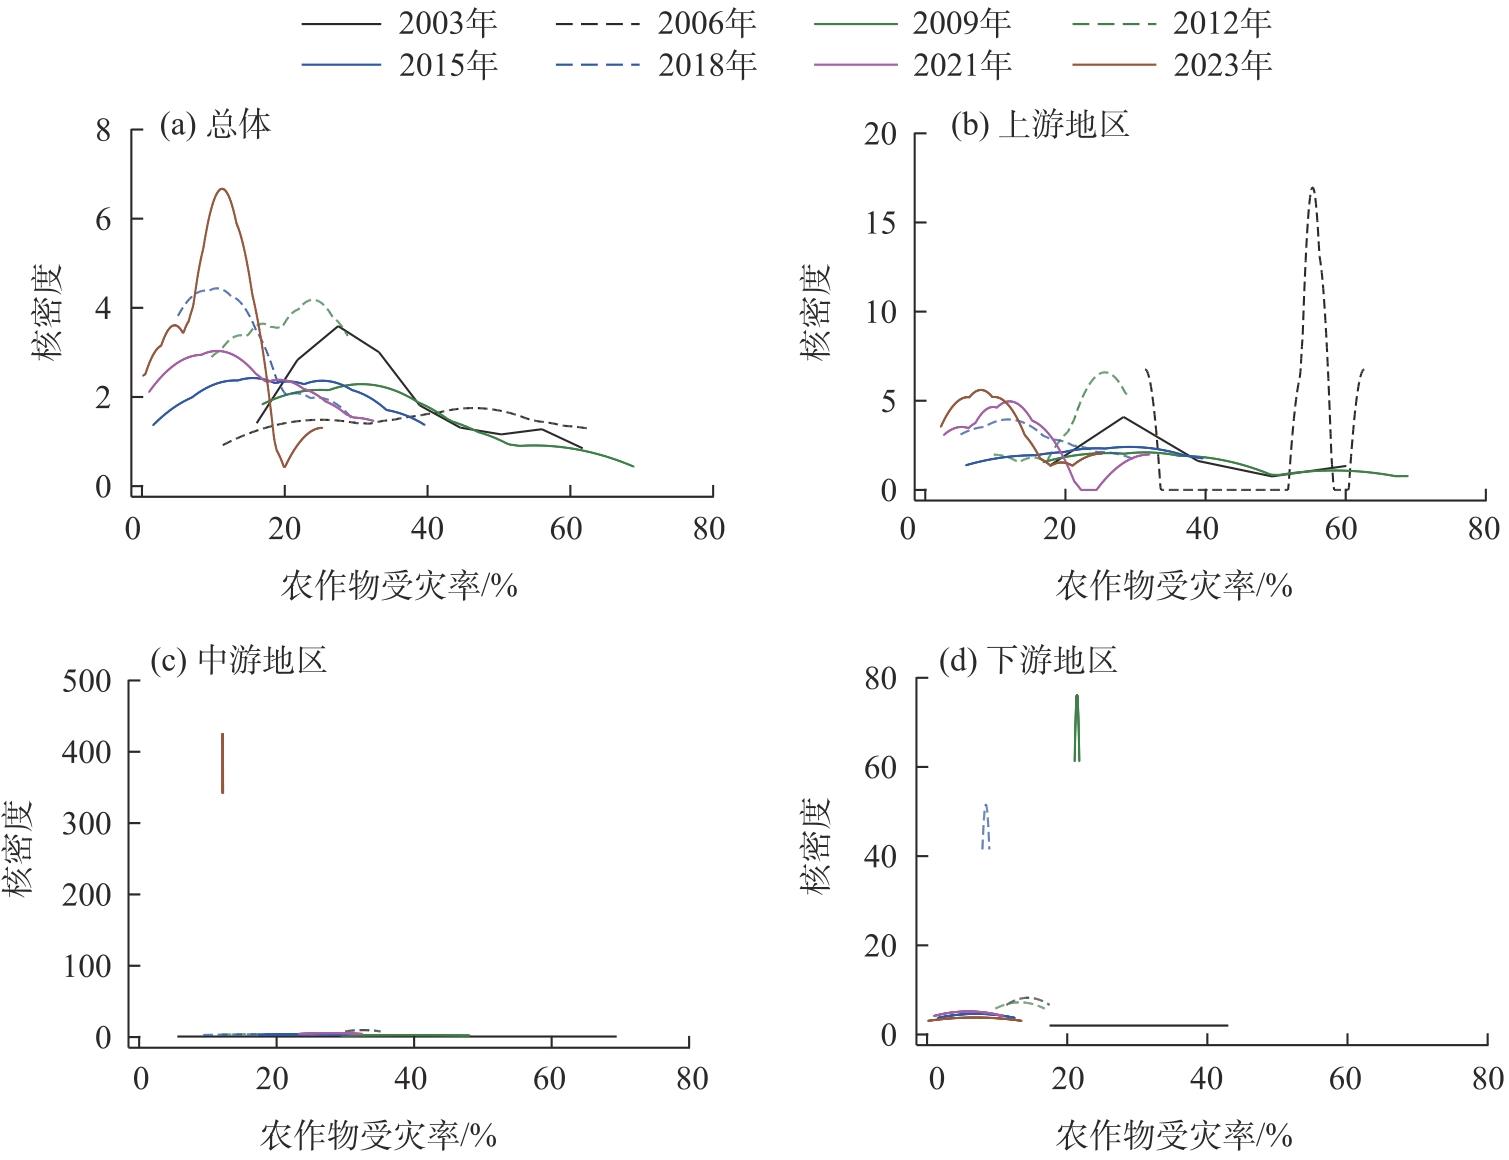
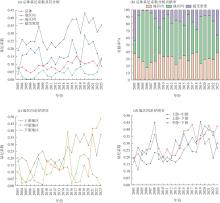
图5
2003—2023年黄河流域农作物受灾率的地区差异演变"

表2
2003—2023年黄河流域农作物受灾率时空地理加权回归(GTWR)模型解释变量共线性诊断"
| 指标 | 共线性诊断 | |
|---|---|---|
| 显著性 | 方差膨胀因子(VIF) | |
| 年均降水量 | 0.003 | 5.661 |
| 森林覆盖率 | 0.001 | 4.890 |
| 海拔 | 0.001 | 5.920 |
| 坡度 | 0.001 | 7.063 |
| 水库数量 | 0.003 | 3.107 |
| 水土流失治理面积 | 0.734 | 1.957 |
表3
模型比较"
| 模型 | OLS | GWR | GTWR |
|---|---|---|---|
| AICc | -242.290 | -281.412 | -310.473 |
| R2 | 0.355 | 0.551 | 0.726 |
| 调整后R2 | - | 0.539 | 0.718 |
表4
2003—2023年黄河流域农作物受灾率GTWR模型解释变量回归系数的年际变化"
| 指标 | 2003年 | 2006年 | 2009年 | 2012年 | 2015年 | 2018年 | 2021年 | 2023年 |
|---|---|---|---|---|---|---|---|---|
| 年均降水量 | -0.00028 | -0.00053 | -0.00060 | -0.00026 | -0.00030 | -0.00020 | -0.00006 | -0.00003 |
| 森林覆盖率 | 0.00344 | -0.00082 | -0.00379 | -0.00423 | -0.00124 | -0.00048 | -0.00089 | 0.00090 |
| 海拔 | 0.00001 | -0.00005 | -0.00009 | -0.00003 | -0.00001 | 0.00003 | -0.00004 | -0.00002 |
| 坡度 | -0.00180 | 0.03088 | 0.04796 | 0.02457 | 0.01229 | 0.01310 | 0.01950 | 0.00723 |
| 水库数量 | -0.00002 | -0.00001 | -0.00001 | -0.00001 | -0.00001 | -0.00002 | -0.00002 | -0.00002 |
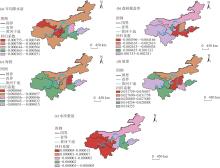
图6
2003—2023年黄河流域农作物受灾率致灾因子GTWR模型回归系数的空间异质性"

| [1] | 李晓鹏, 贾富贵, 李康, 等. 甘肃省农作物受灾率的时空演变特征及其影响因素[J]. 中国农业气象, 2026, 47(4): 603-615. |
|
[Li Xiaopeng, Jia Fugui, Li Kang, et al. Spatiotemporal evolution characteristics and influencing factors of crop disaster rates by meteorological disaster in Gansu Province[J]. Chinese Journal of Agrometeorology, 2026, 47(4): 603-615.]
doi: 10.3969/j.issn.1000-6362.2026.04.011 |
|
| [2] | 李贤, 王浩阳, 牛文浩, 等. 黄河流域耕地利用转型时空演变及其对粮食生产的影响[J]. 中国农业大学学报, 2024, 29(10): 85-96. |
| [Li Xian, Wang Haoyang, Niu Wenhao, et al. Spatial-temporal evolution of cultivated land use transition and its impact on grain production in the Yellow River Basin[J]. Journal of China Agricultural University, 2024, 29(10): 85-96.] | |
| [3] | 资添添, 刘静, 宣柯炀. 基于SWAT模型的黄河流域作物水足迹及虚拟水流动研究[J]. 灌溉排水学报, 2025, 44(2): 19-26. |
| [Zi Tiantian, Liu Jing, Xuan Keyang. Modelling crop water footprint and virtual water flow in the Yellow River Basin using the SWAT model[J]. Journal of Irrigation and Drainage, 2025, 44(2): 19-26.] | |
| [4] | 薛选登, 范晓婕, 谢清华. 农业水资源生态韧性时空演化及多尺度障碍因子分析——以黄河流域9省区为例[J]. 中国农业资源与区划, 2025, 46(2): 91-102. |
| [Xue Xuandeng, Fan Xiaojie, Xie Qinghua. Spatio-temporal evolution and multi-scale barrier factor analysis of ecological resilience of agricultural water resources: A case study of nine provinces in the Yellow River Basin[J]. Chinese Journal of Agricultural Resources and Regional Planning, 2025, 46(2): 91-102.] | |
| [5] | 占纪文, 郑思宁, 徐学荣. 农作物巨灾风险度量与分层测算[J]. 统计与决策, 2020, 36(3): 37-41. |
| [Zhan Jiwen, Zheng Sining, Xu Xuerong. Crop catastrophe risk measurement and its stratified calculation[J]. Statistics & Decision, 2020, 36(3): 37-41.] | |
| [6] | 秦鹏程, 周月华, 刘火胜, 等. 基于水动力模型的农作物暴雨洪涝灾害损失评估: 以江汉平原为例[J]. 中国农业气象, 2025, 46(3): 420-431. |
|
[Qin Pengcheng, Zhou Yuehua, Liu Huosheng, et al. Flood loss assessment for crops based on hydrodynamic modeling: A case study in the Jianghan Plain[J]. Chinese Journal of Agrometeorology, 2025, 46(3): 420-431.]
doi: 10.3969/j.issn.1000-6362.2025.03.013 |
|
| [7] | 金欣, 闫格, 李军乔, 等. 青海省春播期气候特征及主要气象灾害影响预估[J]. 干旱地区农业研究, 2025, 43(3): 270-277, 298. |
| [Jin Xin, Yan Ge, Li Junqiao, et al. Climatic characteristics and impact assessment of major meteorological disasters during the spring sowing period in Qinghai Province[J]. Agricultural Research in the Arid Areas, 2025, 43(3): 270-277, 298.] | |
| [8] | 张波, 罗阳欢, 李浪, 等. 贵州茶树春季低温灾害气候风险评估与区划[J]. 中国农业科技导报(中英文), 2025, 27(4): 230-238. |
| [Zhang Bo, Luo Yanghuan, Li Lang, et al. Climate risk assessment and zoning of spring low temperature disasters of tea trees in Guizhou[J]. Journal of Agricultural Science and Technology, 2025, 27(4): 230-238.] | |
| [9] | 伍红雨, 邹燕, 郭尧. 损失率评估模型在广东气象灾害损失评估中的应用[J]. 气象, 2023, 49(6): 757-764. |
| [Wu Hongyu, Zou Yan, Guo Xiao. Application of loss rate evaluation model in meteorological disaster loss evaluation in Guangdong[J]. Meteorological Monthly, 2023, 49(6): 757-764.] | |
| [10] | 李治国. 近40 a河南省农业气象灾害对粮食生产的影响研究[J]. 干旱区资源与环境, 2013, 27(5): 126-130. |
| [Li Zhiguo. Influence of agricultural meteorological disasters on grain production in Henan Province[J]. Journal of Arid Land Resources and Environment, 2013, 27(5): 126-130.] | |
| [11] | 于小兵, 陈虹, 吉中会, 等. 山东省农业气象灾害与主要农作物产量的灰色关联分析[J]. 灾害学, 2019, 34(3): 103-108. |
| [Yu Xiaobing, Chen Hong, Ji Zhonghui, et al. Gray correlation analysis of agricultural meteorological disasters and main crop yields in Shandong Province[J]. Journal of Catastrophology, 2019, 34(3): 103-108.] | |
| [12] | 高姣姣, 徐刚. 重庆市气象灾害与农作物单产的灰色关联度分析[J]. 西南大学学报(自然科学版), 2016, 38(2): 32-36. |
| [Gao Jiaojiao, Xu Gang. Gray correlation analysis of meteorological disasters and crop yield in Chongqing[J]. Journal of Southwest University (Natural Science Edition), 2016, 38(2): 32-36.] | |
| [13] | 李忠辉, 袁福香, 刘实, 等. 基于“Z指数”的吉林省雨涝灾害对农作物的影响评估[J]. 安全与环境学报, 2016, 16(1): 183-186. |
| [Li Zhonghui, Yuan Fuxiang, Liu Shi, et al. On the crop-harvest assessment with regard to the waterlog disasters in Jilin with “Z-index” method[J]. Journal of Safety and Environment, 2016, 16(1): 183-186.] | |
| [14] | 楚纯洁, 张小磊, 周金风. 1960-2018年河南省短周期旱涝急转事件演变特征[J]. 水土保持研究, 2023, 30(4): 275-285. |
| [Chu Chunjie, Zhang Xiaolei, Zhou Jinfeng. Evolution characteristics of short-period drought-flood abrupt alternation events in Henan Province from 1960 to 2018[J]. Research of Soil and Water Conservation, 2023, 30(4): 275-285.] | |
| [15] |
曹永强, 杨雪婷, 周姝含. 河北省夏玉米水足迹时空演变特征及影响因子分析[J]. 长江科学院院报, 2023, 40(2): 67-74, 80.
doi: 10.11988/ckyyb.20210993 |
| [Cao Yongqiang, Yang Xueting, Zhou Shuhan. Spatial and temporal evolution and influencing factors of water footprint of summer maize in Hebei Province[J]. Journal of Changjiang River Scientific Research Institute, 2023, 40(2): 67-74, 80.] | |
| [16] | 何延波, 李祎君, 张艳红, 等. 2025年夏季气象条件对农业生产的影响[J]. 中国农业气象, 2025, 46(12): 1836-1838. |
|
[He Yanbo, Li Yijun, Zhang Yanhong, et al. Reports on weather impacts to agricultural production in summer 2025[J]. Chinese Journal of Agrometeorology, 2025, 46(12): 1836-1838.]
doi: 10.3969/j.issn.1000-6362.2025.12.014 |
|
| [17] | 于水, 张晓龙, 王妍, 等. 气候变化对中国东北三省主要粮食作物影响研究综述[J]. 中国生态农业学报(中英文), 2024, 32(6): 970-985. |
| [Yu Shui, Zhang Xiaolong, Wang Yan, et al. Review of research on the impacts of climate change on staple grain crops in the three provinces of northeast China[J]. Chinese Journal of Eco-Agriculture, 2024, 32(6): 970-985.] | |
| [18] | 孔冬艳, 陈会广. 近40年来中国农作物与耕地受灾时空特征及影响因素分析[J]. 长江流域资源与环境, 2020, 29(5): 1236-1246. |
| [Kong Dongyan, Chen Huiguang. An analysis of spatial-temporal characteristics and influencing factors for China’s crop and cropland suffered natural disaster in recent 40 years[J]. Resources and Environment in the Yangtze Basin, 2020, 29(5): 1236-1246.] | |
| [19] |
程鹏, 彭海洋, 侯丁榕, 等. 黄河流域农业灰水足迹强度空间格局及演进趋势[J]. 干旱区地理, 2025, 48(7): 1185-1197.
doi: 10.12118/j.issn.1000-6060.2024.473 |
|
[Cheng Peng, Peng Haiyang, Hou Dingrong, et al. Spatial pattern and evolution trend of agricultural grey water footprint intensity in the Yellow River Basin[J]. Arid Land Geography, 2025, 48(7): 1185-1197.]
doi: 10.12118/j.issn.1000-6060.2024.473 |
|
| [20] |
李梦冉, 徐小任, 王梁, 等. 黄河流域农业碳排放时空变化特征及影响因素分析[J]. 干旱区地理, 2025, 48(5): 854-865.
doi: 10.12118/j.issn.1000-6060.2024.401 |
|
[Li Mengran, Xu Xiaoren, Wang Liang, et al. Spatial-temporal characteristics and influencing factors of agricultural carbon emissions in the Yellow River Basin[J]. Arid Land Geography, 2025, 48(5): 854-865.]
doi: 10.12118/j.issn.1000-6060.2024.401 |
|
| [21] | 马志超. 黄河流域农业碳排放与经济增长时空耦合关系研究[J]. 中国农业资源与区划, 2024, 45(12): 15-26. |
| [Ma Zhichao. Spatio-temporal coupling relationship between agricultural carbon emission and economic growth in the Yellow River Basin[J]. Chinese Journal of Agricultural Resources and Regional Planning, 2024, 45(12): 15-26.] | |
| [22] | 杨宗辉, 李金锴, 韩晨雪, 等. 我国粮食生产重心变迁及其影响因素研究[J]. 农业现代化研究, 2019, 40(1): 36-43. |
| [Yang Zonghui, Li Jinkai, Han Chenxue, et al. The evolution path of China’s grain production base and the influencing factors[J]. Research of Agricultural Modernization, 2019, 40(1): 36-43.] | |
| [23] |
刘宝涛. 京津冀城市群建设用地转型的时空演化与驱动因素[J]. 世界地理研究, 2025, 34(7): 98-111.
doi: 10.3969/j.issn.1004-9479.2025.07.20230744 |
|
[Liu Baotao. Spatial-temporal evolution and driving factors of construction land transformation in the Beijing-Tianjin-Hebei urban agglomeration[J]. World Regional Studies, 2025, 34(7): 98-111.]
doi: 10.3969/j.issn.1004-9479.2025.07.20230744 |
|
| [24] |
Kumar S, Russell R. Technological change, technological catch-up, and capital deepening: Relative contributions to growth and convergence[J]. The American Economic Review, 2002, 92(3): 527-548.
doi: 10.1257/00028280260136381 |
| [25] | 向云, 李芷萱, 陆倩. 中国农业经济高质量发展的空间非均衡及收敛性[J]. 中国农业大学学报, 2022, 27(11): 305-316. |
| [Xiang Yun, Li Zhixuan, Lu Qian. Spatial disequilibrium and convergence of high quality development of agricultural economy in China[J]. Journal of China Agricultural University, 2022, 27(11): 305-316.] | |
| [26] | 张军涛, 韩祁祺. 黄河流域农业碳排放时空演变特征及影响因素研究[J]. 环境科学研究, 2025, 38(4): 754-766. |
| [Zhang Juntao, Han Qiqi. Spatiotemporal evolution characteristics and influencing factors of agricultural carbon emissions in the Yellow River Basin[J]. Research of Environmental Sciences, 2025, 38(4): 754-766.] | |
| [27] |
刘艺欣, 裴婷婷, 陈英, 等. 基于县域尺度的甘肃省乡村振兴发展水平测度及时空分异[J]. 干旱区地理, 2025, 48(9): 1683-1693.
doi: 10.12118/j.issn.1000-6060.2024.545 |
|
[Liu Yixin, Pei Tingting, Chen Ying, et al. Measurement and spatial-temporal differentiation of rural revitalization development level in Gansu Province based on county scale[J]. Arid Land Geography, 2025, 48(9): 1683-1693.]
doi: 10.12118/j.issn.1000-6060.2024.545 |
|
| [28] |
Huang B, Wu B, Barry M. Geographically and temporally weighted regression for modeling spatio-temporal variation in house prices[J]. International Journal of Geographical Information Science, 2010, 24(3): 383-401.
doi: 10.1080/13658810802672469 |
| [29] | 姚寿福. 我国农业资金投入对抗灾能力的效应分析[J]. 农业现代化研究, 2012, 33(2): 161-165. |
| [Yao Shoufu. An analysis of effects of agricultural investments on anti-disaster ability in China[J]. Research of Agricultural Modernization, 2012, 33(2): 161-165.] | |
| [30] | 杨建利, 邹雨潼, 宋大威. 黄河流域农业高质量发展水平测度、地区差异及动态演进[J]. 中国农业资源与区划, 2024, 45(10): 212-227. |
| [Yang Jianli, Zou Yutong, Song Dawei. The measurement and regional difference and dynamic evolution of high-quality development of agriculture in the Yellow River Basin[J]. Chinese Journal of Agricultural Resources and Regional Planning, 2024, 45(10): 212-227.] | |
| [31] | 周帅, 王义民, 畅建霞, 等. 黄河流域干旱时空演变的空间格局研究[J]. 水利学报, 2019, 50(10): 1231-1241. |
| [Zhou Shuai, Wang Yimin, Chang Jianxia, et al. Research on spatio-temporal evolution of drought patterns in the Yellow River Basin[J]. Journal of Hydraulic Engineering, 2019, 50(10): 1231-1241.] | |
| [32] | 王培培, 柴洪. 黄河流域数字普惠金融对农业绿色发展的影响研究[J]. 人民黄河, 2025, 47(4): 22-27. |
| [Wang Peipei, Chai Hong. Research on impact of digital inclusive finance in the Yellow River Basin on the green development of agriculture[J]. Yellow River, 2025, 47(4): 22-27.] |
| [1] | 毕文焌, 闫庆武, 赵甫心, 移明昊, 吴子豪. 基于XGBoost-SHAP方法的天山中段景观生态风险时空演变及驱动因素[J]. 干旱区地理, 2026, 49(9): 1826-1839. |
| [2] | 焦视堂, 颜洋, 郑江华, 何莹, 巴比尔江·迪力夏提, 魏建新, 刘俊豪, 折勇睿. 新疆风电场对生态环境的影响特征及其驱动因素分析[J]. 干旱区地理, 2026, 49(9): 1840-1854. |
| [3] | 徐庆迪, 杨清. 黄河流域粮食生产韧性与水资源承载力时空耦合、演变轨迹及驱动因素[J]. 干旱区地理, 2026, 49(9): 1940-1950. |
| [4] | 罗庆, 臧永婷, 王云龙, 王山冰, 刘乐. 黄河流域乡镇人口分布格局的演变特征及其驱动机制[J]. 干旱区地理, 2026, 49(8): 1711-1723. |
| [5] | 王紫洋, 夏咏, 王福红, 丁宁, 吕毅, 苏泽琛. 新疆县域耕地利用生态效率时空演变及驱动因素[J]. 干旱区地理, 2026, 49(7): 1385-1394. |
| [6] | 李灵灵, 任君, 李成英, 王淑琦, 陈瑞, 文硕. 青藏高寒区自然资本可持续利用时空分异特征及驱动因素——以青海省为例[J]. 干旱区地理, 2026, 49(7): 1418-1429. |
| [7] | 李文君, 张维梅. 中国数字经济与共同富裕的耦合协调关系及时空演进趋势[J]. 干旱区地理, 2026, 49(7): 1481-1492. |
| [8] | 高莹, 周可丽, 元媛, 史薪茹, 吴佳霖. 黄河流域旅游经济与居民福祉耦合协调时空演变及驱动机制研究[J]. 干旱区地理, 2026, 49(7): 1493-1508. |
| [9] | 马小雯, 郭精军, 谢雁. 新质生产力对黄河流域城市绿色发展的赋能效应研究[J]. 干旱区地理, 2026, 49(6): 1238-1248. |
| [10] | 李文美, 吴新年, 任珩, 李娜, 张晶. 基于文献计量的黄河流域生态环境研究态势分析[J]. 干旱区地理, 2026, 49(5): 928-938. |
| [11] | 何家豪, 侯光良, 敖民, 唐中华, 石洪飞. 基于MaxEnt的青藏高原细石器人群时空分布演变研究[J]. 干旱区地理, 2026, 49(5): 987-997. |
| [12] | 卢雅焱, 封甜, 杨兆萍, 韩芳, 贾莹莹. 中国省域新质生产力与旅游高质量发展适配度时空演变及障碍因子研究[J]. 干旱区地理, 2026, 49(4): 643-655. |
| [13] | 关靖云, 孙之阳, 徐晓亮, 程乙峰, 宋贝贝, 房瑞莹. 气候变化背景下中国新疆与中亚五国旅游气候舒适度时空演变分析[J]. 干旱区地理, 2026, 49(4): 697-712. |
| [14] | 陈文宣, 陈钰, 王生隆. 黄河流域农业碳排放时空演化特征及其影响因素分析[J]. 干旱区地理, 2026, 49(4): 713-726. |
| [15] | 郝晓燕, 李玥蓉, 吴月. 黄河流域物流业全要素碳生产率测度及影响因素——基于能源禀赋差异视角[J]. 干旱区地理, 2026, 49(4): 756-768. |
|
||