干旱区地理 ›› 2026, Vol. 49 ›› Issue (8): 1711-1723.doi: 10.12118/j.issn.1000-6060.2025.486 cstr: 32274.14.ALG2025486
罗庆1,2,3( ), 臧永婷1,2,3, 王云龙1,2,3, 王山冰1,2,3, 刘乐1,2,3
收稿日期:2025-08-21
修回日期:2025-09-04
出版日期:2026-08-25
发布日期:2026-08-21
作者简介:罗庆(1981-),男,博士,教授,博士生导师,主要从事城乡发展与规划等方面的研究. E-mail: luoqing518@163.com
基金资助:
LUO Qing1,2,3(), ZANG Yongting1,2,3, WANG Yunlong1,2,3, WANG Shanbing1,2,3, LIU Le1,2,3
Received:2025-08-21
Revised:2025-09-04
Published:2026-08-25
Online:2026-08-21
摘要:
精细尺度的人口变化分析对深入理解人地系统耦合机制、优化区域发展政策具有重要的理论与实践意义。基于第五、六、七次全国人口普查数据,综合运用GIS空间分析、标准差椭圆和地理探测器等方法,系统解析2000—2020年黄河流域乡镇人口空间分布格局的演变特征及其驱动机制。结果表明:(1) 黄河流域乡镇人口密度分布呈现东部高、西部低的格局,与经济发展水平的分布格局相吻合。研究期内乡镇人口收缩明显,有5530个乡镇处于人口收缩状态,占乡镇总数量的59.89%。(2) 人口分布存在较强的空间自相关效应。研究期内“高-高”型乡镇有935个,“低-低”型乡镇有2406个;人口增长热点区呈现“由北向南、由东向西”的扩展趋势;人口增长冷点区形成稳定的“中部塌陷”格局。人口分布重心在山西晋城市,并呈现向北部方向缓慢迁移的特征。(3) 地理探测器分析揭示,自然地理、社会经济和地理区位因素的协同作用是塑造黄河流域乡镇人口分布格局的关键机制,其中自然地理因素和地理区位因素之间的协同效应更强。不同区域的主导影响因素存在差异,人均耕地面积对人口分布的约束效应最为显著。
罗庆, 臧永婷, 王云龙, 王山冰, 刘乐. 黄河流域乡镇人口分布格局的演变特征及其驱动机制[J]. 干旱区地理, 2026, 49(8): 1711-1723.
LUO Qing, ZANG Yongting, WANG Yunlong, WANG Shanbing, LIU Le. Evolutionary characteristics and driving mechanisms of population distribution patterns in townships along the Yellow River Basin[J]. Arid Land Geography, 2026, 49(8): 1711-1723.
图1
2000—2020年黄河流域乡镇人口密度分布 注:基于自然资源部标准地图服务网站审图号为GS(2024)0650号的标准地图制作,底图边界无修改。下同。"
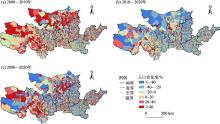
图2
2000—2020年黄河流域乡镇人口增长分布"
图3
2000—2020年黄河流域乡镇人口分布LISA图"
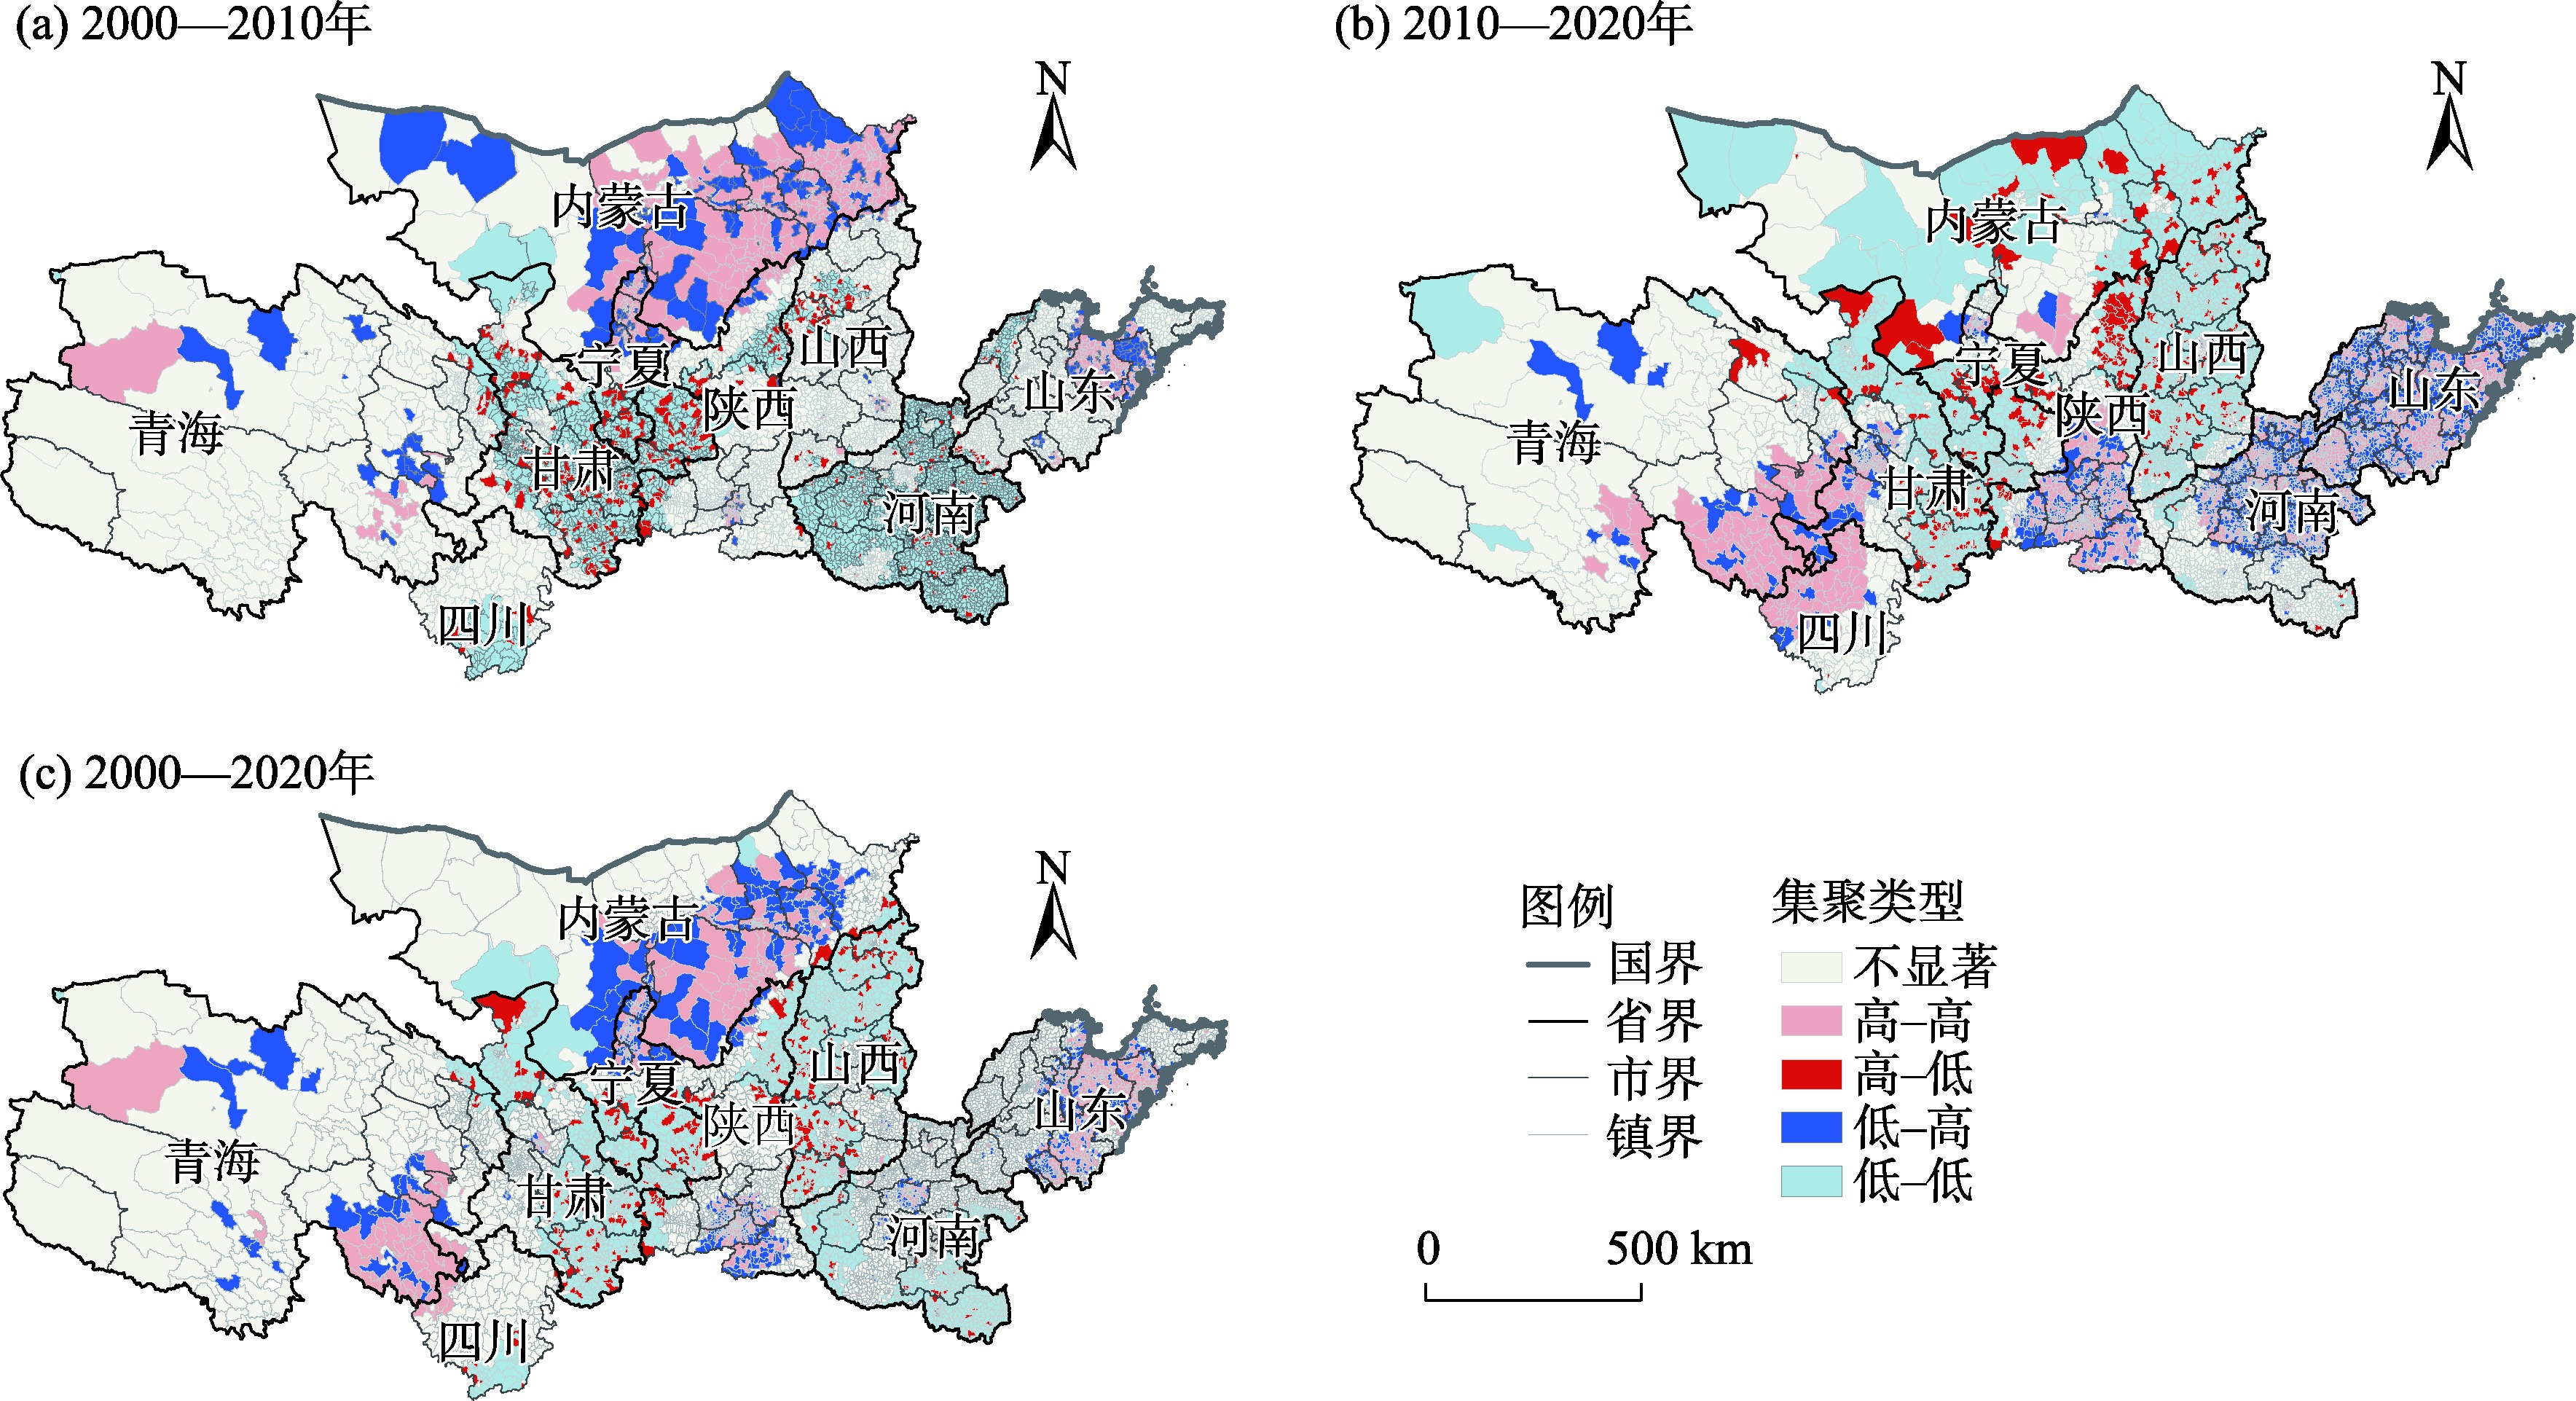
图4
2000—2020年黄河流域乡镇人口分布迁移特征"
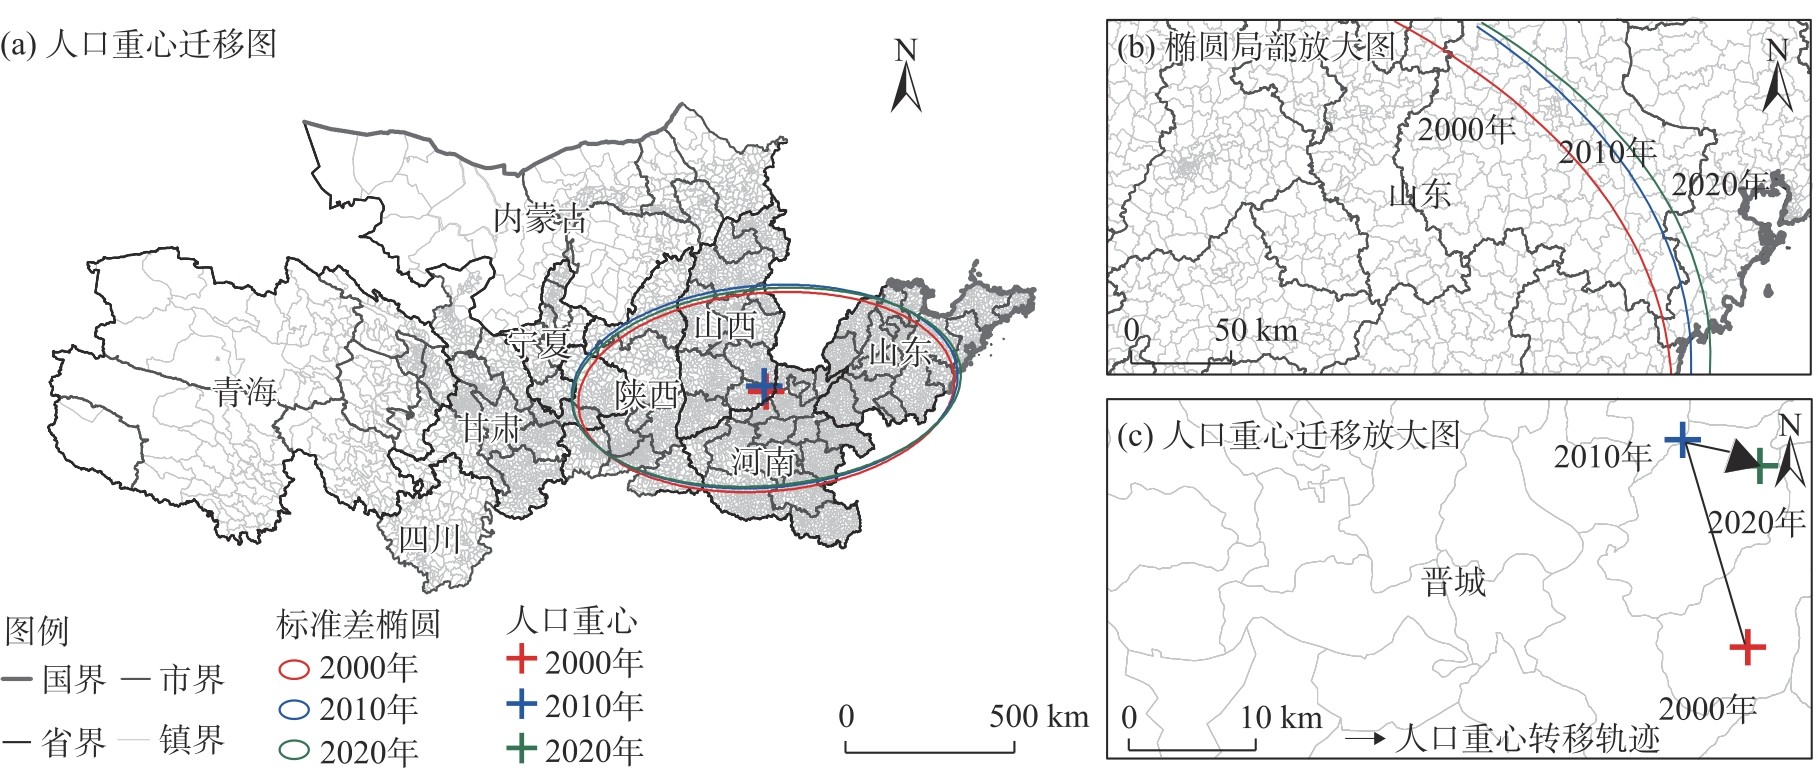
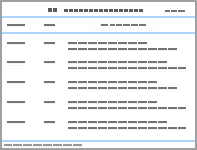
表1
黄河流域乡镇人口分布影响因素指标构建"
| 变量类型 | 编号 | 指标名称 | 指标含义 |
|---|---|---|---|
| 被解释变量 | Y | 人口密度 | 乡镇常住人口/乡镇土地面积 |
| 自然地理 | X1 | 高程 | 乡镇区域平均海拔 |
| X2 | 温度 | 乡镇地表温度年平均值 | |
| X3 | 降雨量 | 乡镇地表降雨量年平均值 | |
| X4 | 河网密度 | 乡镇内干支流总河长/乡镇面积 | |
| 社会经济 | X5 | 夜间灯光指数 | 乡镇内灯光亮度镇 |
| X6 | 村庄密度 | 乡镇内村庄核密度值 | |
| X7 | 路网密度 | 乡镇内所有道路总长/乡镇面积 | |
| X8 | 人均耕地面积 | 乡镇区域内耕地面积/区域内总人口 | |
| 地理区位 | X9 | 到县政府距离 | 各乡镇到最近县政府的距离 |
| X10 | 到市政府距离 | 各乡镇到最近市政府的距离 |
表2
黄河流域乡镇人口分布影响因子探测结果"
| 指标 | 2000年 | 2010年 | 2020年 | |||||
|---|---|---|---|---|---|---|---|---|
| q值 | 排序 | q值 | 排序 | q值 | 排序 | |||
| 高程 | 0.407*** | 7 | 0.363*** | 6 | 0.250** | 6 | ||
| 温度 | 0.338*** | 9 | 0.335** | 7 | 0.152** | 9 | ||
| 降雨量 | 0.354* | 8 | 0.276* | 9 | 0.239* | 8 | ||
| 河网密度 | 0.110* | 10 | 0.114* | 10 | 0.079* | 10 | ||
| 夜间灯光指数 | 0.493** | 6 | 0.277** | 8 | 0.240** | 7 | ||
| 村庄密度 | 0.494* | 5 | 0.575** | 4 | 0.688** | 4 | ||
| 路网密度 | 0.514* | 4 | 0.435** | 5 | 0.744*** | 2 | ||
| 人均耕地面积 | 0.786*** | 1 | 0.698*** | 1 | 0.821*** | 1 | ||
| 到县政府距离 | 0.584*** | 3 | 0.578*** | 3 | 0.591*** | 5 | ||
| 到市政府距离 | 0.662*** | 2 | 0.695*** | 2 | 0.735*** | 3 | ||
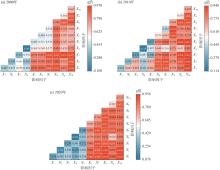
图5
2000—2020年黄河流域人口分布影响因子的交互作用 注:X1为高程;X2为温度;X3为降雨量;X4为河网密度;X5为夜间灯光指数;X6为村庄密度;X7为路网密度;X8为人均耕地面积;X9为到县政府距离;X10为到市政府距离;q值为解释力。下同。"
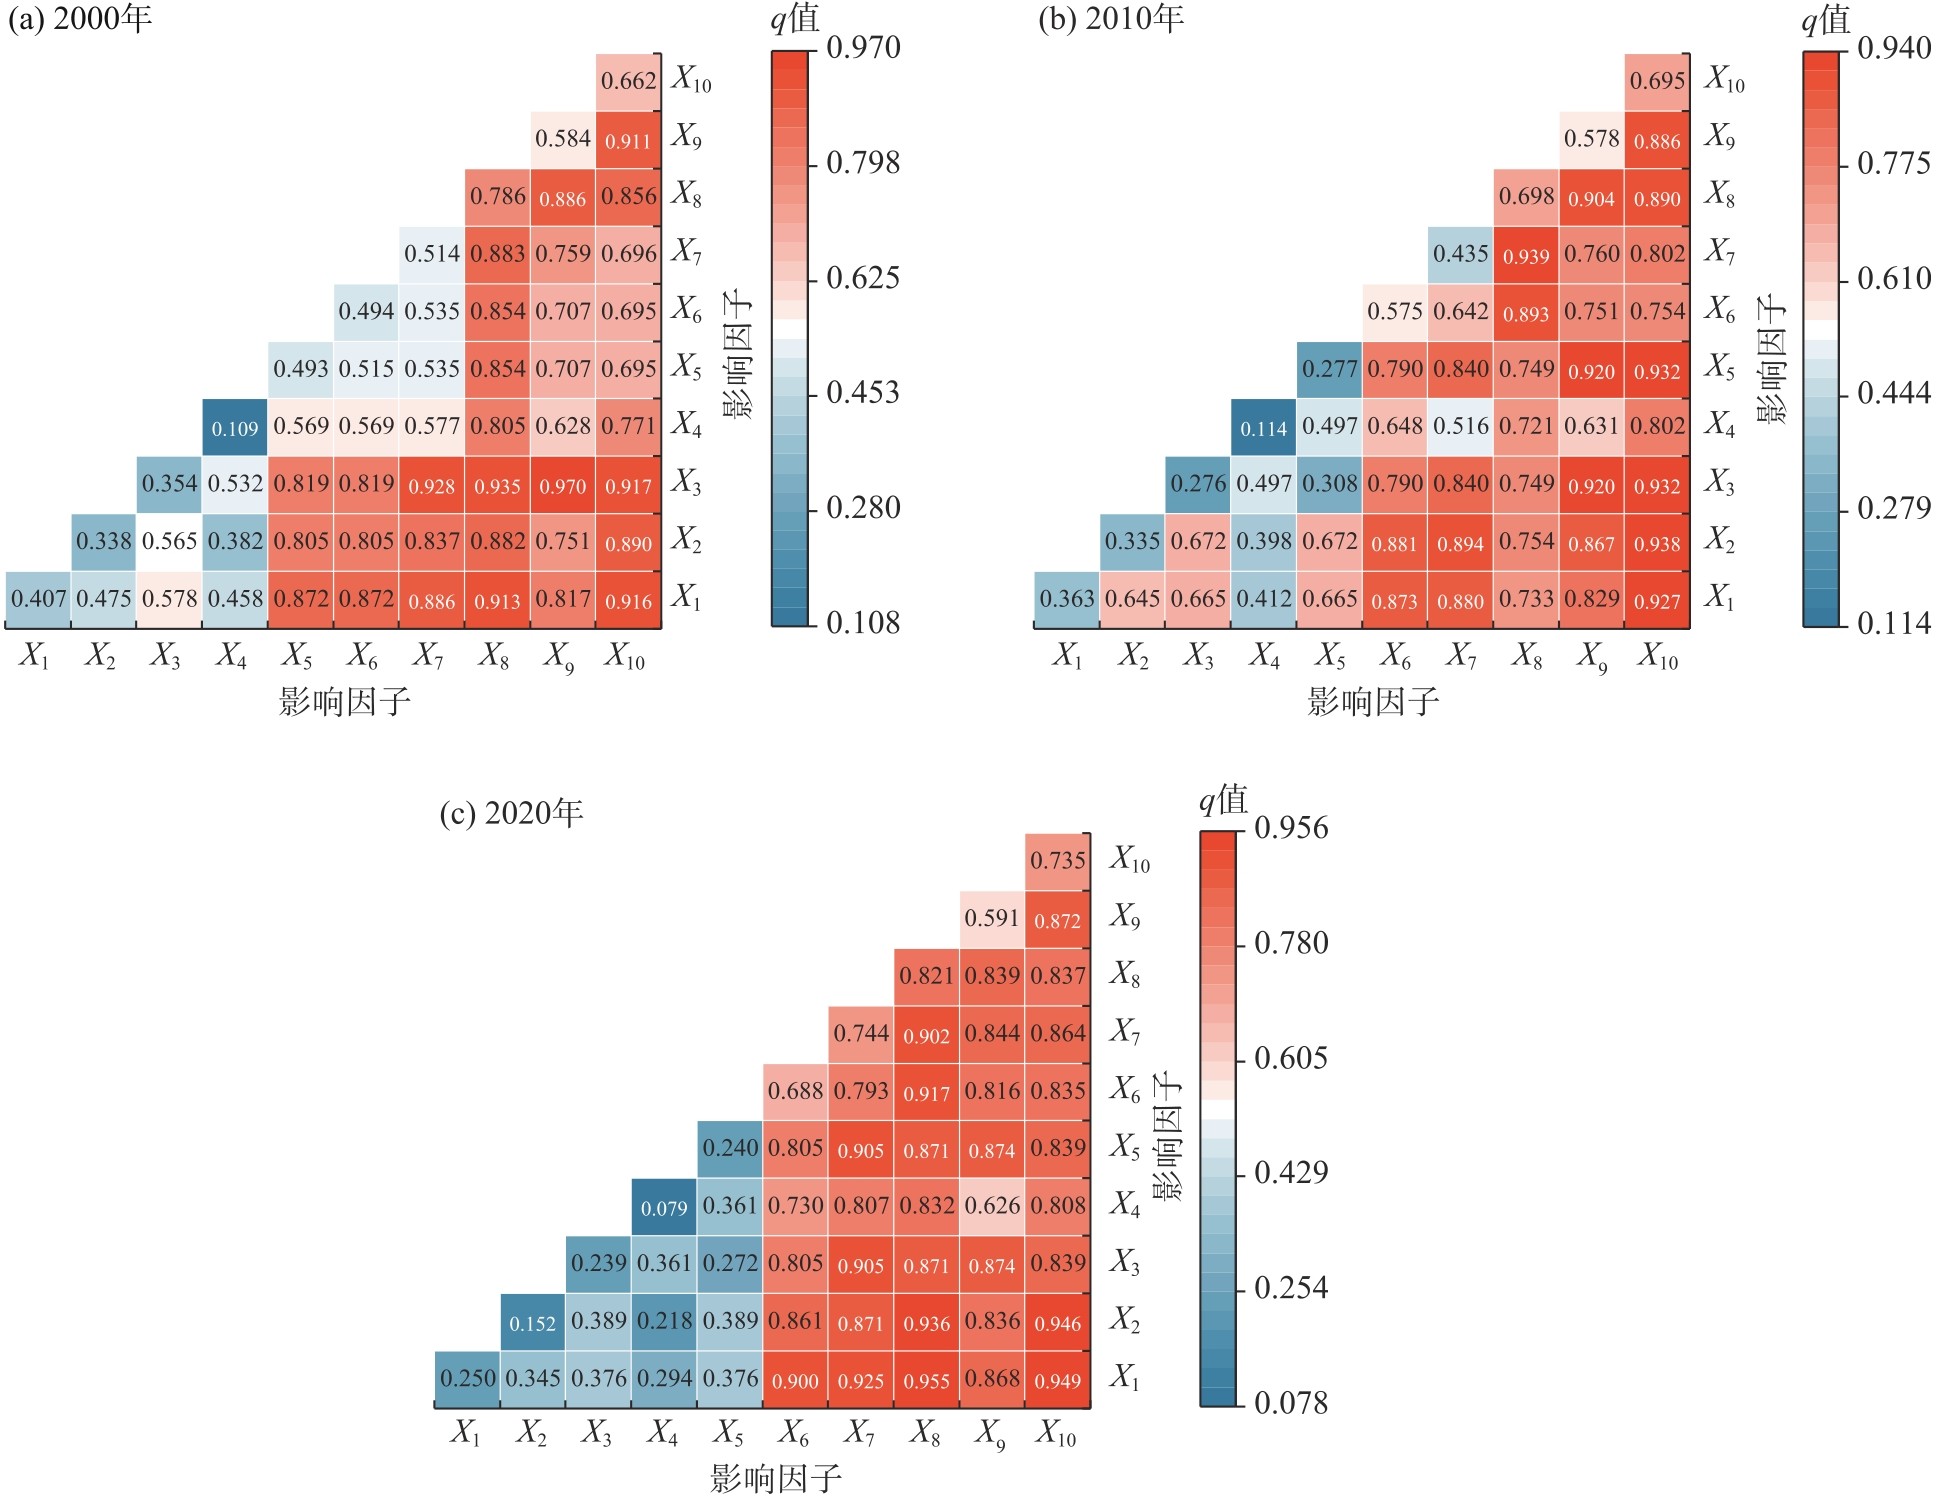
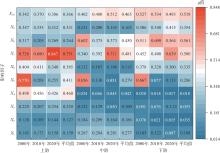
图6
2000—2020年黄河流域上中下游影响因子贡献率"
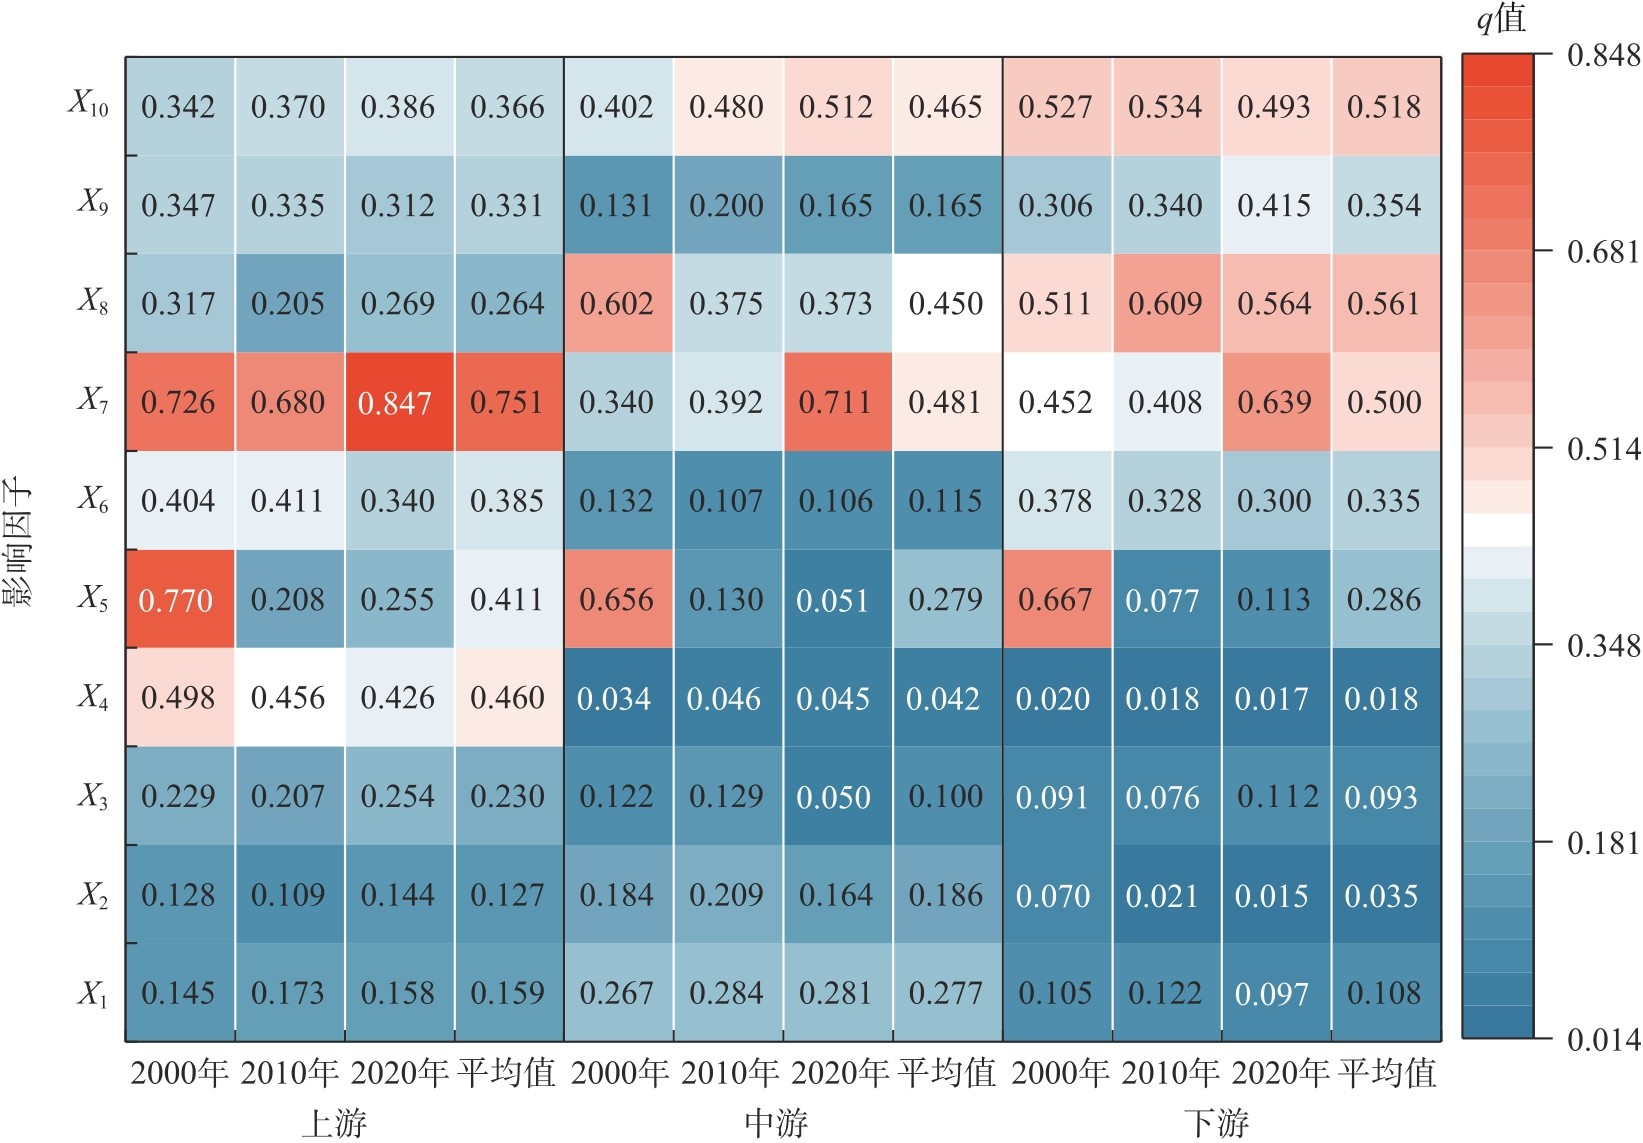
图7
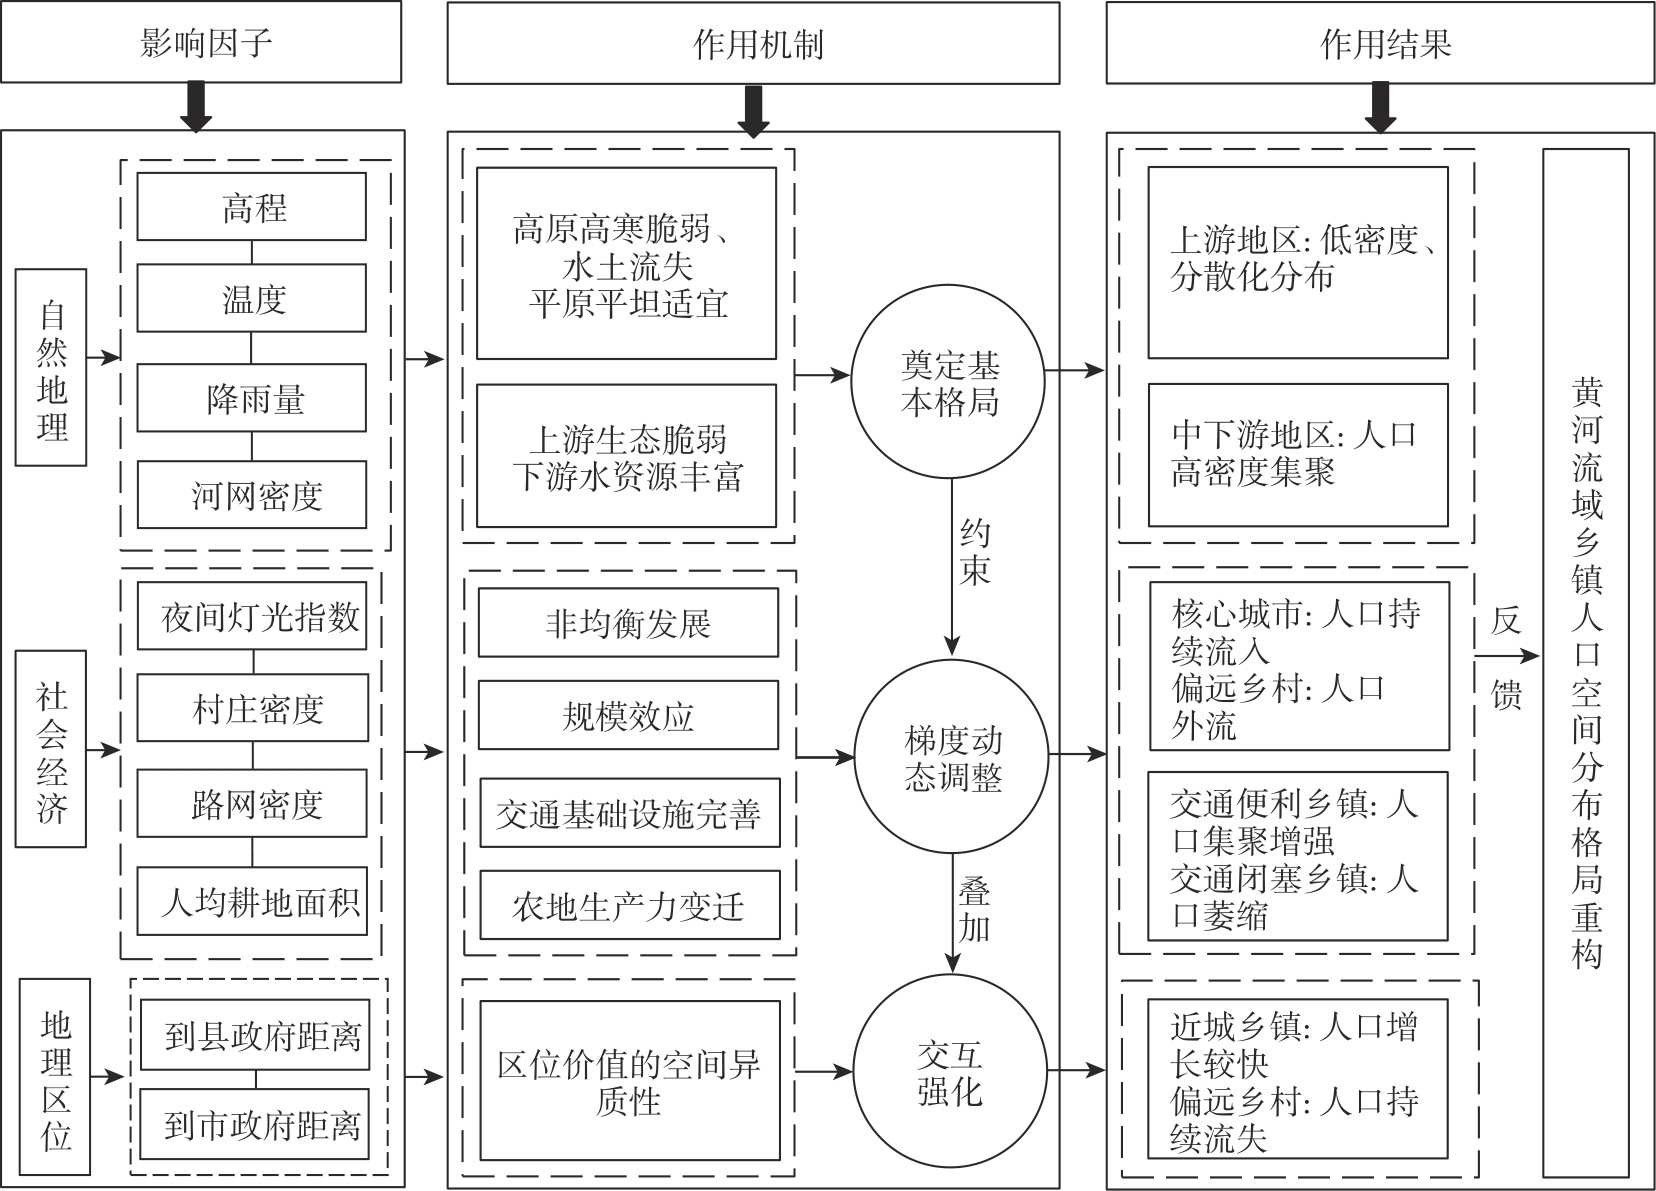
黄河流域人口空间分布格局演变的驱动机制"
| [1] |
孙颖琦, 张子龙, 陈兴鹏, 等. 多源数据视角下黄河流域城市体系的规模等级与网络结构分析[J]. 地理科学, 2024, 44(2): 268-277.
doi: 10.13249/j.cnki.sgs.20220489 |
|
[Sun Yingqi, Zhang Zilong, Chen Xingpeng, et al. Size-hierarchy and network structure analysis of urban system in the Yellow River Basin using multi-source data[J]. Scientia Geographica Sinica, 2024, 44(2): 268-277.]
doi: 10.13249/j.cnki.sgs.20220489 |
|
| [2] | 樊正德, 易成栋, 吕雪征, 等. 都市圈人口分布的时空演化特征及驱动因子——基于首都、上海和广州三大都市圈的实证分析[J]. 城市发展研究, 2023, 30(9): 97-105. |
| [Fan Zhengde, Yi Chengdong, Lü Xuezheng, et al. Spatial-temporal pattern evolution and driving factors of population distribution in Metropolitan Area: Empirical evidence from the three metropolitan areas of Beijing, Shanghai and Guangzhou[J]. Urban Development Studies, 2023, 30(9): 97-105.] | |
| [3] |
王华, 张炜, 宋辉, 等. 基于多源数据的长沙城市人口空间分布格局演变与模拟[J]. 经济地理, 2023, 43(8): 49-61.
doi: 10.15957/j.cnki.jjdl.2023.08.006 |
| [Wang Hua, Zhang Wei, Song Hui, et al. Spatial evolution of urban population in Changsha and its simulation: Based on the multi-source data[J]. Economic Geography, 2023, 43(8): 49-61.] | |
| [4] | 陈卫民, 任雨晴. 中国人口老龄化、收入分配与居民消费[J]. 人口学刊, 2025, 47(4): 82-97. |
| [Chen Weimin, Ren Yuqing. Population aging, income distribution and household consumption in China[J]. Population Journal, 2025, 47(4): 82-97.] | |
| [5] |
汤爽爽, 周婧, 许琪琪, 等. 2010—2020年江苏省城-镇-乡人口分布演变及影响因素[J]. 地理科学进展, 2024, 43(5): 993-1007.
doi: 10.18306/dlkxjz.2024.05.011 |
|
[Tang Shuangshuang, Zhou Jing, Xu Qiqi, et al. Population distribution evolution and influencing factors of city-town-rural area in Jiangsu Province from 2010 to 2020[J]. Progress in Geography, 2024, 43(5): 993-1007.]
doi: 10.18306/dlkxjz.2024.05.011 |
|
| [6] |
刘涛, 彭荣熙, 卓云霞, 等. 2000—2020年中国人口分布格局演变及影响因素[J]. 地理学报, 2022, 77(2): 381-394.
doi: 10.11821/dlxb202202008 |
|
[Liu Tao, Peng Rongxi, Zhuo Yunxia, et al. China’s changing population distribution and influencing factors: Insights from the 2020 census data[J]. Acta Geographica Sinica, 2022, 77(2): 381-394.]
doi: 10.11821/dlxb202202008 |
|
| [7] |
邓羽, 刘盛和, 蔡建明, 等. 中国省际人口空间格局演化的分析方法与实证[J]. 地理学报, 2014, 69(10): 1473-1486.
doi: 10.11821/dlxb201410007 |
|
[Deng Yu, Liu Shenghe, Cai Jianming, et al. Spatial pattern and its evolution of Chinese provincial population and empirical study[J]. Acta Geographica Sinica, 2014, 69(10): 1473-1486.]
doi: 10.11821/dlxb201410007 |
|
| [8] |
Hugo G. Population geography[J]. Progress in Human Geography, 2007, 31(1): 77-88.
doi: 10.1177/0309132507073538 |
| [9] |
戚伟, 刘盛和, 刘振. 基于“七普”的“胡焕庸线”两侧人口集疏新态势及影响因素[J]. 地理学报, 2022, 77(12): 3023-3040.
doi: 10.11821/dlxb202212006 |
|
[Qi Wei, Liu Shenghe, Liu Zhen. The novel pattern and driving factors of population spatial distribution on both sides of the “Hu Line” based on seventh census in China[J]. Acta Geographica Sinica, 2022, 77(12): 3023-3040.]
doi: 10.11821/dlxb202212006 |
|
| [10] | 丁金宏, 程晨, 张伟佳, 等. 胡焕庸线的学术思想源流与地理分界意义[J]. 地理学报, 2021, 76(6): 1317-1333. |
|
[Ding Jinhong, Cheng Chen, Zhang Weijia, et al. The ideological origins and geographical demarcation significance of Hu Huanyong Line[J]. Acta Geographica Sinica, 2021, 76(6): 1317-1333.]
doi: 10.11821/dlxb202106001 |
|
| [11] | 周皓. 中国人口流动模式的稳定性及启示——基于第七次全国人口普查公报数据的思考[J]. 中国人口科学, 2021(3): 28-41, 126-127. |
| [Zhou Hao. The stability of migration pattern in China and related issues: Consideration based on the data of seventh national census bulletin[J]. Chinese Journal of Population Science, 2021(3): 28-41, 126-127.] | |
| [12] |
徐旳, 徐彦. 1928—2017年南京城市户籍人口时空格局演变[J]. 地理学报, 2022, 77(10): 2439-2456.
doi: 10.11821/dlxb202210003 |
|
[Xu Di, Xu Yan. Spatio-temporal pattern of registered population in Nanjing from 1928 to 2017[J]. Acta Geographica Sinica, 2022, 77(10): 2439-2456.]
doi: 10.11821/dlxb202210003 |
|
| [13] | Zhang Yingna, 王悦, 胡昊宇, 等. 基于手机信令大数据的京津冀城市群人口时空分布与流动特征分析[J]. 地域研究与开发, 2023, 42(3): 161-167, 180. |
| [Zhang Yingna, Wang Yue, Hu Haoyu, et al. Analysis of population spatial-temporal distribution and mobility in Beijing-Tianjin-Hebei urban agglomeration based on mobile phone trajectory big data[J]. Areal Research and Development, 2023, 42(3): 161-167, 180.] | |
| [14] | 李博, 金淑婷, 陈兴鹏, 等. 改革开放以来中国人口空间分布特征——基于1982—2010年全国四次人口普查资料的分析[J]. 经济地理, 2016, 36(7): 27-37. |
| [Li Bo, Jin Shuting, Chen Xingpeng, et al. The population spatial distribution characteristics of China since the reform and opening up: Analysis of the four national census data based on 1982—2010[J]. Economic Geography, 2016, 36(7): 27-37.] | |
| [15] |
赵彤彤, 宋邦国, 陈远生, 等. 西藏一江两河地区人口分布与地形要素关系分析[J]. 地球信息科学学报, 2017, 19(2): 225-237.
doi: 10.3724/SP.J.1047.2017.00225 |
| [Zhao Tongtong, Song Bangguo, Chen Yuansheng, et al. Analysis of population distribution and its spatial relationship with terrain elements in the Yarlung Zangbo River, Nyangqu River and Lhasa River region, Tibet[J]. Journal of Geo-Information Science, 2017, 19(2): 225-237.] | |
| [16] | 蒋团标, 朱本慧, 刘一笑. 珠江-西江经济带人口分布时空演化规律及影响因素分析[J]. 南方人口, 2020, 35(4): 57-67. |
| [Jiang Tuanbiao, Zhu Benhui, Liu Yixiao. Analysis on the spatial and temporal evolution of population distribution and its influencing factors in the Pearl River-Xijiang River economic belt[J]. South China Population, 2020, 35(4): 57-67.] | |
| [17] |
马晓敏, 张志斌, 郭倩倩, 等. 2000—2020年兰州市人口时空格局演变及驱动因素分析[J]. 干旱区地理, 2025, 48(1): 168-178.
doi: 10.12118/j.issn.1000-6060.2024.099 |
|
[Ma Xiaomin, Zhang Zhibin, Guo Qianqian, et al. Spatial and temporal evolution and driving factors of population in Lanzhou City from 2000 to 2020[J]. Arid Land Geography, 2025, 48(1): 168-178.]
doi: 10.12118/j.issn.1000-6060.2024.099 |
|
| [18] | 刘爱华. 京津冀流动人口的空间集聚及其影响因素[J]. 人口与经济, 2017(6): 71-78. |
| [Liu Aihua. Analysis on the spatial agglomeration and its influence factors of the floating population in Beijing-Tianjin-Hebei[J]. Population & Economics, 2017(6): 71-78.] | |
| [19] |
王露, 封志明, 杨艳昭, 等. 2000—2010年中国不同地区人口密度变化及其影响因素[J]. 地理学报, 2014, 69(12): 1790-1798.
doi: 10.11821/dlxb201412005 |
|
[Wang Lu, Feng Zhiming, Yang Yanzhao, et al. The change of population density and its influencing factors from 2000 to 2010 in China on county scale[J]. Acta Geographica Sinica, 2014, 69(12): 1790-1798.]
doi: 10.11821/dlxb201412005 |
|
| [20] |
武荣伟, 张佳丽, 周亮, 等. 人口流动视角下中国县市人口老龄化地域类型演化及影响因素[J]. 地理科学进展, 2025, 44(6): 1213-1226.
doi: 10.18306/dlkxjz.2025.06.009 |
|
[Wu Rongwei, Zhang Jiali, Zhou Liang, et al. Population aging in Chinese counties: Change of regional types and influencing factors from the population mobility perspective[J]. Progress in Geography, 2025, 44(6): 1213-1226.]
doi: 10.18306/dlkxjz.2025.06.009 |
|
| [21] |
朱虎啸, 汤爽爽, 许琪琪. 城乡四类流动人口空间分布及影响因素研究——以江苏省为例[J]. 地理研究, 2025, 44(6): 1655-1673.
doi: 10.11821/dlyj020250023 |
| [Zhu Huxiao, Tang Shuangshuang, Xu Qiqi. Spatial distribution and influencing factors of four types of floating population in urban and rural areas: A case study of Jiangsu Province[J]. Geographical Research, 2025, 44(6): 1655-1673.] | |
| [22] | 王振波, 徐建刚, 朱传耿, 等. 中国县域可达性区域划分及其与人口分布的关系[J]. 地理学报, 2010, 65(4): 416-426. |
|
[Wang Zhenbo, Xu Jiangang, Zhu Chuangeng, et al. The county accessibility divisions in China and its correlation with population distribution[J]. Acta Geographica Sinica, 2010, 65(4): 416-426.]
doi: 10.11821/xb201004004 |
|
| [23] | 童玉芬, 韩佳宾, 杨艳飞. 中国城市群人口分布结构合理性评价——基于城市群经济效益的分析[J]. 人口研究, 2024, 48(3): 52-64. |
| [Tong Yufen, Han Jiabin, Yang Yanfei. Evaluation of rationality of population distribution of urban agglomerations in China: Based on the analysis of economic benefits of urban agglomerations[J]. Population Research, 2024, 48(3): 52-64.] | |
| [24] |
李庆鹏, 周宏伟. 近百年来华北县域村级人口的演变——以山西省平遥县为例[J]. 经济地理, 2025, 45(2): 91-102.
doi: 10.15957/j.cnki.jjdl.2025.02.009 |
|
[Li Qingpeng, Zhou Hongwei. Evolution of village-level population in north China in 1920—2010: A case of Pingyao County in Shanxi Province[J]. Economic Geography, 2025, 45(2): 91-102.]
doi: 10.2307/143185 |
|
| [25] |
李琴, 谢治, 张子涵, 等. 新型城镇化视角下湖南省农业转移人口市民化意愿的空间分布及影响因素——基于2017年全国流动人口动态监测数据[J]. 经济地理, 2024, 44(11): 95-103.
doi: 10.15957/j.cnki.jjdl.2024.11.010 |
|
[Li Qin, Xie Zhi, Zhang Zihan, et al. Spatial distribution and influencing factors of the citizenization willingness of agricultural transfer population in Hunan Province under the perspective of new urbanization: Based on the dynamic monitoring data of the national floating population in 2017[J]. Economic Geography, 2024, 44(11): 95-103.]
doi: 10.15957/j.cnki.jjdl.2024.11.010 |
|
| [26] |
Li J T, Jia L R, Liu Y S, et al. Measuring model of rural transformation development path in Fuping County of Beijing-Tianjin-Hebei region[J]. Habitat International, 2018, 74(4): 48-56.
doi: 10.1016/j.habitatint.2018.03.012 |
| [27] |
刘涛, 朱羽佳. 主体功能区规划对中国人口分布变动的影响效应[J]. 地理学报, 2025, 80(6): 1427-1445.
doi: 10.11821/dlxb202506001 |
| [Liu Tao, Zhu Yujia. Effects of main function zoning on China’s population redistribution[J]. Acta Geographica Sinica, 2025, 80(6): 1427-1445.] | |
| [28] |
张学良, 潘婷. 双重边界视角下乡镇人口收缩的精准识别与特征分析——以黄河流域为例[J]. 经济地理, 2024, 44(3): 1-10.
doi: 10.15957/j.cnki.jjdl.2024.03.001 |
|
[Zhang Xueliang, Pan Ting. Accurate identification and characteristic analysis of township population shrinkage from the perspective of dual boundary: A case study of the Yellow River Basin[J]. Economic Geography, 2024, 44(3): 1-10.]
doi: 10.15957/j.cnki.jjdl.2024.03.001 |
|
| [29] |
付占辉, 杨雅涵, 乔家君, 等. 黄河流域县域乡村空心化地域类型及乡村振兴路径[J]. 地理科学进展, 2024, 43(6): 1049-1059.
doi: 10.18306/dlkxjz.2024.06.001 |
|
[Fu Zhanhui, Yang Yahan, Qiao Jiajun, et al. Rural hollowing out in the Yellow River Basin and the development path of rural revitalization[J]. Progress in Geography, 2024, 43(6): 1049-1059.]
doi: 10.18306/dlkxjz.2024.06.001 |
|
| [30] | 高玮, 杨励雅, 赵新正, 等. 主体功能区视角下黄河流域人口收缩时空变化与影响因素[J]. 地理研究, 2025, 44(6): 1565-1586. |
| [Gao Wei, Yang Liya, Zhao Xinzheng, et al. Spatiotemporal patterns and influencing factors of population shrinkage in the Yellow River Basin from the perspective of the Major Function Oriented Zone[J]. Geographical Research, 2025, 44(6): 1565-1586.] | |
| [31] | 宫攀, 张槊, 王文哲. 人口视角下中国城市收缩的演变特征与时空格局)——基于第七次全国人口普查公报数据的分析[J]. 人口与经济, 2022(3): 1-15. |
| [Gong Pan, Zhang Shuo, Wang Wenzhe. The evolutionary characteristics and spatial-temporal pattern of China’s urban shrinkage from the perspective of population: Based on the analysis of the seventh national census bulletin data[J]. Population & Economics, 2022(3): 1-15.] | |
| [32] | 罗庆, 王艺霏, 周晓庆, 等. 中国农民专业合作社空间格局及其影响因素[J]. 中国农业资源与区划, 2024, 45(5): 155-168. |
| [Luo Qing, Wang Yifei, Zhou Xiaoqing, et al. Spatial pattern of Chinese farmers’ professional cooperatives and its influencing factors[J]. Chinese Journal of Agricultural Resources and Regional Planning, 2024, 45(5): 155-168.] | |
| [33] | Li X C, Zhou Y Y, Zhao M, et al. A harmonized global nighttime light dataset 1992—2018[J]. Scientific Data, 2020(7): 168-177. |
| [34] | 孙平军, 刘菊, 罗宁, 等. 成渝地区双城经济圈收缩城市的空间格局与影响因素——基于第五、六、七次全国人口普查数据的分析[J]. 西南大学学报(自然科学版), 2022, 44(1): 46-56. |
| [Sun Pingjun, Liu Ju, Luo Ning, et al. The spatial pattern of shrinking cities in Chengdu-Chongqing economic circle and its influencing factors[J]. Journal of Southwest University (Natural Science Edition), 2022, 44(1): 46-56.] | |
| [35] |
Liu C L, Wang F H, Xu Y P. Habitation environment suitability and population density patterns in China: A regionalization approach[J]. Growth and Change, 2019, 50(1): 184-200.
doi: 10.1111/grow.2019.50.issue-1 |
| [36] |
杜志威. 中国中小城市城-镇-乡人口收缩的空间特征与影响因素[J]. 地理研究, 2025, 44(6): 1534-1550.
doi: 10.11821/dlyj020250074 |
| [Du Zhiwei. Spatial characteristics and influencing factors on population shrinkage in city-town-rural areas of small and medium-sized cities in China[J]. Geographical Research, 2025, 44(6): 1534-1550.] | |
| [37] |
杨慧敏, 许家伟, 李小建. 城镇化进程中平原农区县域人口分布变化特征及影响因素——以豫东平原柘城县为例[J]. 地理研究, 2023, 42(6): 1528-1544.
doi: 10.11821/dlyj020221160 |
| [Yang Huimin, Xu Jiawei, Li Xiaojian. Characteristics and influencing factors of population distribution in plain agricultural areas in the process of urbanization: A case study of Zhecheng County in the eastern plain of Henan Province[J]. Geographical Research, 2023, 42(6): 1528-1544.] |
| [1] | 赵静, 王永瑜, 史小英. 基于MGWR模型的中国人均碳足迹时空演变及影响因素研究[J]. 干旱区地理, 2026, 49(8): 1601-1613. |
| [2] | 李森, 鱼腾飞, 赵鸿雁, 张志山, 颜长珍. 近50 a宁夏中部干旱带沙漠化时空变化及其逆转期驱动力[J]. 干旱区地理, 2026, 49(8): 1663-1674. |
| [3] | 陈先林, 闫志远, 刘全明, 张圣微. 1958—2023年内蒙古植被干旱时空特征与驱动因素分析[J]. 干旱区地理, 2026, 49(7): 1323-1335. |
| [4] | 张登科, 张彦洪, 张鹏举, 张万光. 2000—2022年庆阳市土地利用与植被覆盖时空变化及影响因素[J]. 干旱区地理, 2026, 49(7): 1395-1404. |
| [5] | 宁雅萱, 尹豪, 李金诺. 中国北方农牧交错带中段新型城镇化与农业生态系统服务耦合分析[J]. 干旱区地理, 2026, 49(7): 1457-1469. |
| [6] | 高莹, 周可丽, 元媛, 史薪茹, 吴佳霖. 黄河流域旅游经济与居民福祉耦合协调时空演变及驱动机制研究[J]. 干旱区地理, 2026, 49(7): 1493-1508. |
| [7] | 何嘉欣, 李海洋. 中国就业质量的区域差异、动态演进及影响因素[J]. 干旱区地理, 2026, 49(7): 1520-1529. |
| [8] | 马小雯, 郭精军, 谢雁. 新质生产力对黄河流域城市绿色发展的赋能效应研究[J]. 干旱区地理, 2026, 49(6): 1238-1248. |
| [9] | 朱怡婷, 杜跃, 周雨乾, 何雄, 周春山, 陈泓睿. 基于社交媒体数据的“网红打卡地”空间特征及影响因素[J]. 干旱区地理, 2026, 49(6): 1264-1276. |
| [10] | 吕宛青, 宋志高, 肖钊富. 中国新型城镇化与旅游业高质量发展耦合协调、障碍诊断及驱动因素[J]. 干旱区地理, 2026, 49(5): 1063-1073. |
| [11] | 李文美, 吴新年, 任珩, 李娜, 张晶. 基于文献计量的黄河流域生态环境研究态势分析[J]. 干旱区地理, 2026, 49(5): 928-938. |
| [12] | 耿甜伟, 韩晚星, 林菲, 李振环. 陕西省固碳服务供需关系时空演变特征及影响因素[J]. 干旱区地理, 2026, 49(5): 939-948. |
| [13] | 陈文宣, 陈钰, 王生隆. 黄河流域农业碳排放时空演化特征及其影响因素分析[J]. 干旱区地理, 2026, 49(4): 713-726. |
| [14] | 郝晓燕, 李玥蓉, 吴月. 黄河流域物流业全要素碳生产率测度及影响因素——基于能源禀赋差异视角[J]. 干旱区地理, 2026, 49(4): 756-768. |
| [15] | 贾亚娟, 高君, 张新奇. 关中平原耕地利用生态效率时空演化及驱动因素分析[J]. 干旱区地理, 2026, 49(4): 830-840. |
|
||