- 2025年3月28日 星期五
干旱区地理 ›› 2025, Vol. 48 ›› Issue (3): 405-420.doi: 10.12118/j.issn.1000-6060.2024.249 cstr: 32274.14.ALG2024249
闫劲烨( ), 马正权, 孙萱萱, 阿力木·阿巴斯, 帕丽达·牙合甫()
收稿日期:2024-04-21
修回日期:2024-05-28
出版日期:2025-03-25
发布日期:2025-03-14
通讯作者:
帕丽达·牙合甫(1968-),女,博士,副教授,主要从事区域大气污染监测与评价、大气污染控制研究. E-mail: paridayakup@163.com作者简介:闫劲烨(1998-),男,硕士研究生,主要从事干旱区资源与环境监测及大气污染控制研究. E-mail: yanjinye1126@163.com
基金资助:
YAN Jinye(), MA Zhengquan, SUN Xuanxuan, Alim ABBAS, Palida YAHEFU()
Received:2024-04-21
Revised:2024-05-28
Published:2025-03-25
Online:2025-03-14
摘要:
使用HYSPLIT模型等方法解析2015—2023年“乌鲁木齐-昌吉回族自治州-石河子(乌-昌-石)”城市群PM2.5与PM10的时空变化及来源。结果表明:(1) 在空间尺度上,2019—2022年“乌-昌-石”城市群PM2.5与PM10浓度在城市中心和西北部较高,PM10浓度与海拔成反比。(2) 从2015—2023年“乌-昌-石”城市群的时间尺度来看,在年际尺度上,乌鲁木齐市和昌吉回族自治州的PM2.5与PM10年均浓度呈现整体下降趋势,石河子市和五家渠市的PM2.5与PM10年均浓度直到2023年才显著下降。在季节尺度上,PM2.5与PM10季均浓度总体下降,相对下降幅度春季最大,夏秋次之,冬季最小。在月尺度上,PM2.5与PM10月均浓度呈现“U”型分布,其中1月降幅显著。在周尺度上,工作日大量堵车等原因使4个城市的PM2.5周均浓度呈现“负周末效应”,而PM10周均浓度只在乌鲁木齐市呈现“正周末效应”。在日尺度上,冬季PM2.5与PM10日均浓度远高于其他季节,PM2.5日均浓度整体下降,高浓度天数减少,PM10日均浓度受沙尘影响波动较大。(3) 2019—2021年“乌-昌-石”城市群的污染物来源表现为:2019年以本地源为主,污染源广泛且浓度高;2020年由于疫情防控措施的实施,本地排放减少,污染源向中亚地区转移;2021年污染源再次扩大并转向国内。研究可为“乌-昌-石”城市群的大气污染治理和环境政策优化提供数据支持,有助于推动该地区的生态环境保护和经济的高质量增长。
闫劲烨, 马正权, 孙萱萱, 阿力木·阿巴斯, 帕丽达·牙合甫. 2015—2023年“乌-昌-石”城市群PM2.5与PM10时空变化及潜在源分析[J]. 干旱区地理, 2025, 48(3): 405-420.
YAN Jinye, MA Zhengquan, SUN Xuanxuan, Alim ABBAS, Palida YAHEFU. Spatiotemporal variations and potential sources of PM2.5 and PM10 in the “Urumqi-Changji-Shihezi” urban agglomeration from 2015 to 2023[J]. Arid Land Geography, 2025, 48(3): 405-420.
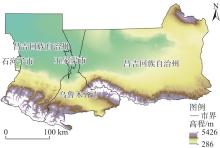
图1
“乌-昌-石”城市群概况 注:基于自然资源部标准地图服务网站审图号为GS(2019)1822号的标准地图制作,底图边界无修改。下同。"
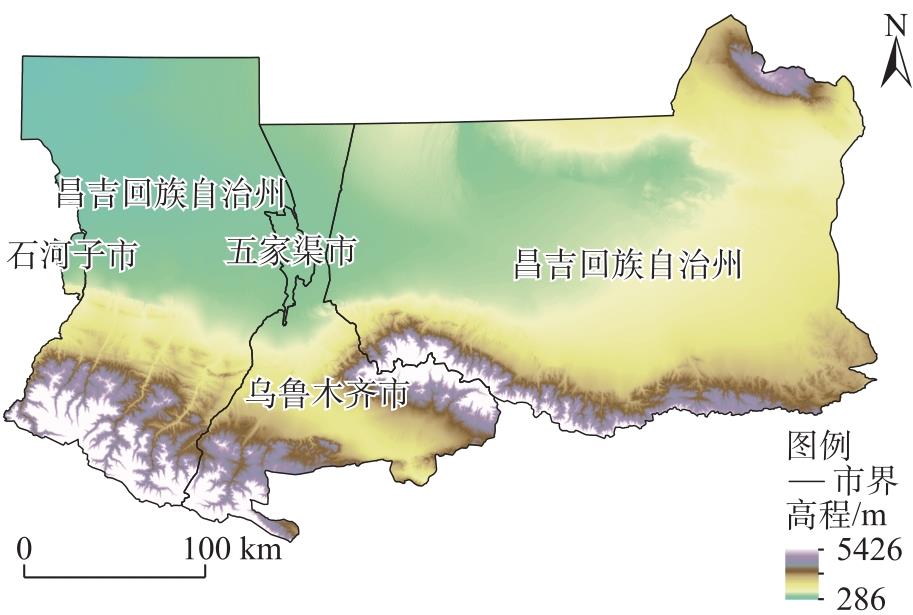

图2
2019—2022年“乌-昌-石”城市群PM2.5与PM10年均浓度空间分布"
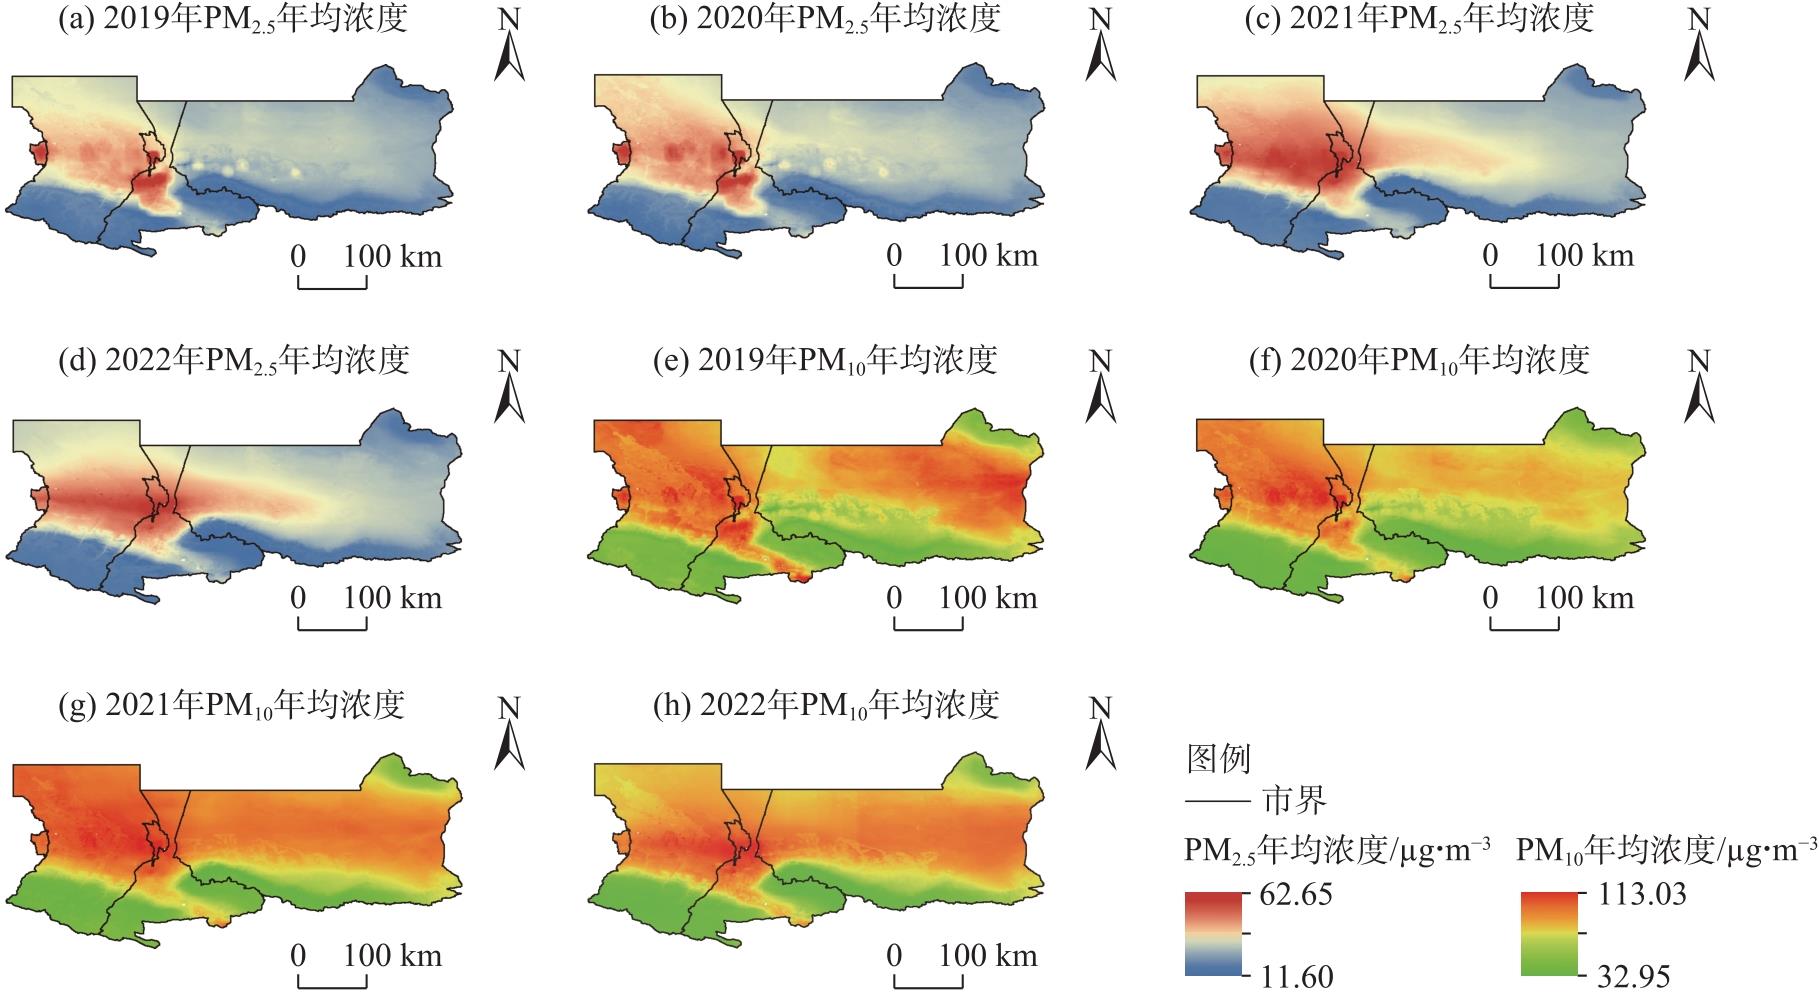

图3
2015—2023年“乌-昌-石”城市群3维PM2.5与PM10年均浓度变化 注:昌吉州为昌吉回族自治州的简称。下同。"
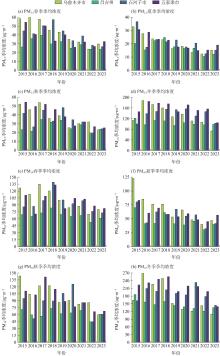
图4
2015—2023年“乌-昌-石”城市群PM2.5与PM10季均浓度变化"
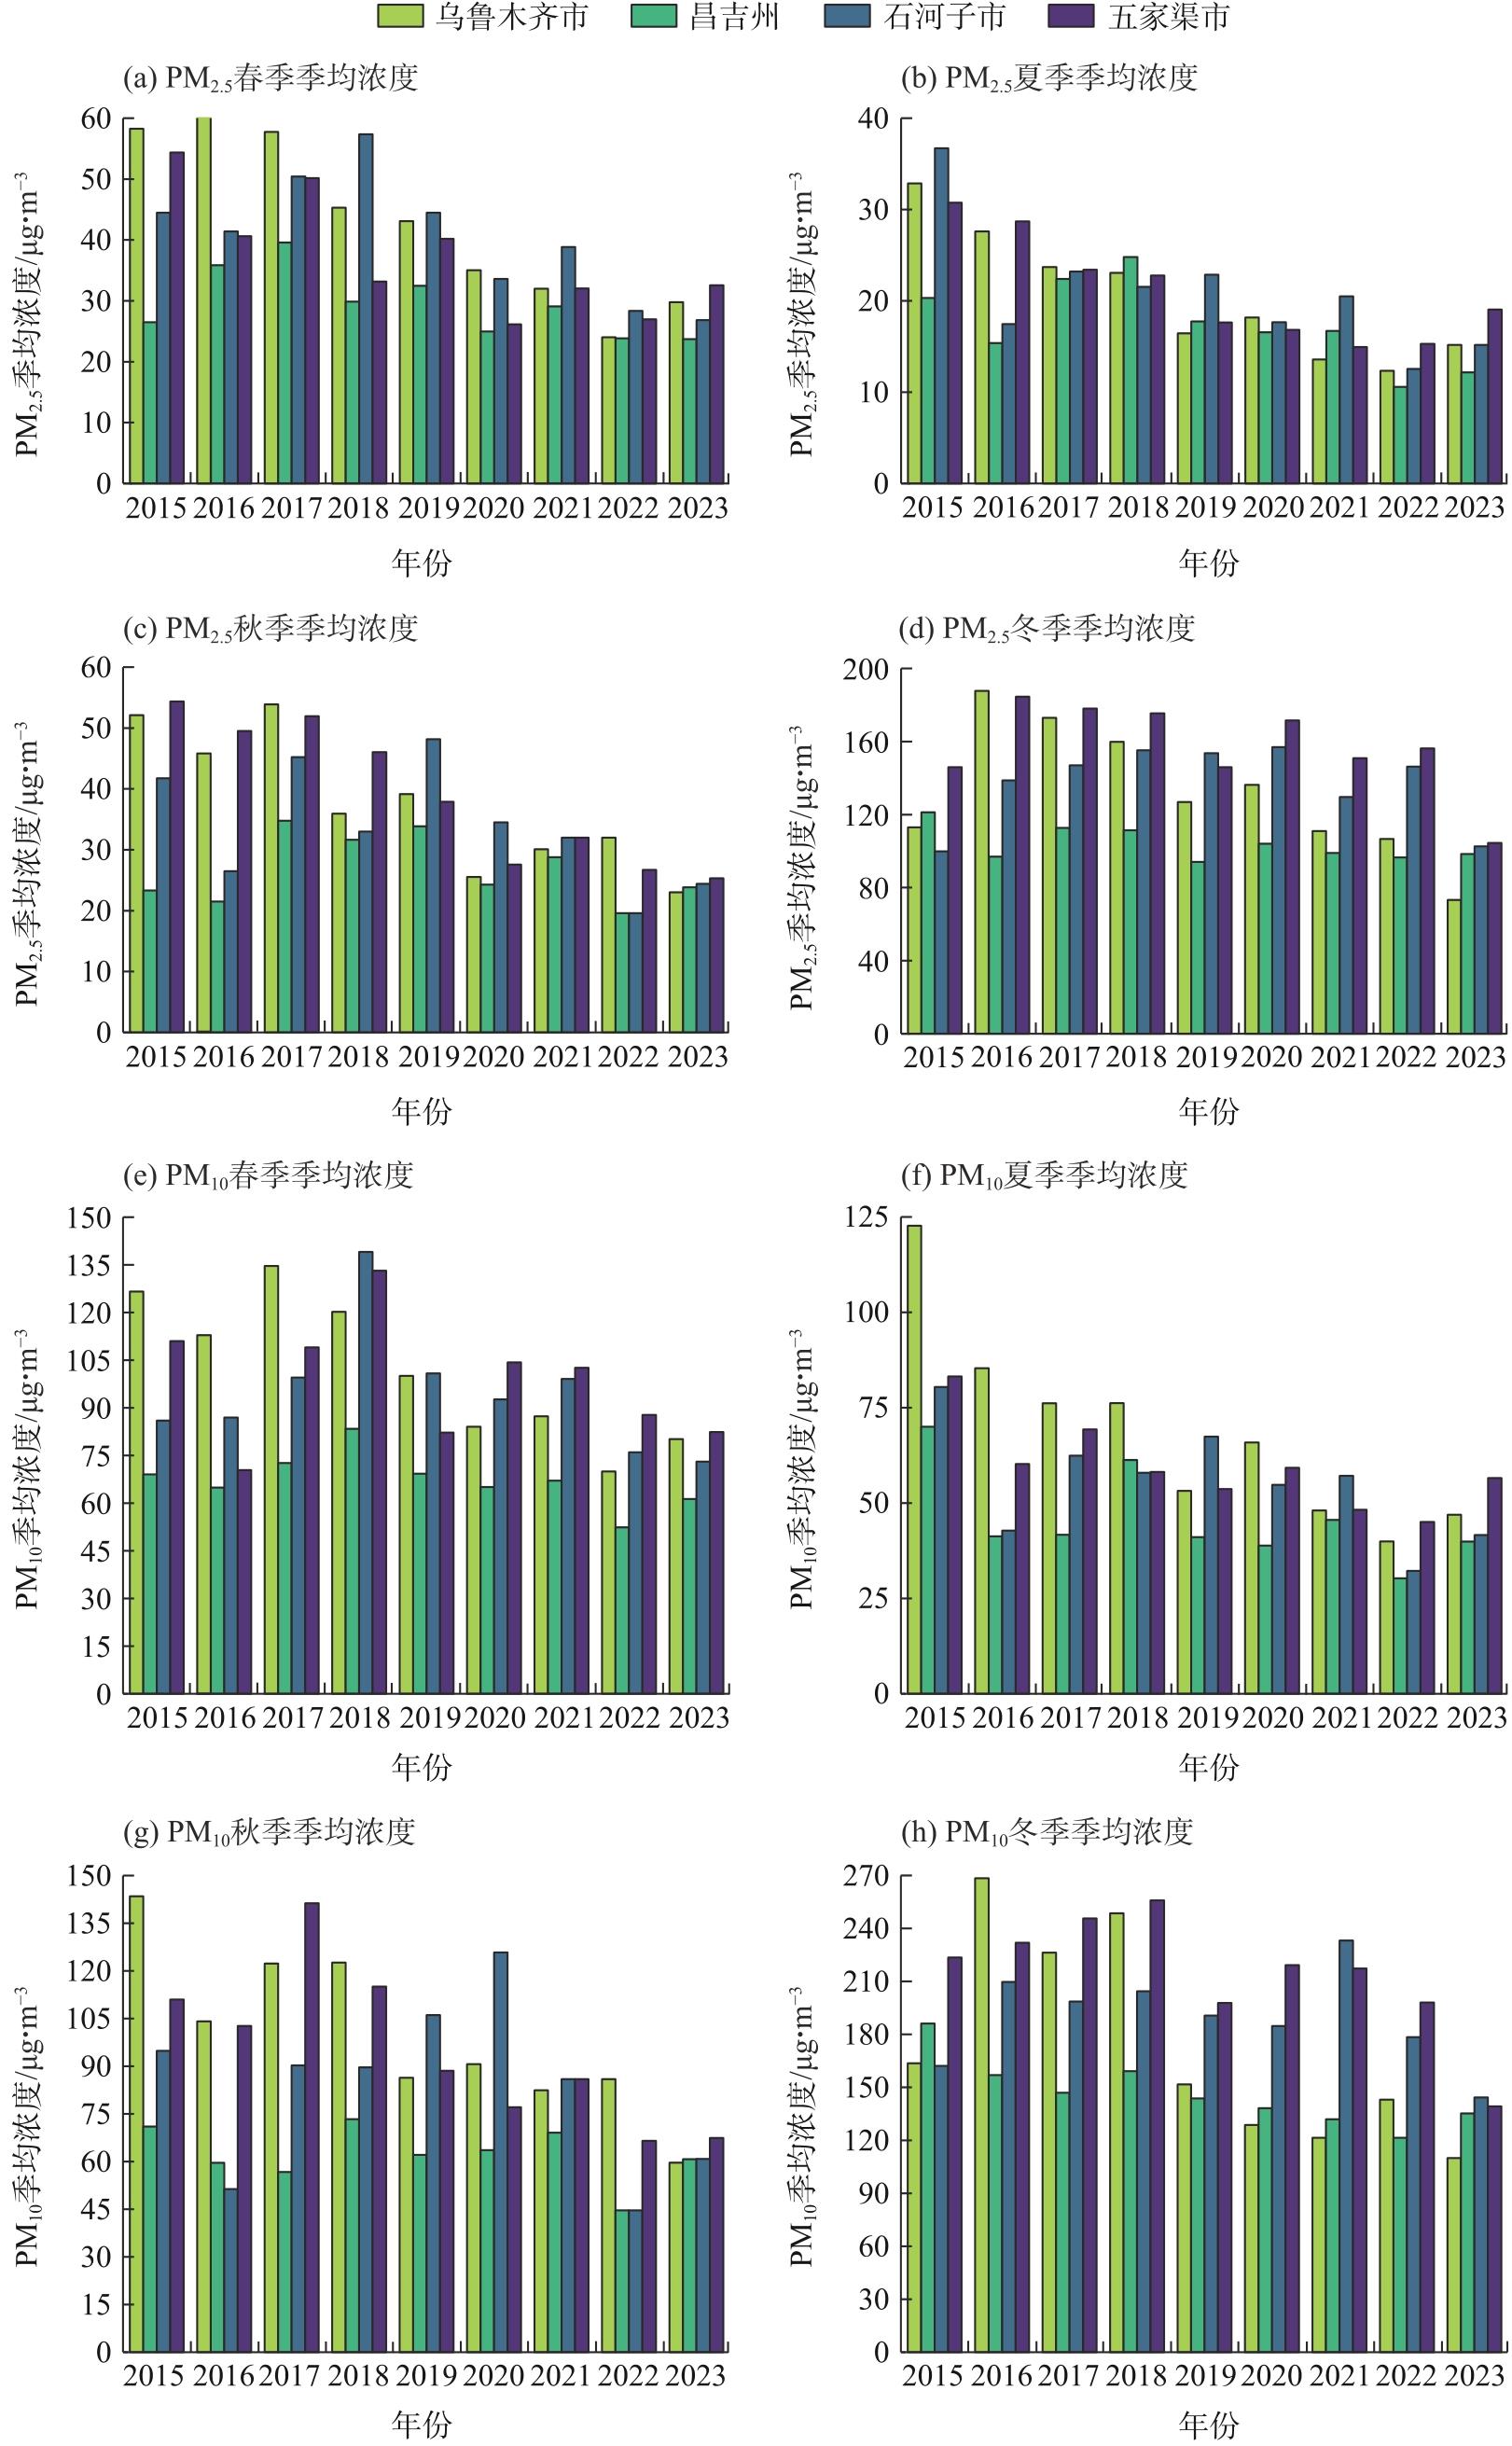

图5
2015—2023年“乌-昌-石”城市群PM2.5与PM10月均浓度变化"
图6
“乌-昌-石”城市群周内PM2.5与PM10日均浓度差异变化"
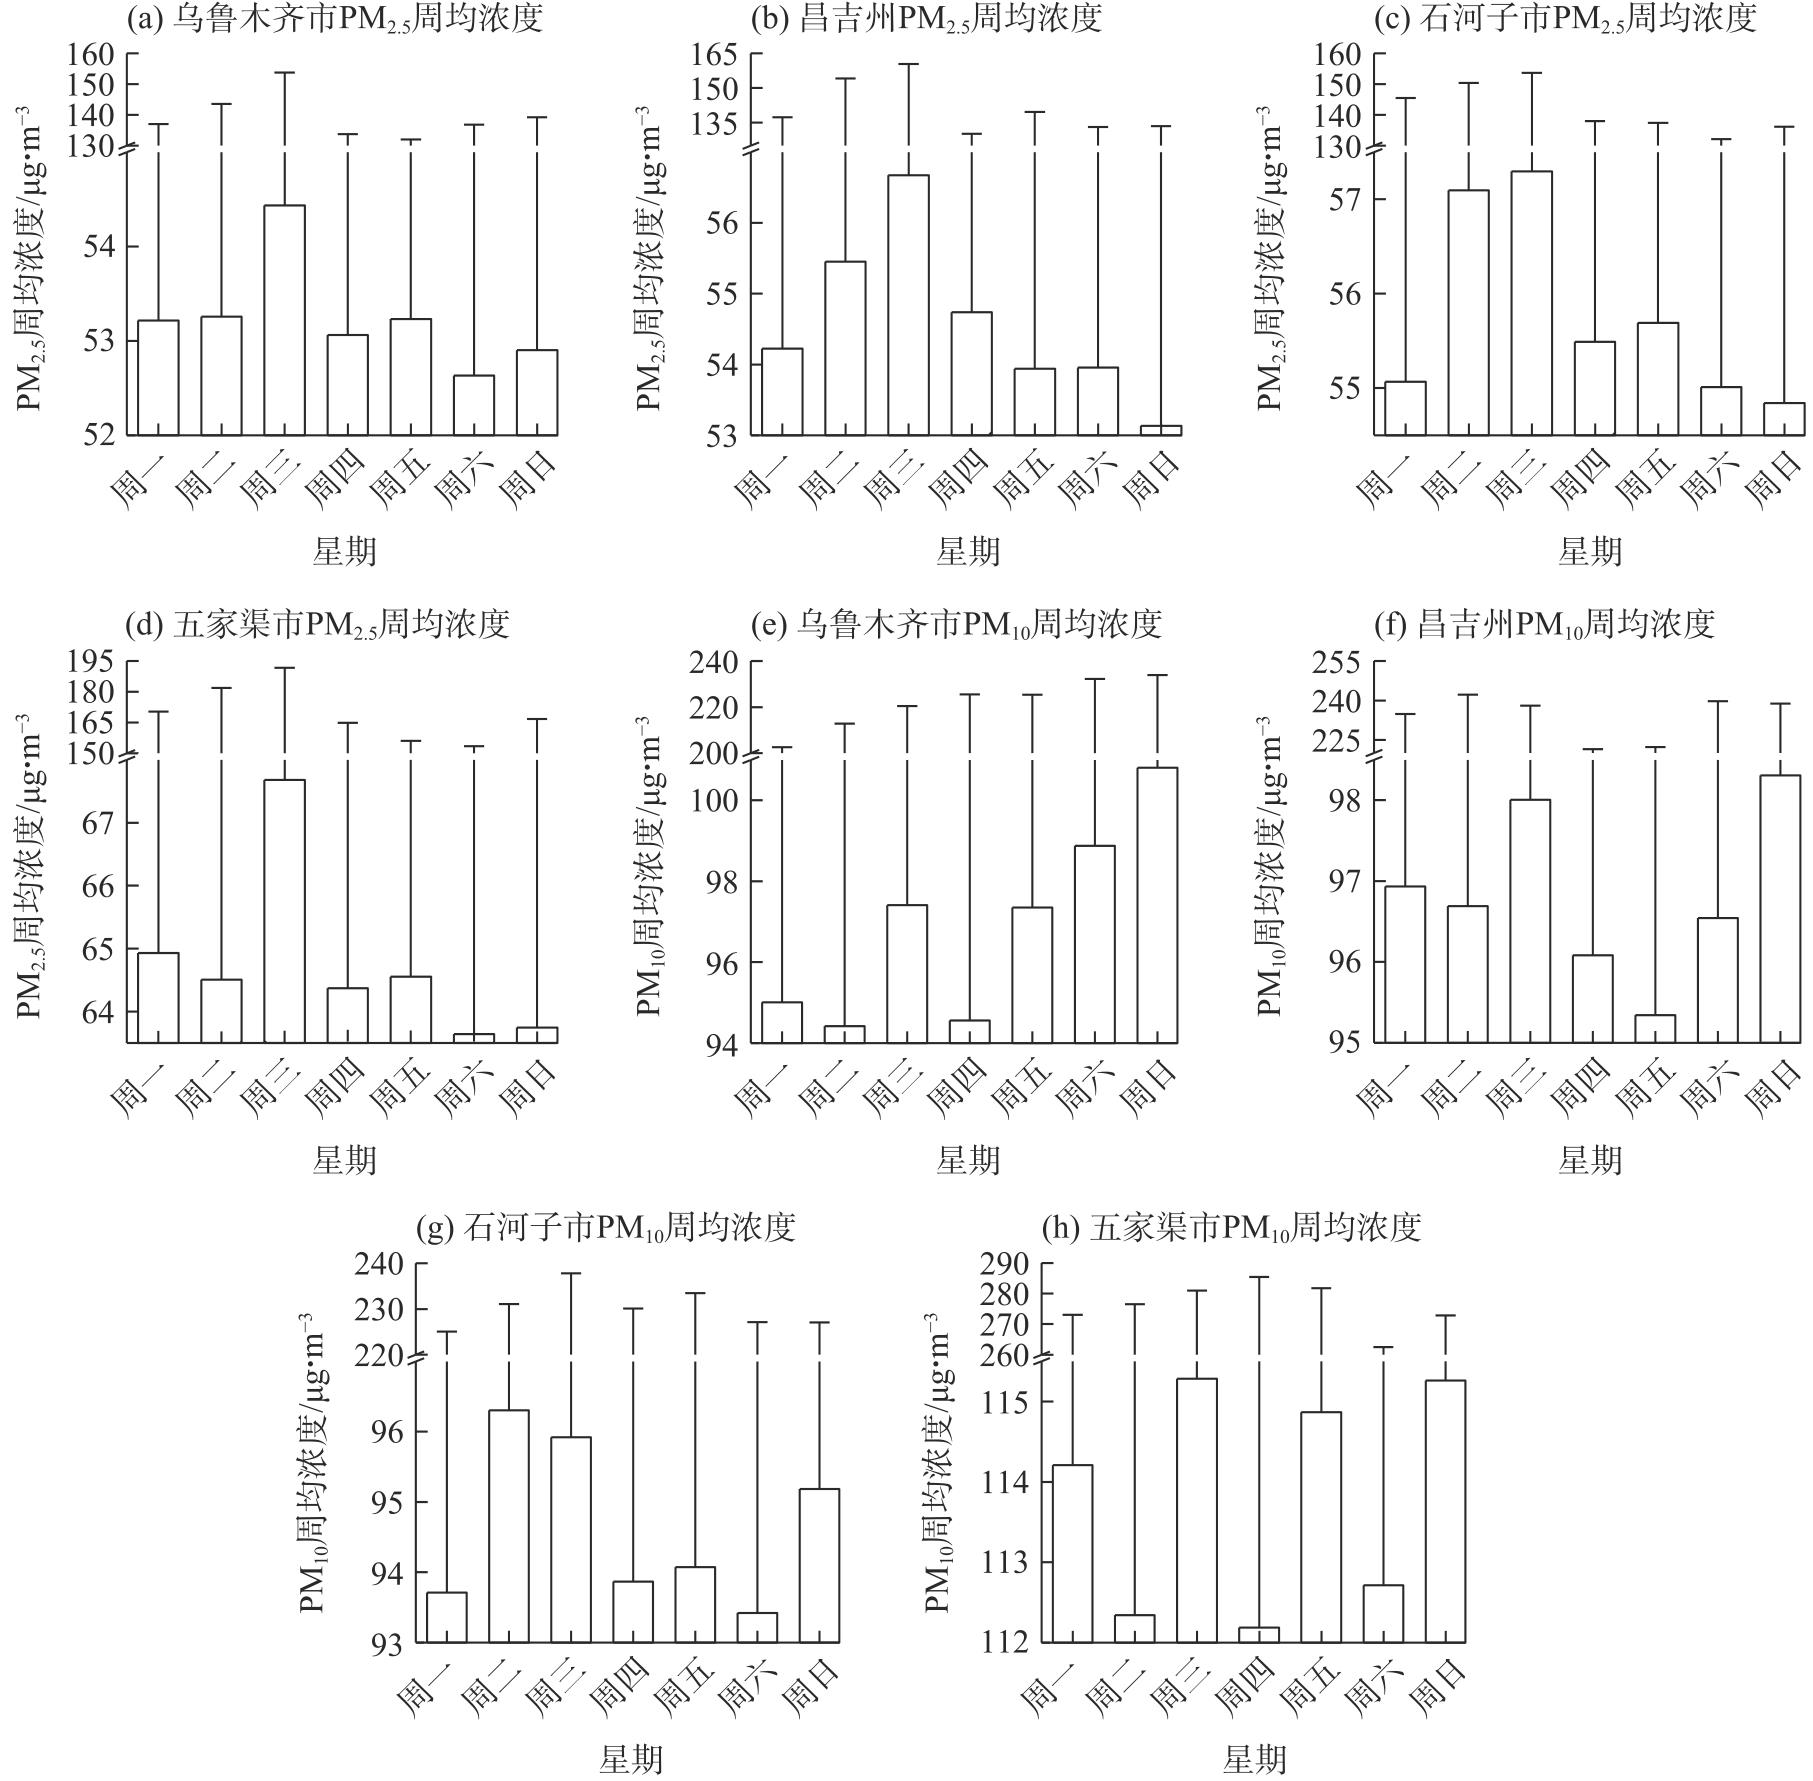
表1
周末与工作日污染物各城市日均浓度相对偏差"
| 城市 | PM2.5日均浓度偏差/% | PM10日均浓度偏差/% |
|---|---|---|
| 乌鲁木齐市 | -1.26 | 4.27 |
| 昌吉州 | -2.66 | 0.84 |
| 石河子市 | -2.14 | -0.50 |
| 五家渠市 | -2.32 | 0.18 |

图7
2015年1月1日—2023年12月31日“乌-昌-石”城市群日均浓度变化"
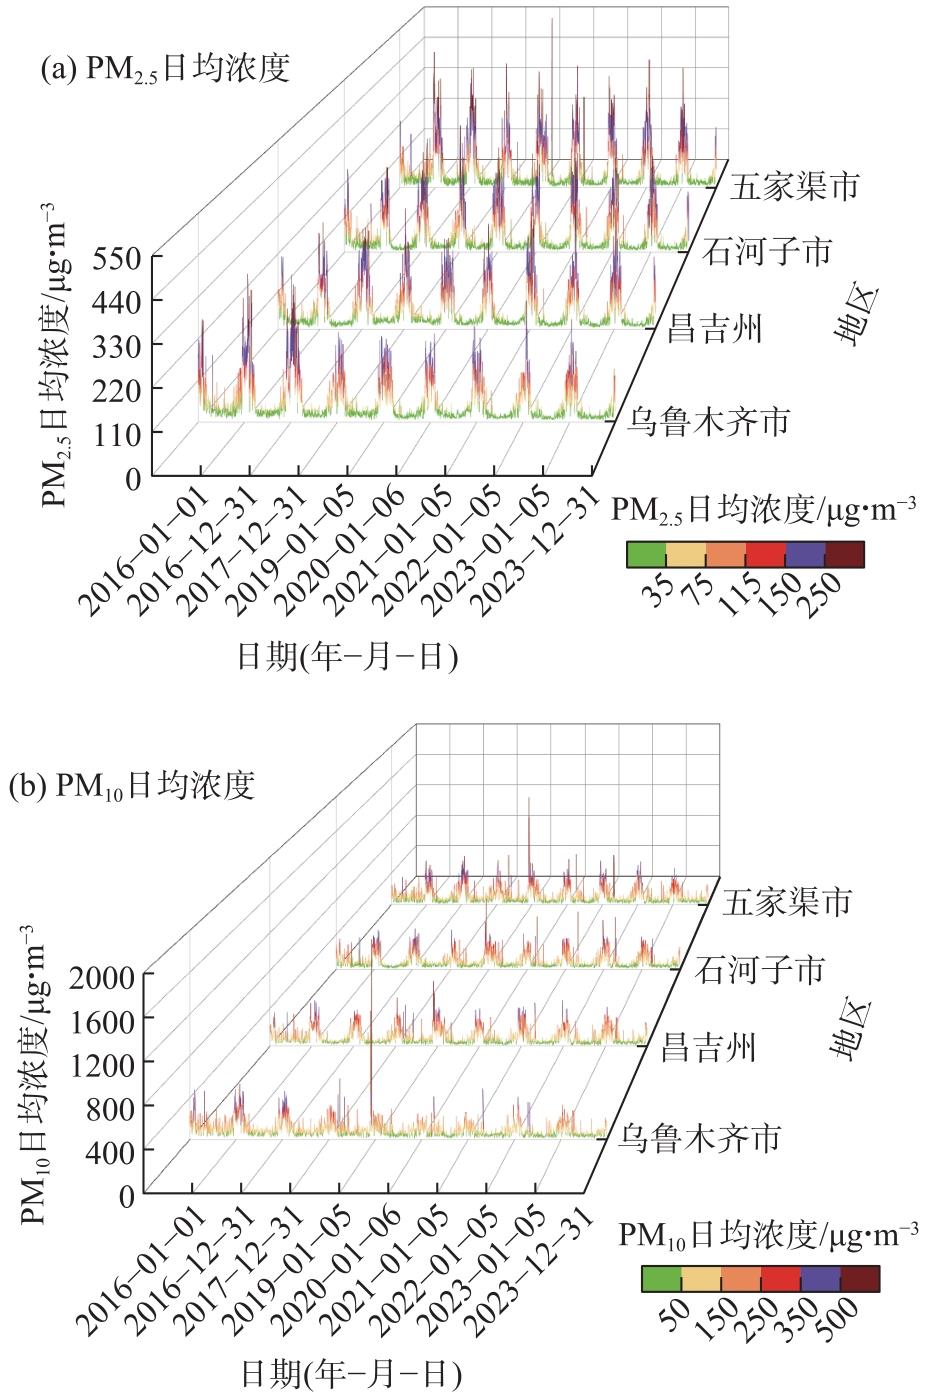

图8
“乌-昌-石”城市群PM2.5与PM10日均浓度各污染程度占比"
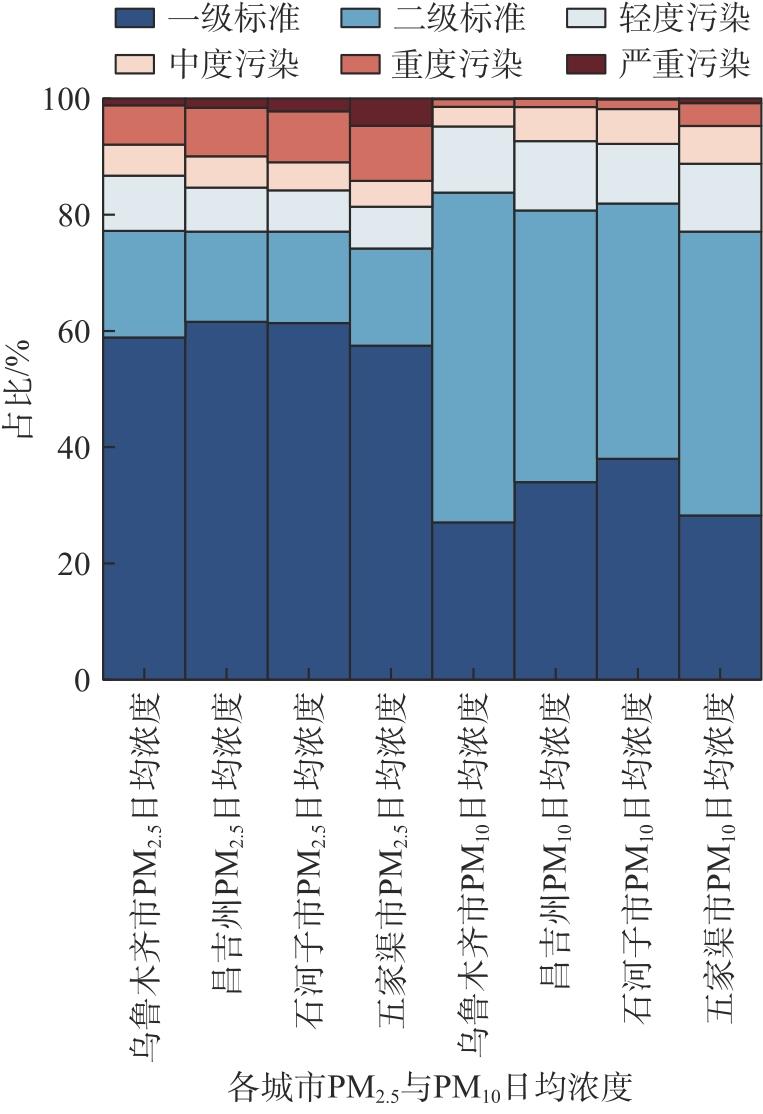
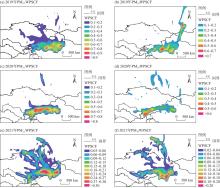
图9
2019—2021年“乌-昌-石”城市群PM2.5与PM10潜在源区贡献分布 注:基于自然资源部标准地图服务网站审图号为GS(2016)1666号的标准地图制作,底图边界无修改。WPSCF为经过加权后的潜在源贡献函数值。下同。"
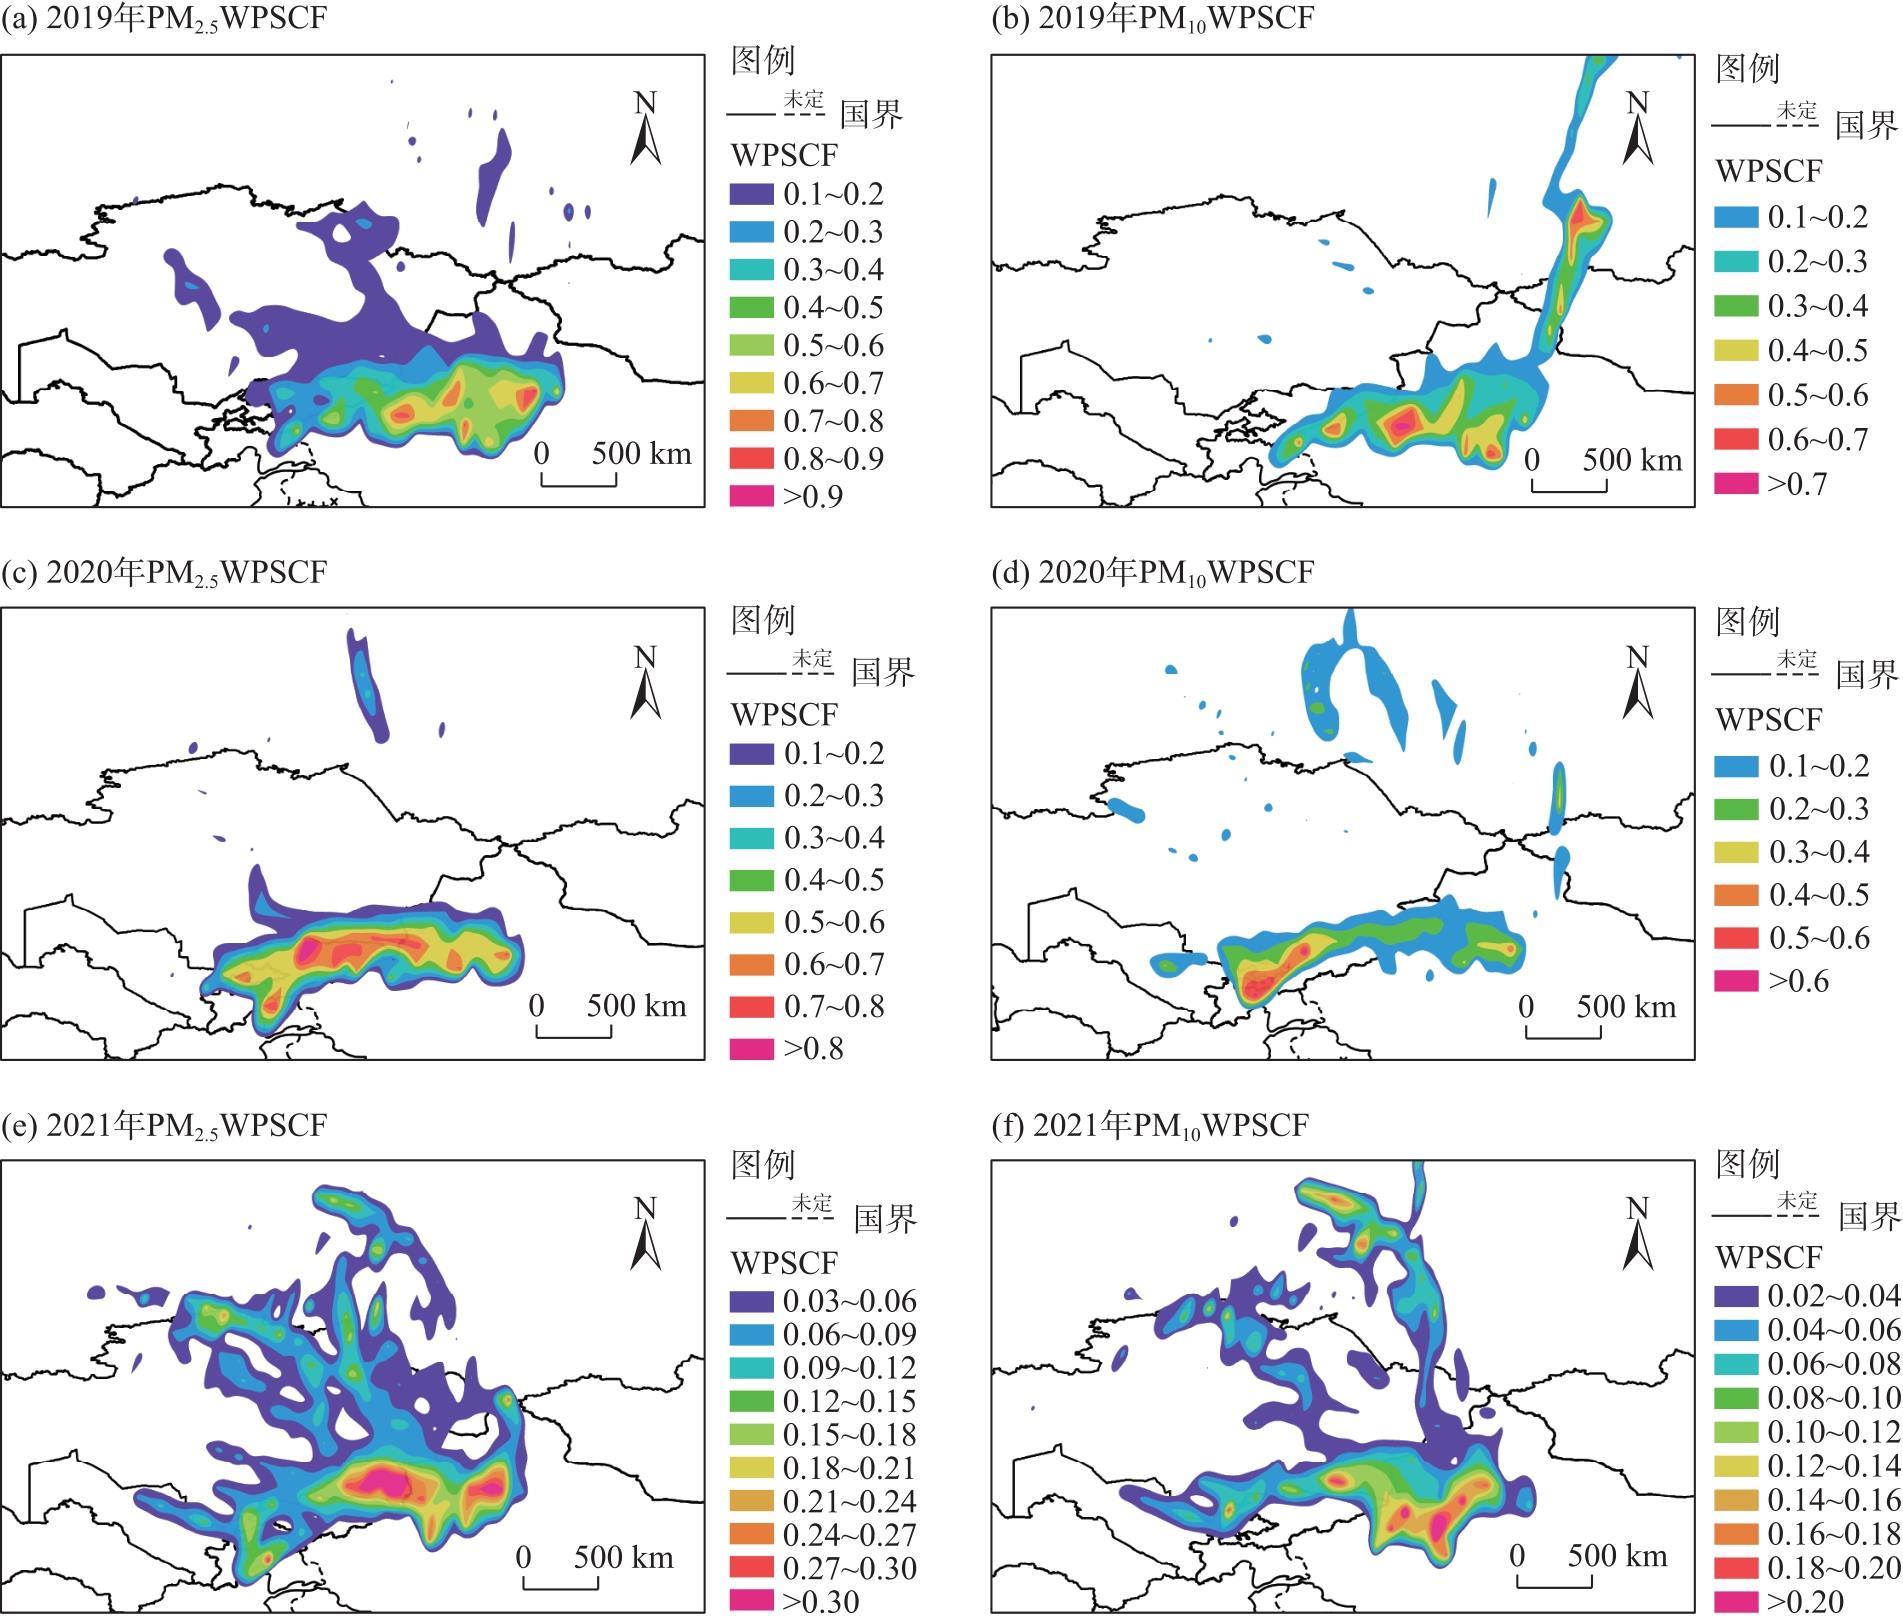
图10
2020年“乌-昌-石”城市群PM2.5潜在源区贡献月分布"
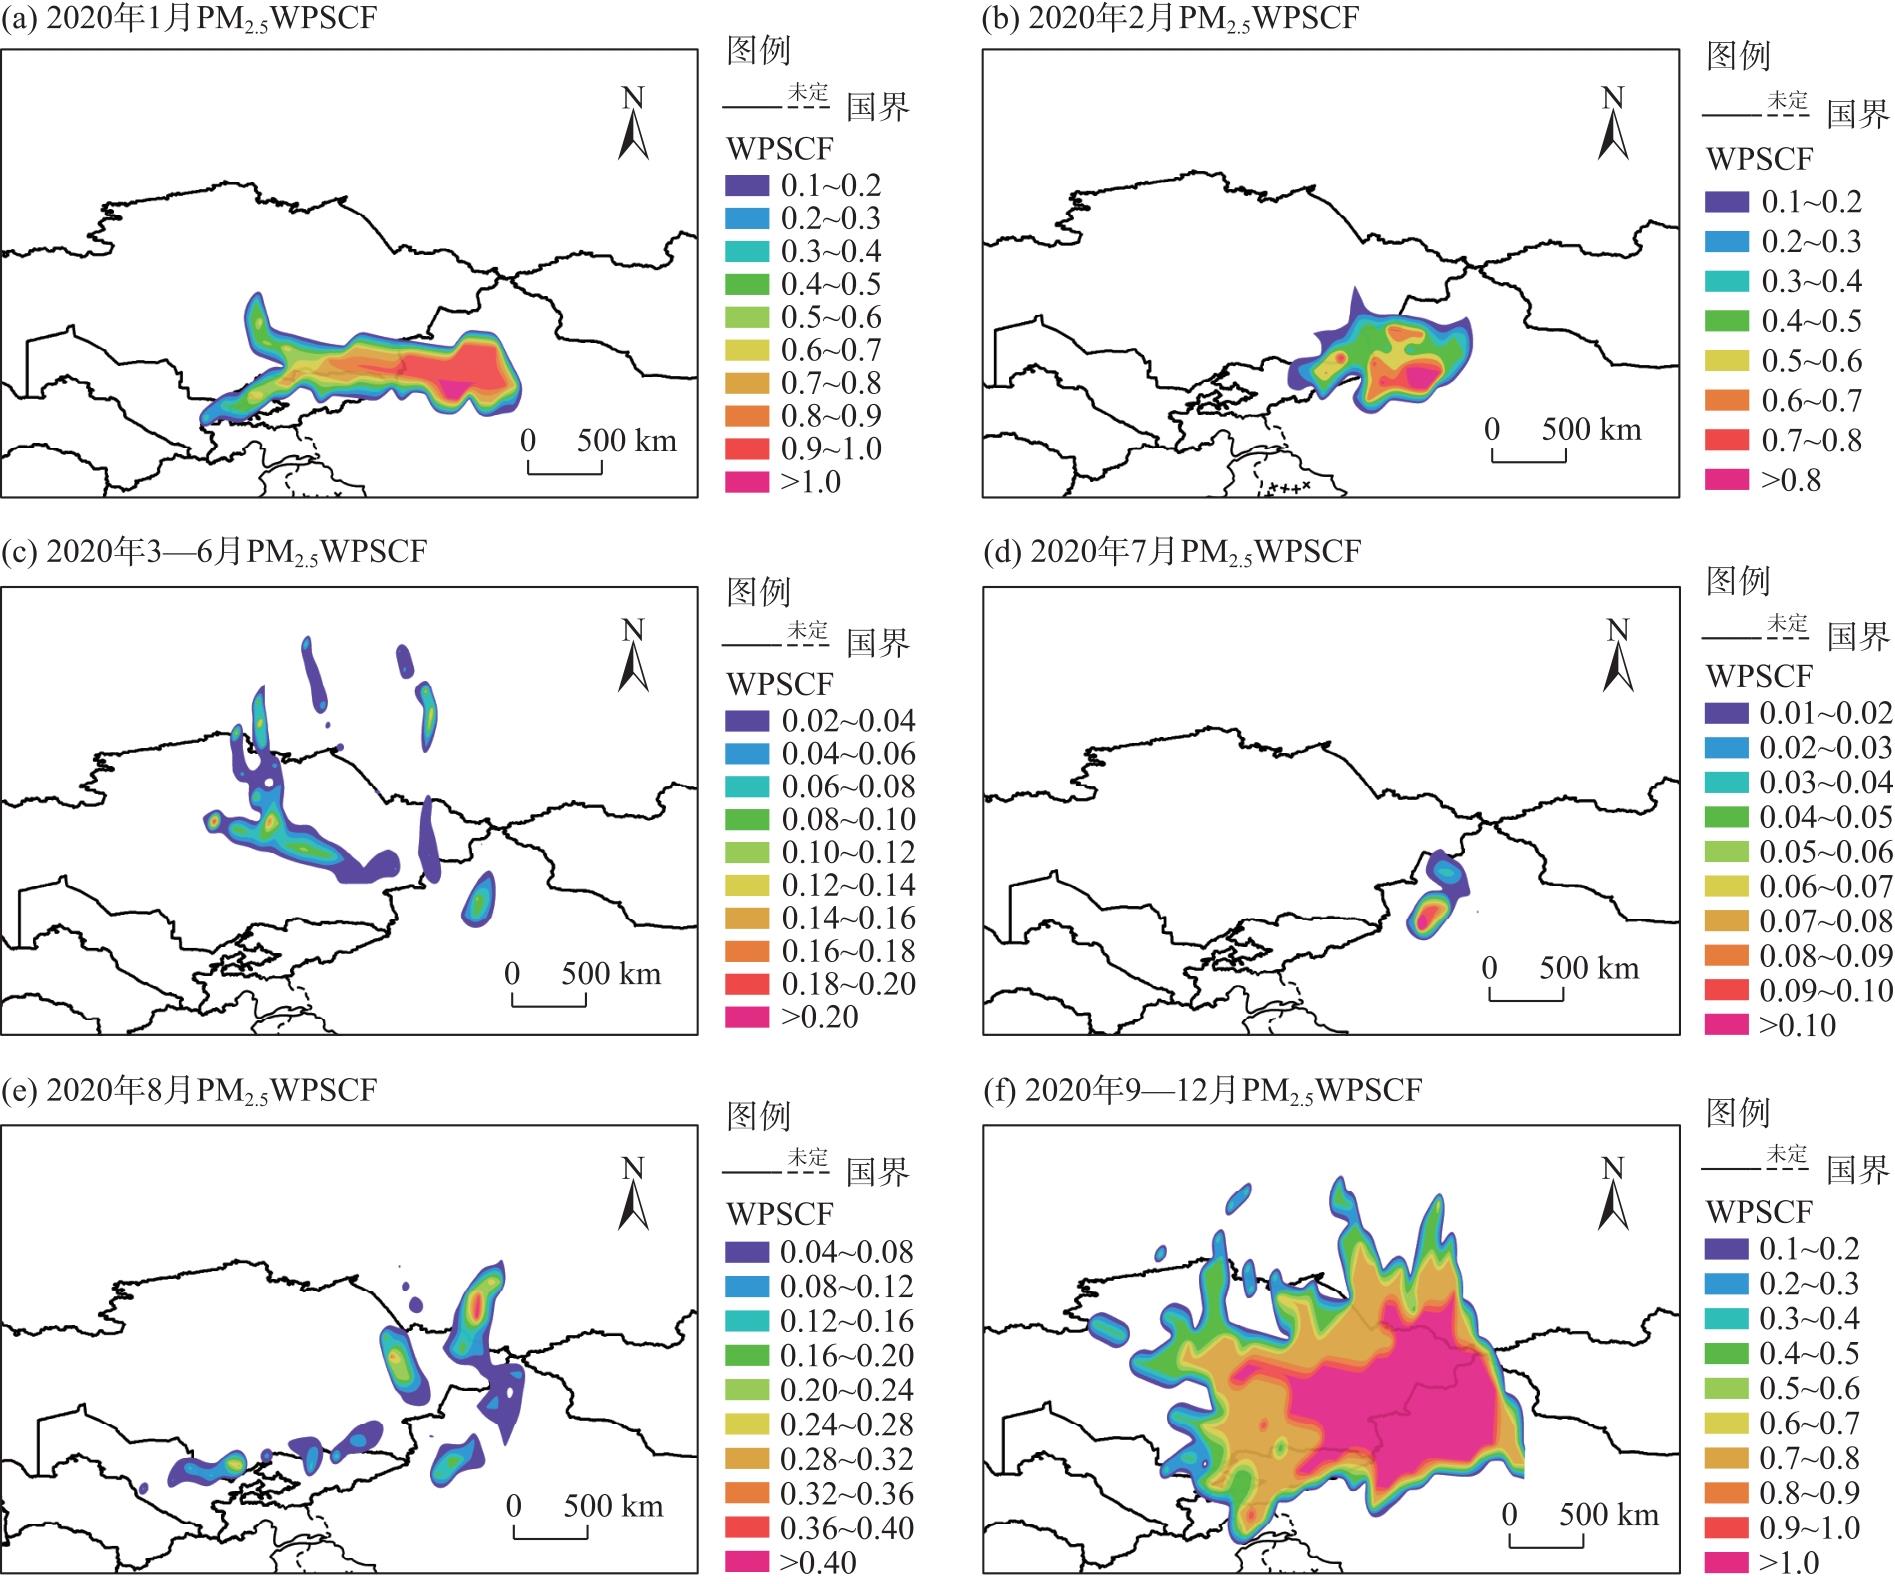
图11
2020年“乌-昌-石”城市群PM10潜在源区贡献月分布"
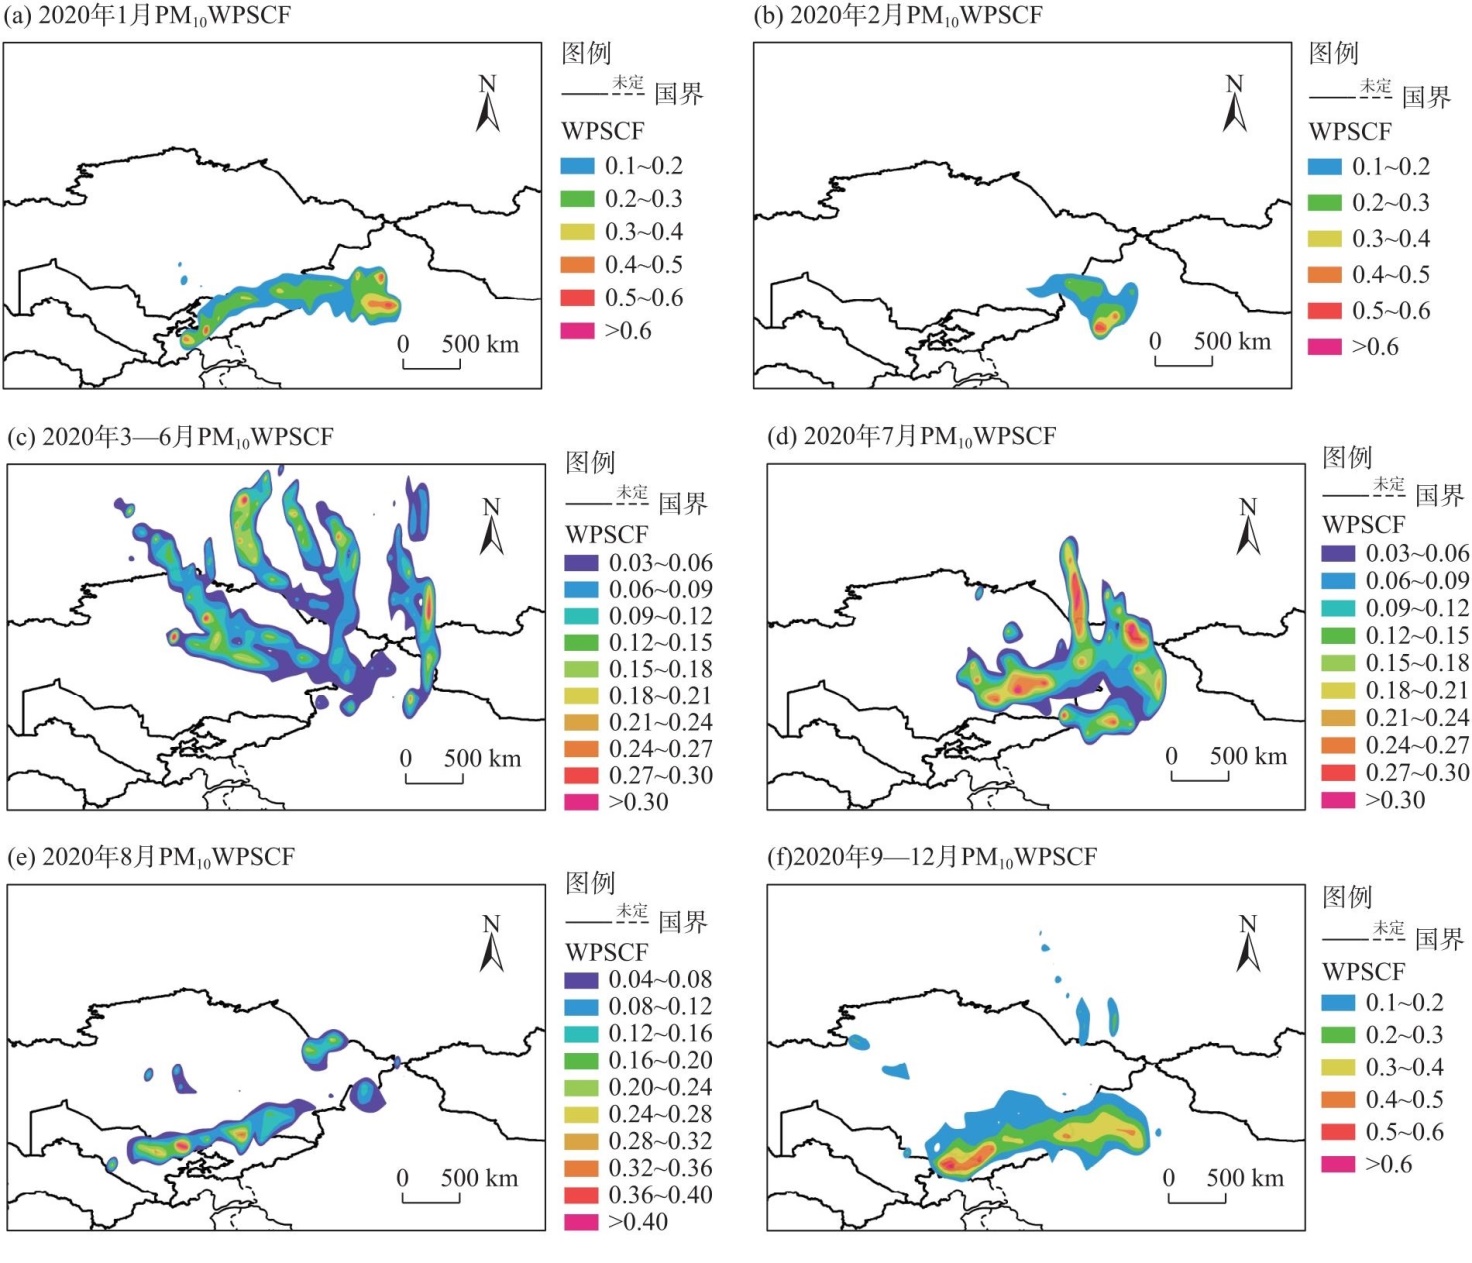
图12
2019—2021年“乌-昌-石”城市群PM2.5与PM10浓度权重轨迹分布 注:WCWT为经过加权后的浓度加权轨迹值。下同。"
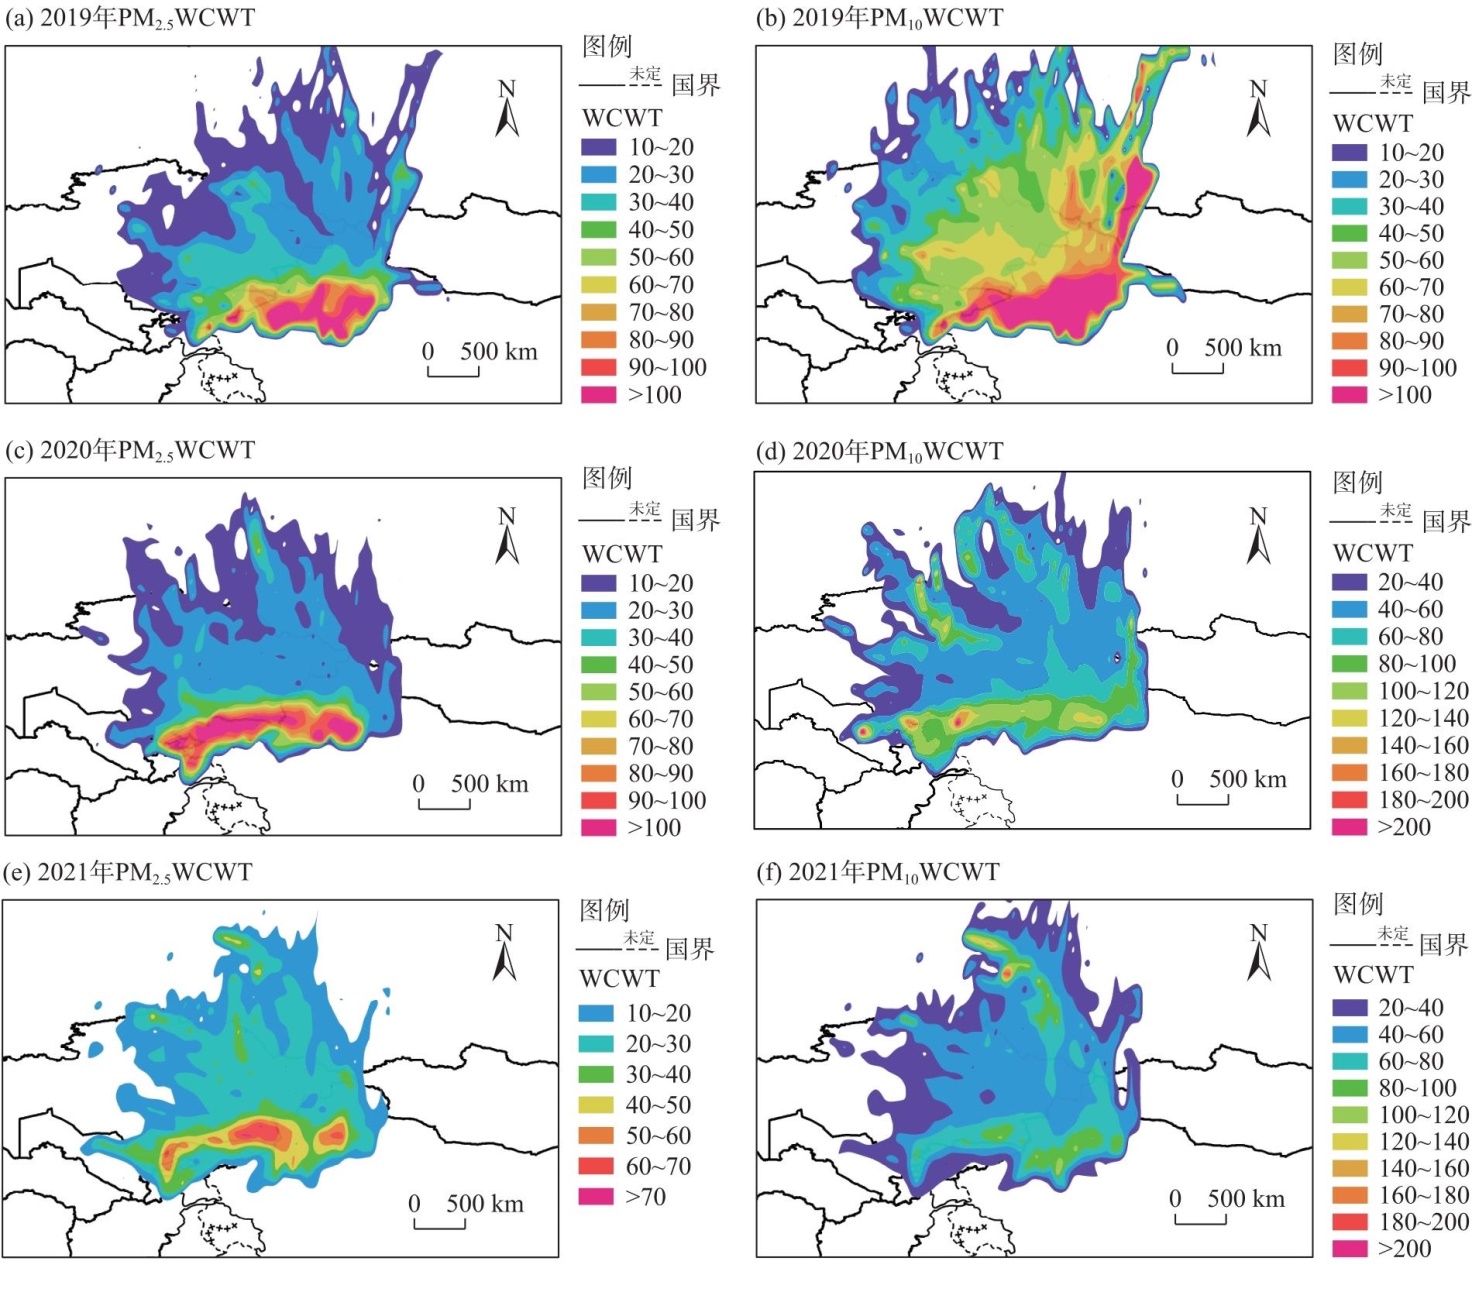
图13
2020年“乌-昌-石”城市群PM2.5浓度权重轨迹月分布"
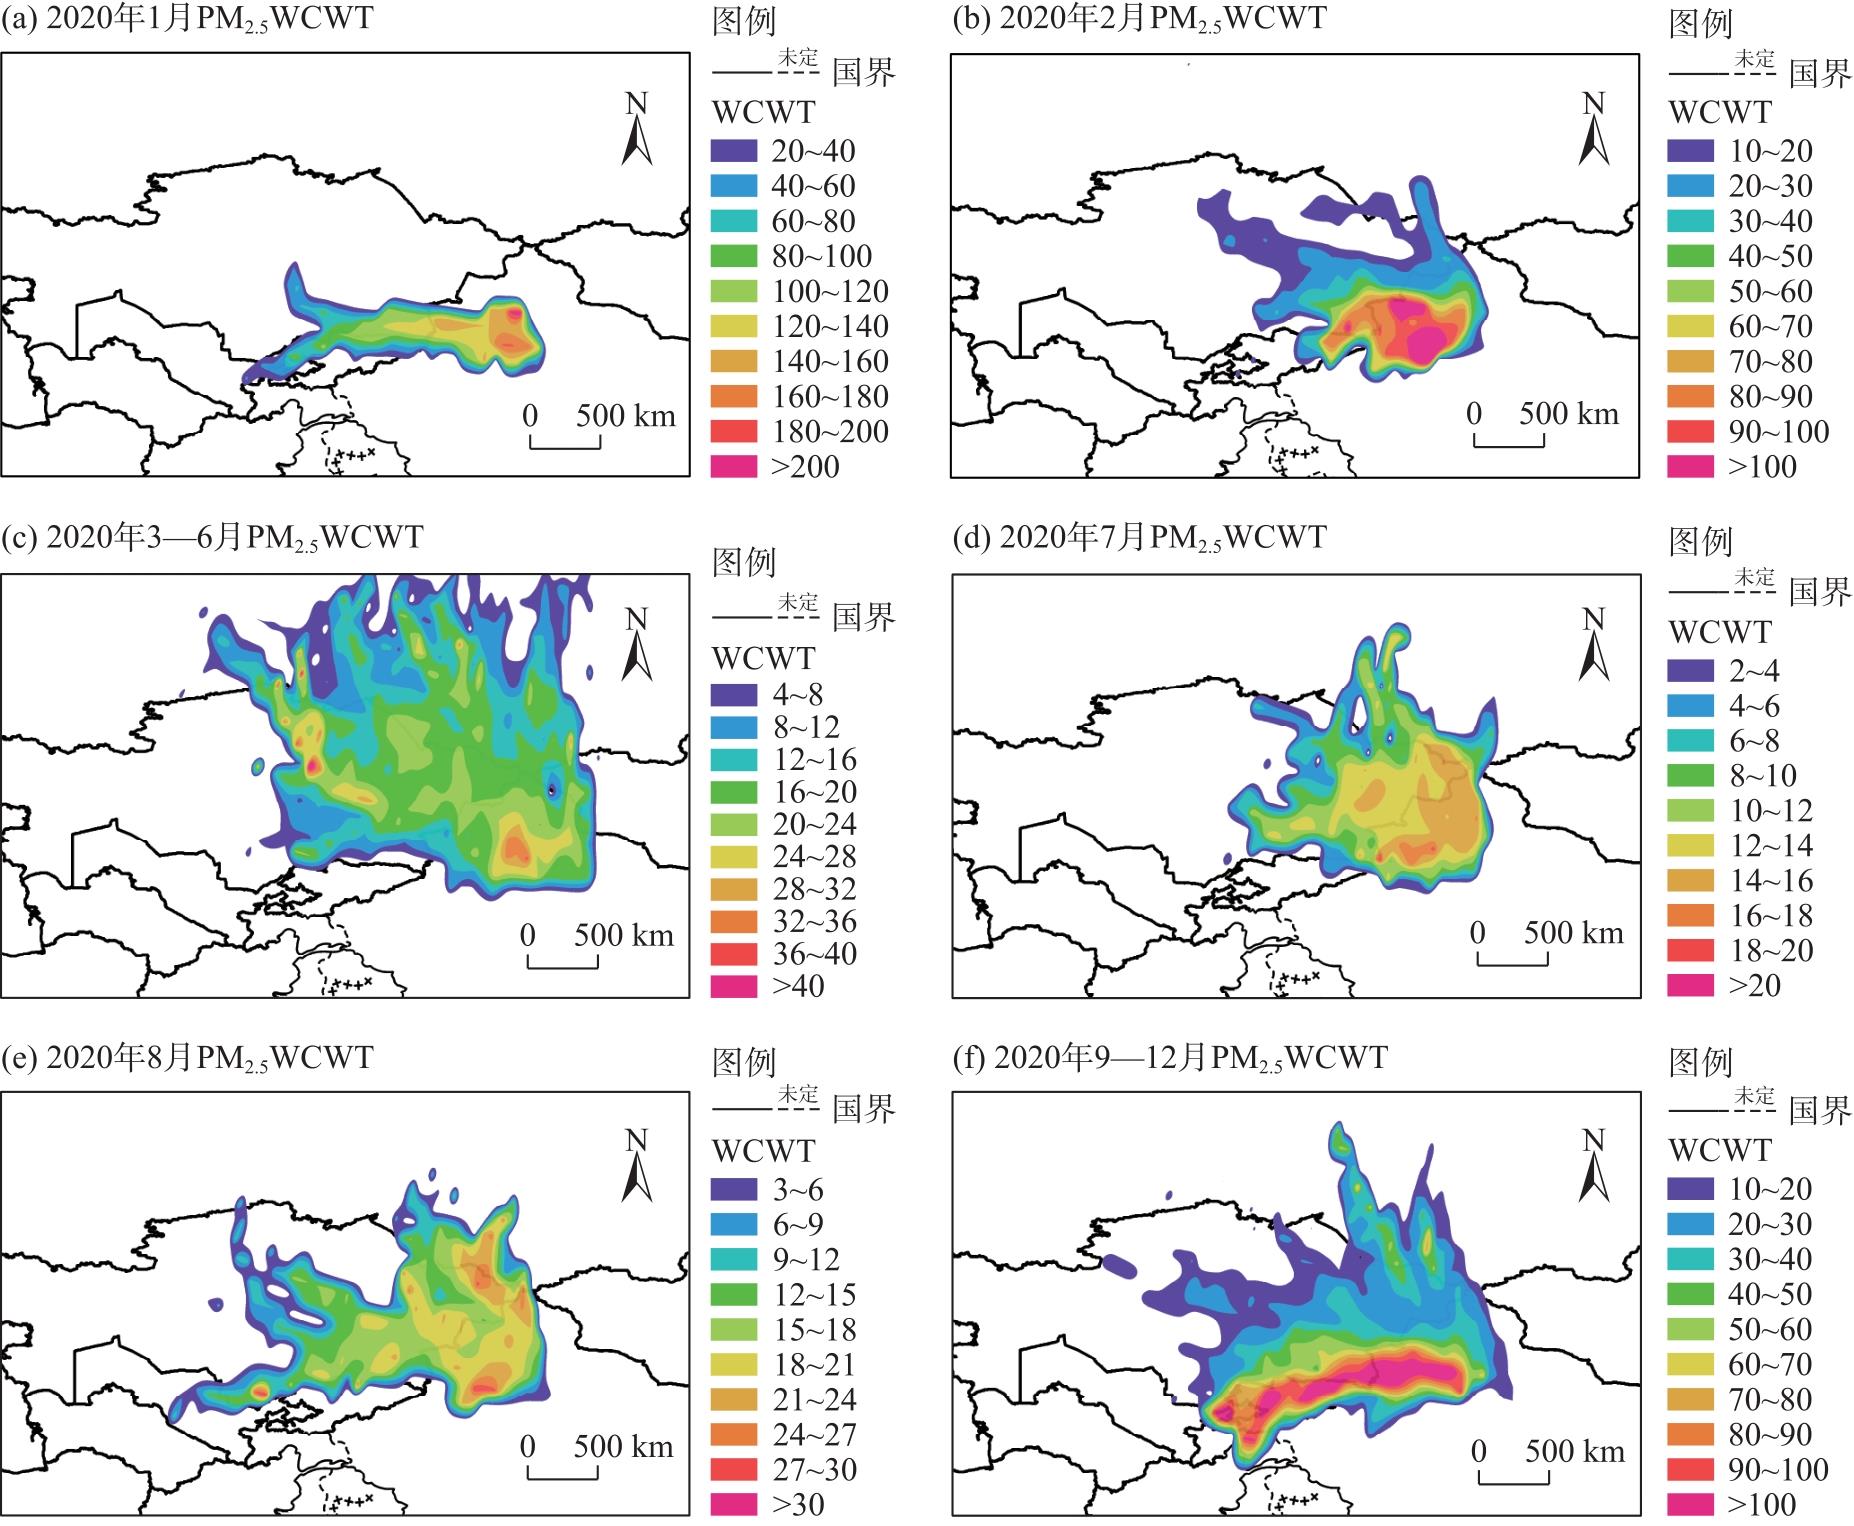
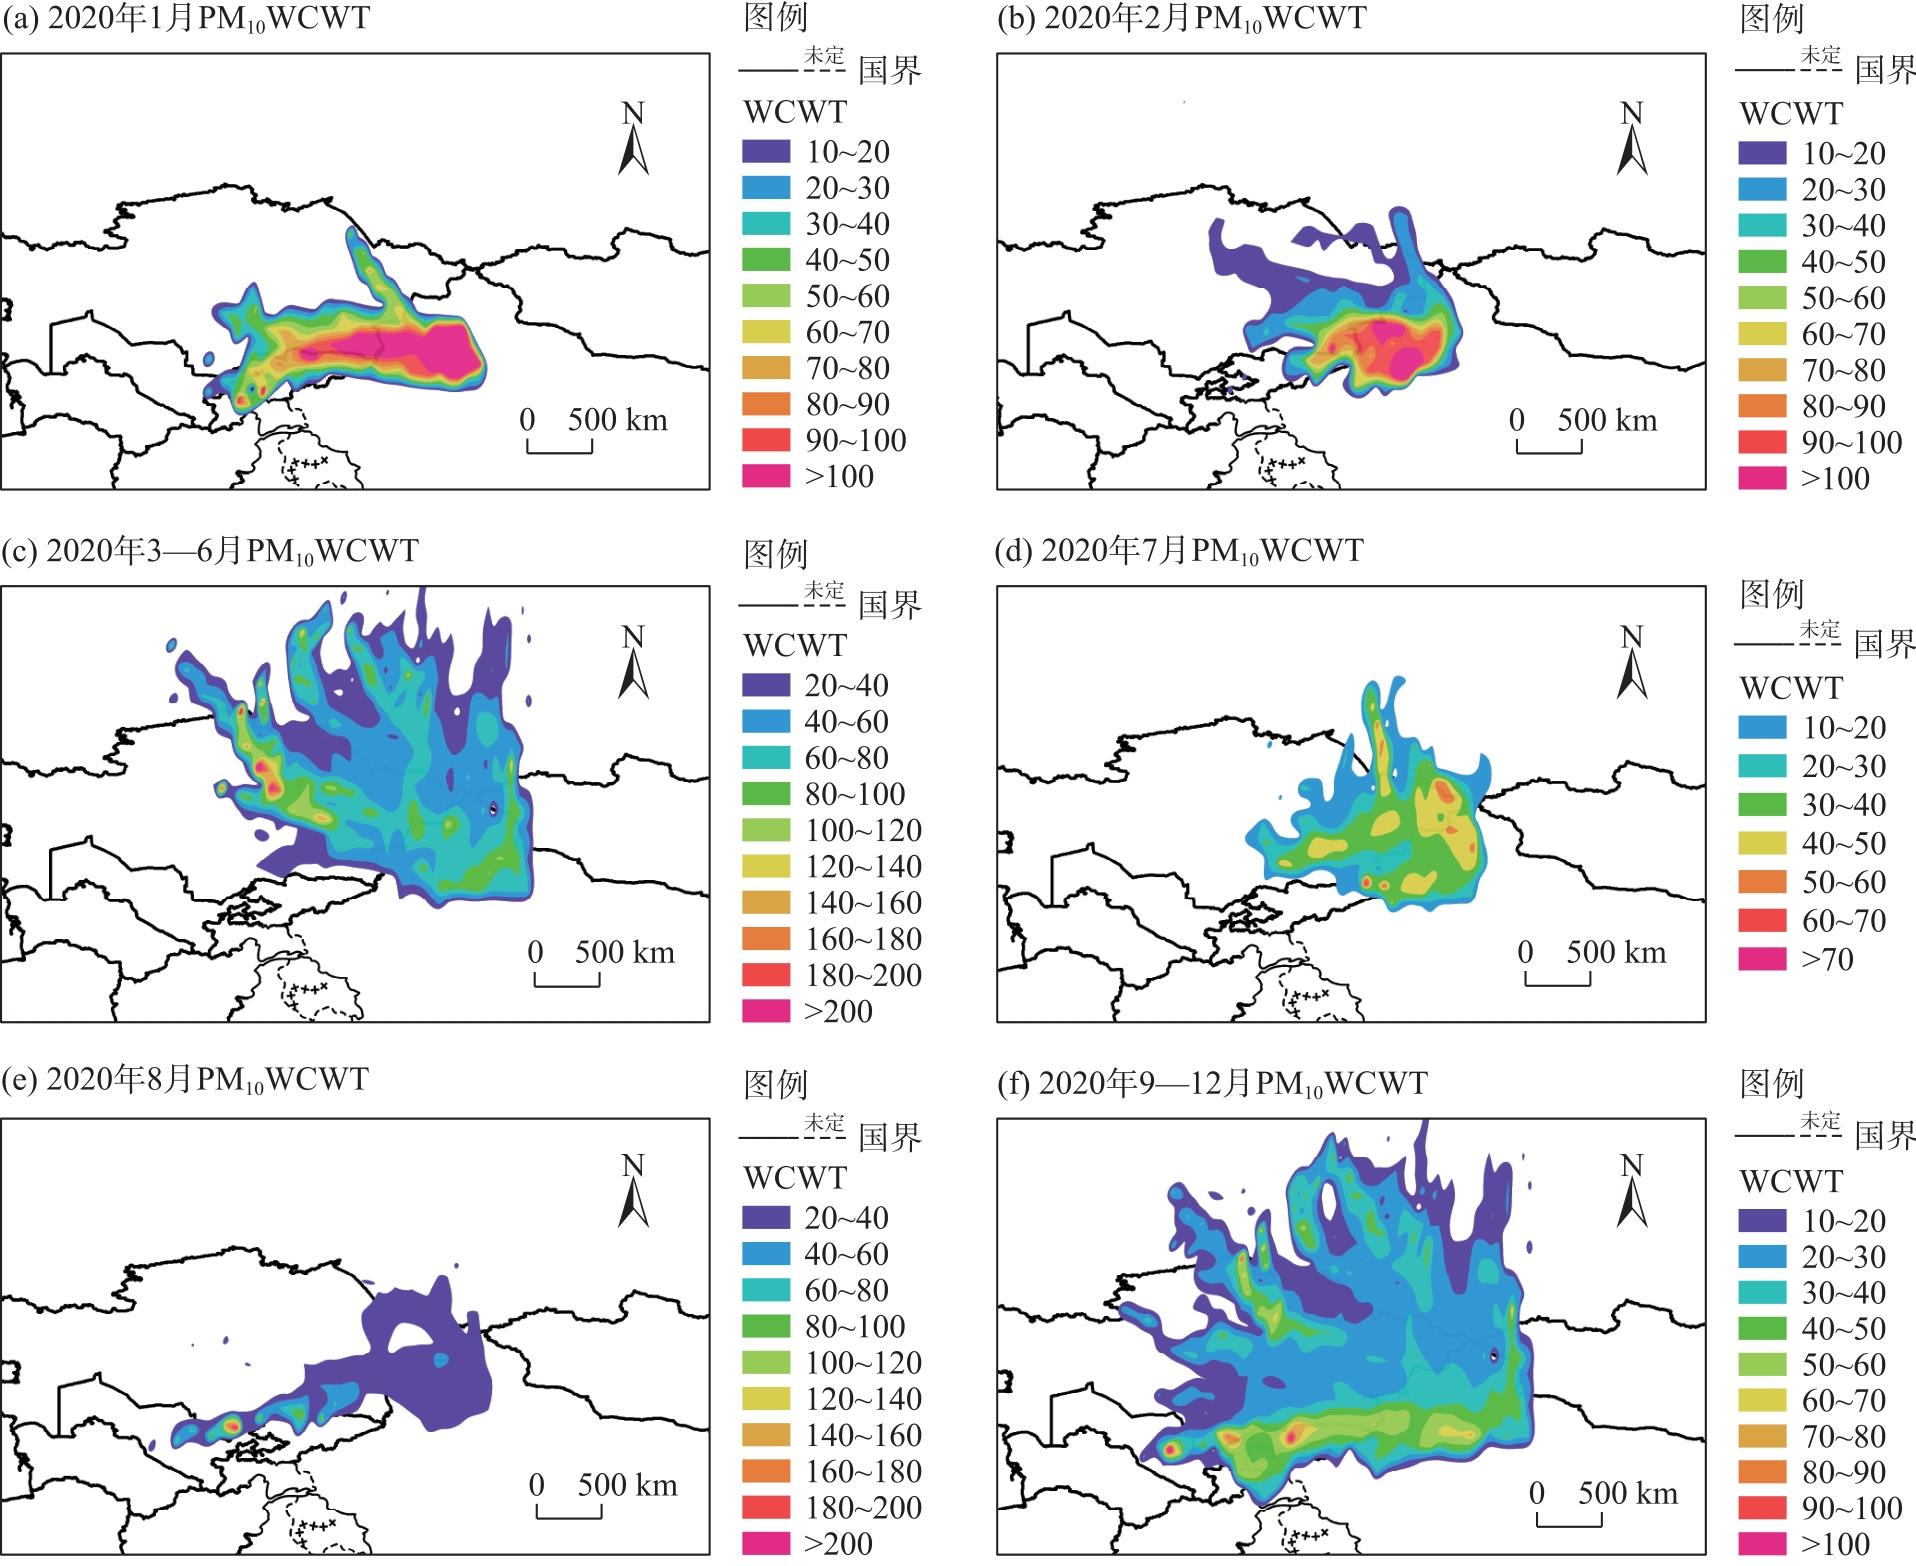
图14
2020年“乌-昌-石”城市群PM10浓度权重轨迹月分布"
| [1] | Gao X, Li W D. A graph-based LSTM model for PM2.5 forecasting[J]. Atmospheric Pollution Research, 2021, 12(9): 101150, doi: 10.1016/j.apr.2021.101150. |
| [2] | Guo X H, Wang Y F, Mei S Q, et al. Monitoring and modelling of PM2.5 concentration at subway station construction based on IoT and LSTM algorithm optimization[J]. Journal of Cleaner Production, 2022, 360: 132179, doi: 10.1016/j.jclepro.2022.132179. |
| [3] |
慕石雷, 杨玉欢, 乌日陶克套胡. 黄河流域五大城市群PM2.5时空演变与影响因素探讨[J]. 干旱区地理, 2024, 47(4): 707-719.
doi: 10.12118/j.issn.1000-6060.2023.088 |
|
[Mu Shilei, Yang Yuhuan, Wuritaoketaohu. Spatiotemporal evolution and influencing factors of PM2.5 in the five major urban agglomerations in the Yellow River Basin[J]. Arid Land Geography, 2024, 47(4): 707-719. ]
doi: 10.12118/j.issn.1000-6060.2023.088 |
|
| [4] | Shamsollahi H R, Yunesian M, Kharrazi S, et al. Characterization of persistent materials of deposited PM2.5 in the human lung[J]. Chemosphere, 2022, 301: 134774, doi: 10.1016/j.chemosphere.2022.134774. |
| [5] | Wu Y Y, Zhang T, Wang Y Y, et al. Spatial heterogeneity in health risks of illness-related absenteeism associated with PM2.5 exposure for elementary students[J]. Environmental Research, 2022, 212: 113473, doi: 10.1016/j.envres.2022.113473. |
| [6] | Bu X, Xie Z L, Liu J, et al. Global PM2.5-attributable health burden from 1990 to 2017: Estimates from the global burden of disease study 2017[J]. Environmental Research, 2021(1): 111123, doi: 10.1016/j.envres.2021.111123. |
| [7] | 刘稳, 詹庆明, 邱春迪, 等. 基于精细监测的襄阳冬夏季颗粒物污染时空变化研究[J]. 环境科学与技术, 2023, 46(增刊1): 8-18. |
| [Liu Wen, Zhan Qingming, Qiu Chundi, et al. Spatio-temporal variations of PM2.5 and PM10 pollution in winter and summer: A case of Xiangyang, China[J]. Environmental Science & Technology, 2023, 46(Suppl. 1): 8-18. ] | |
| [8] | Ning G, Yim S H L, Yang Y, et al. Modulations of synoptic and climatic changes on ozone pollution and its health risks in mountain-basin areas[J]. Atmospheric Environment, 2020, 240: 117808, doi: 10.1016/j.atmosenv.2020.117808. |
| [9] | 徐勇, 郭振东, 郑志威, 等. 2000—2021年成渝城市群PM2.5时空变化及驱动机制多维探测[J]. 环境科学, 2023, 44(7): 3724-3737. |
| [Xu Yong, Guo Zhendong, Zheng Zhiwei, et al. Spatio-temporal variation and multi-dimensional detection of driving mechanism of PM2.5 concentration in the Chengdu-Chongqing urban agglomeration from 2000 to 2021[J]. Environmental Science, 2023, 44(7): 3724-3737. ] | |
| [10] | 肖致美, 李亚菲, 高璟赟, 等. 2013—2020年天津市PM2.5-O3污染变化趋势和影响因素分析[J]. 环境科学, 2023, 44(8): 4211-4219. |
| [Xiao Zhimei, Li Yafei, Gao Jingyun, et al. Analysis of change trend and influencing factors of PM2.5-O3pollution in Tianjin from 2013 to 2020[J]. Environmental Science, 2023, 44(8): 4211-4219. ] | |
| [11] | Li S, Zhou C H, Qu M X. Spatiotemporal variations and mechanism of PM2.5 pollution in urban area: The case of Guiyang, Guizhou, China[J]. Journal of Environmental Management, 2023, 341: 118030, doi: 10.1016/j.jenvman.2023.118030. |
| [12] | 李乐, 刘旻霞, 肖仕锐, 等. 山东半岛近地面O3浓度时空变化及潜在源区解析[J]. 环境科学, 2022, 43(3): 1256-1267. |
| [Li Le, Liu Minxia, Xiao Shirui, et al. Temporal and spatial variation in O3 concentration near the surface of Shandong Peninsula and analysis of potential source areas[J]. Environmental Science, 2022, 43(3): 1256-1267. ] | |
| [13] | 石小翠. 乌鲁木齐市大气PM2.5的化学组分特征及来源分析[D]. 乌鲁木齐: 新疆农业大学, 2021. |
| [Shi Xiaocui. Analysis of chemical composition characteristics and sources of atmospheric PM2.5 in Urumqi[D]. Urumqi: Xinjiang Agricultural University, 2021. ] | |
| [14] | 苗云阁. 新疆南缘沙尘季与非沙尘季大气颗粒物组分特征分析[D]. 天津: 天津师范大学, 2017. |
| [Miao Yunge. Analysis of atmospheric particulate matter composition characteristics during cust storm and non-dust storm seasons in the southern margin of Xinjiang[D]. Tianjin: Tianjin Normal University, 2017. ] | |
| [15] | Salvador P, Artíñano B, Viana M, et al. Spatial and temporal variations in PM10 and PM2.5 across Madrid metropolitan area in 1999—2008[J]. Procedia Environmental Sciences, 2011, 4(10): 198-208. |
| [16] | Othman M, Latif M T, Hamid H H A, et al. Spatial-temporal variability and health impact of particulate matter during a 2019—2020 biomass burning event in Southeast Asia[J]. Scientific Reports, 2022, 12(1): 7630, doi: 10.1038/s41598-022-11409-z. |
| [17] |
Pengchai P, Chantara S, Sopajaree K, et al. Seasonal variation, risk assessment and source estimation of PM10and PM10-bound PAHs in the ambient air of Chiang Mai and Lamphun, Thailand[J]. Environmental Monitoring and Assessment, 2009, 154: 197-218.
doi: 10.1007/s10661-008-0389-0 pmid: 18688736 |
| [18] | 易唯. 2018年天山北坡经济带PM2.5浓度时空分布特征及其气象影响因素[D]. 兰州: 西北师范大学, 2021. |
| [Yi Wei. Temporal and spatial distribution characteristics of PM2.5 concentrations in the Tianshan north slope economic belt in 2018 and their meteorological influencing factors[D]. Lanzhou: Northwest Normal University, 2021. ] | |
| [19] | 付正辉, 刘婷, 汤烨, 等. 乌昌地区大气污染成因分析及应对措施研究[J]. 环境科学与管理, 2013, 38(12): 35-39. |
| [Fu Zhenghui, Liu Ting, Tang Ye, et al. Analysis on cause of atmospheric pollution and control measures in Wuchang region[J]. Environmental Science and Management, 2013, 38(12): 35-39. ] | |
| [20] | 安欣欣, 曹阳, 王琴, 等. 北京城区PM2.5各组分污染特征及来源分析[J]. 环境科学, 2022, 43(5): 2251-2261. |
| [An Xinxin, Cao Yang, Wang Qin, et al. Chemical characteristics and source apportionment of PM2.5 in urban area of Beijing[J]. Environmental Science, 2022, 43(5): 2251-2261. ] | |
| [21] | Wei J, Li Z Q, Lyapustin A, et al. Reconstructing 1-km-resolution high-quality PM2.5 data records from 2000 to 2018 in China: Spatiotemporal variations and policy implications[J]. Remote Sensing of Environment, 2021, 252: 112136, doi: 10.1016/j.rse.2020.112136. |
| [22] | Wei J, Li Z Q, Cribb M, et al. Improved 1-km-resolution PM2.5 estimates across China using enhanced space-time extremely randomized trees[J]. Atmospheric Chemistry and Physics, 2020, 20(6): 3273-3289. |
| [23] | 范圣虎, 刘宁, 张飞云. 乌鲁木齐大气污染“周末效应”特征及其变化趋势分析[J]. 新疆环境保护, 2021, 43(2): 1-7. |
| [Fan Shenghu, Liu Ning, Zhang Feiyun. Analysis of the “weekend effect” characteristics and trend of air pollution in Urumqi[J]. Xinjiang Environmental Protection, 2021, 43(2): 1-7. ] | |
| [24] |
李志鹏, 陈健. 基于GOCI卫星的大气细颗粒物PM2.5的遥感反演及其时空分布规律研究[J]. 遥感技术与应用, 2020, 35(1): 163-173.
doi: 10.11873/j.issn.1004-0323.2020.1.0163 |
| [Li Zhipeng, Chen Jian. Remote sensing retrieval of atmospheric fine particle PM2.5 based on GOCI satellite and its temporal and spatial distribution[J]. Remote Sensing Technology and Application, 2020, 35(1): 163-173. ] | |
| [25] | 刁春娜. 乌昌地区大气颗粒物中主要污染物的监测与其污染特征的探讨[D]. 乌鲁木齐: 新疆大学, 2006. |
| [Diao Chunna. Monitoring and exploration of major pollutant characteristics in atmospheric particulate matter of the Wu-Chang region[D]. Urumqi: Xinjiang University, 2006. ] | |
| [26] | 郝巨飞, 齐佳慧, 李永占, 等. 邢台市颗粒污染物变化特征和后向轨迹分析[J]. 中国环境监测, 2018, 34(5): 46-53. |
| [Hao Jufei, Qi Jiahui, Li Yongzhan, et al. Variability characteristics and backward trajectory analysis of particulate pollutants in Xingtai City[J]. Chinese Environmental Monitoring, 2018, 34(5): 46-53. ] | |
| [27] | 张芊, 庞可, 马彩云, 等. 甘肃地区春冬季颗粒物输送路径及潜在源分析——基于HYSPLIT4模式及TraPSA分析平台[J]. 中国环境科学, 2022, 42(2): 509-518. |
| [Zhang Qian, Pang Ke, Ma Caiyun, et al. Analysis of transportation path and potential sources of atmospheric particulate matter over Gansu Province in spring and winter: Based on HYSPLIT4 model and TraPSA analysis platform[J]. China Environmental Science, 2022, 42(2): 509-518. ] | |
| [28] | Zhao Q W, He Q, Jin L L, et al. Potential source regions and transportation pathways of reactive gases at a regional background site in northwestern China[J]. Advances in Meteorology, 2021, 2021(1): 9933466, doi: 10.1155/2021/9933466. |
| [29] | 符传博, 丹利, 唐家翔, 等. 基于轨迹模式分析海口市大气污染的输送及潜在源区[J]. 环境科学学报, 2020, 40(1): 36-42. |
| [Fu Chuanfu, Dan Li, Tang Jiaxiang, et al. Analysis of air polluted transportation and potential source in Haikou City based on trajectory model[J]. Acta Scientiae Circumstantiae, 2020, 40(1): 36-42. ] | |
| [30] | 任浦慧, 解静芳, 姜洪进, 等. 太原市大气PM2.5季节传输路径和潜在源分析[J]. 中国环境科学, 2019, 39(8): 3144-3151. |
| [Ren Puhui, Xie Jingfang, Jiang Hongjin, et al. Transport pathways and potential sources of PM2.5 in different seasons in Taiyuan City[J]. China Environmental Science, 2019, 39(8): 3144-3151. ] | |
| [31] | 王郭臣, 王珏, 信玉洁, 等. 天津PM10和NO2输送路径及潜在源区研究[J]. 中国环境科学, 2014, 34(12): 3009-3016. |
| [Wang Guochen, Wang Jue, Xin Yujie, et al. Transportation pathways and potential source areas of PM10 and NO2 in Tianjin[J]. China Environmental Science, 2014, 34(12): 3009-3016. ] | |
| [32] | Hopke P K, Gao N, Cheng M D. Combining chemical and meteorological data to infer source areas of airborne pollutants[J]. Chemometrics and Intelligent Laboratory Systems, 1993, 19(2): 187-199. |
| [33] | Zeng Y, Hopke P K. A study of the sources of acid precipitation in Ontario, Canada[J]. Atmospheric Environment, 1989, 23(7): 1499-1509. |
| [34] | Seibert P, Kromp-Kolb H, Baltensperger U, et al. Trajectory analysis of aerosol measurements at high alpine sites[J]. Transport and Transformation of Pollutants in the Troposphere, 1994, 15(9): 689-693. |
| [35] | Hsu Y K, Holsen T M, Hopke P K. Comparison of hybrid receptor models to locate PCB sources in Chicago[J]. Atmospheric Environment, 2003, 37(4): 545-562. |
| [36] | 孙明霞. 五家渠市空气质量的影响因素及预测研究[D]. 石河子: 石河子大学, 2016. |
| [Sun Mingxia. Air quality influence factors and trend forecasting in the Wujiaqu[D]. Shihezi: Shihezi University, 2016. ] | |
| [37] | 冯海英. 疫情防控措施对乌鲁木齐市大气颗粒物浓度及分布影响分析[J]. 环境污染与防治, 2021, 43(5): 606-610. |
| [Feng haiying. Impact of epidemic prevention and control measures on atmospheric particulate concentration and distribution in Urumqi[J]. Environmental Pollution & Control, 2021, 43(5): 606-610. ] | |
| [38] |
李淑婷, 李霞, 毛列尼·阿依提看, 等. 2017—2019年中天山北坡城市群大气污染及污染天气类型特征[J]. 干旱区地理, 2022, 45(4): 1082-1092.
doi: 10.12118/j.issn.1000-6060.2021.443 |
|
[Li Shuting, Li Xia, Ayikan Mauren, et al. Characteristics of air pollution and its polluted weather types of urban agglomeration on the north slope of the middle Tianshan Mountains from 2017 to 2019[J]. Arid Land Geography, 2022, 45(4): 1082-1092. ]
doi: 10.12118/j.issn.1000-6060.2021.443 |
|
| [39] | 雷瑜, 张小玲, 唐宜西, 等. 北京城区PM2.5及主要污染气体“周末效应”和“假日效应”研究[J]. 环境科学学报, 2015, 35(5): 1520-1528. |
| [Lei Yu, Zhang Xiaoling, Tang Yixi, et al. Holiday effects on PM2.5 and other major pollutants in Beijing[J]. Acta Scientiae Circumstantiae, 2015, 35(5): 1520-1528. ] | |
| [40] | 刘宁, 张飞云, 范圣虎. 乌鲁木齐市“十三五”期间环境空气质量变化及污染原因分析[J]. 新疆环境保护, 2021, 43(3): 17-25. |
| [Liu Ning, Zhang Feiyun, Fan Shenghu. Analysis on change of air quality and cause of pollution in Urumqi City during the 13th Five-Year Plan period[J]. Environmental Protection of Xinjiang, 2021, 43(3): 17-25. ] |
| [1] | 马启民, 杜函芮, 王峥铭, 龙银平. 鄂尔多斯高原十大孔兑不同地貌地形的植被覆盖特征分析[J]. 干旱区地理, 2025, 48(3): 434-443. |
| [2] | 李康宁, 林伊琳, 赵俊三, 王健, 葛峰. 三江源植被覆盖变化驱动机制及生态脆弱性分析[J]. 干旱区地理, 2025, 48(2): 283-295. |
| [3] | 张海东, 李崇博, 孟李奇, 阿地来·赛提尼亚孜, 巨喜锋. 喀什三角洲NDVI演变特征及其对气候的响应[J]. 干旱区地理, 2025, 48(2): 296-307. |
| [4] | 李红阳, 陈天宇, 王圣杰, 张明军. 1979—2021年新疆昆仑山北坡潜在蒸散时空变化研究[J]. 干旱区地理, 2024, 47(9): 1443-1450. |
| [5] | 张顺伟, 周自翔, 熊炫晨, 周杰. 基于WRF模式的无定河流域极端气候特征分析[J]. 干旱区地理, 2024, 47(9): 1482-1495. |
| [6] | 张璐, 孙美平, 闫欣, 王伟生, 范蕊谊. 基于多源数据的昆仑山北坡地表太阳辐射调查评估[J]. 干旱区地理, 2024, 47(8): 1304-1313. |
| [7] | 姜萍, 袁野. 新疆植被总初级生产力对大气水分亏缺的响应[J]. 干旱区地理, 2024, 47(3): 403-412. |
| [8] | 孟宪文, 曹君, 薛占金. 黄土高原矿区生态系统服务价值的时空变化——以平朔矿区为例[J]. 干旱区地理, 2024, 47(3): 455-464. |
| [9] | 包微, 黄晓军, 纪王迪. 关中地区高温脆弱性评估及其时空变化研究[J]. 干旱区地理, 2024, 47(11): 1863-1875. |
| [10] | 康利刚, 曹生奎, 曹广超, 严莉, 陈链璇, 李文斌, 赵浩然. 青海湖流域地表温度时空变化特征研究[J]. 干旱区地理, 2023, 46(7): 1084-1097. |
| [11] | 夏文浩, 王铭扬, 姜磊. 新疆农业碳排放强度时空变化趋势与收敛分析[J]. 干旱区地理, 2023, 46(7): 1145-1154. |
| [12] | 陈跃萍, 武胜利, 赵昕, 张艺加. 近60 a哈密市极端气温时空变化特征[J]. 干旱区地理, 2023, 46(6): 868-879. |
| [13] | 张勇军, 杨余辉, 胡义成, 冯先成, 杨景燕. 新疆喀什河流域水化学时空变化特征及灌溉适应性评价[J]. 干旱区地理, 2023, 46(4): 583-594. |
| [14] | 李娜,武永利,赵桂香,钱锦霞,李芬,赵海英,韩普. 近60 a山西省极端气温事件的年际变化及其对区域增暖的响应[J]. 干旱区地理, 2023, 46(3): 337-348. |
| [15] | 任涛涛,李双双,段克勤,何锦屏. 黄土高原热浪型和缺水型骤旱时空变化特征及其影响因素[J]. 干旱区地理, 2023, 46(3): 360-370. |
| Viewed | ||||||||||||||||||||||||||||||||||||||||||||||||||
|
Full text 25
|
|
|||||||||||||||||||||||||||||||||||||||||||||||||
|
Abstract 58
|
|
|||||||||||||||||||||||||||||||||||||||||||||||||
Cited |
|
|||||||||||||||||||||||||||||||||||||||||||||||||
| Shared | ||||||||||||||||||||||||||||||||||||||||||||||||||
|
||