- 2025年4月15日 星期二
干旱区地理 ›› 2022, Vol. 45 ›› Issue (4): 1320-1331.doi: 10.12118/j.issn.1000-6060.2021.533 cstr: 32274.14.ALG2021533
• 区域发展 • 上一篇
王钰凯1,2( ),郭辉1,2()
收稿日期:2021-11-12
修回日期:2022-01-14
出版日期:2022-07-25
发布日期:2022-08-11
作者简介:王钰凯(1995-),男,硕士研究生,主要从事产业经济研究. E-mail: 基金资助:
WANG Yukai1,2(),GUO Hui1,2()
Received:2021-11-12
Revised:2022-01-14
Published:2022-07-25
Online:2022-08-11
摘要:
为揭示新疆旅游业生态效率的时序变化、空间差异及来源、动态演进和收敛性情况,运用非期望产出的强有效前沿最近距离(MinDS)模型测度其效率水平,使用ArcGIS技术、Dagum基尼系数及其分解方法和核密度估计等工具探究2005—2019年其时空分异格局,并构建收敛模型验证其空间收敛性。结果表明:新疆旅游业生态效率呈现出波动稳定上升的“北高南低”的时空分布演化格局,存在β绝对收敛、β条件收敛和俱乐部收敛现象且条件收敛速度显著快于绝对收敛。近15 a新疆各地州市处于Ⅰ级所占比例趋于升高,整体基尼系数存在周期性、波动性特点,区域间差异是旅游业生态效率空间差异的主要来源。新疆整体和北疆的旅游业生态效率存在绝对差异缩小和两极分化特征,而南疆和东疆各区域存在绝对差异扩大趋势。因此,未来协调南疆、北疆和东疆各区域内的旅游业生态效率是实现新疆整体旅游业高质量发展的工作重心。
王钰凯,郭辉. 新疆旅游业生态效率时空分异与收敛性研究[J]. 干旱区地理, 2022, 45(4): 1320-1331.
WANG Yukai,GUO Hui. Spatial and temporal differentiation and convergence studies of the eco-efficiency of Xinjiang tourism industry[J]. Arid Land Geography, 2022, 45(4): 1320-1331.
表1
新疆旅游业生态效率测度指标体系构建"
| 指标类型 | 一级指标 | 二级指标 |
|---|---|---|
| 投入指标 | 资源投入 | A级及以上旅游景区数量/个 |
| 旅行社数量/个 | ||
| 星级宾馆数量/个 | ||
| 资本投入 | 旅游业固定资产投资额/108元 | |
| 能源投入 | 旅游能源(标准煤)消耗总量/104 t | |
| 人力投入 | 旅游产业就业人数/人 | |
| 产出指标 | 期望产出 | 旅游总人数/104人 |
| 旅游总消费/108元 | ||
| 非期望产出 | 旅游环境污染指数/% |
表2
2005—2019年新疆旅游业生态效率测算结果"
| 年份 | 乌鲁木齐市 | 克拉玛依市 | 吐鲁番市 | 哈密市 | 昌吉州 | 伊犁州直 | 塔城地区 | 阿勒泰地区 | 博州 | 巴州 | 阿克苏地区 | 克州 | 喀什地区 | 和田地区 | 均值 |
|---|---|---|---|---|---|---|---|---|---|---|---|---|---|---|---|
| 2005 | 0.722 | 0.033 | 0.236 | 0.160 | 0.011 | 0.419 | 0.097 | 0.285 | 0.012 | 0.188 | 0.288 | 0.092 | 0.179 | 0.162 | 0.197 |
| 2006 | 1.013 | 0.016 | 0.268 | 0.184 | 0.029 | 0.317 | 0.150 | 0.380 | 0.022 | 0.323 | 0.523 | 0.086 | 0.170 | 0.080 | 0.223 |
| 2007 | 1.033 | 0.037 | 1.076 | 0.175 | 0.003 | 0.412 | 0.068 | 1.088 | 0.023 | 0.496 | 0.796 | 0.089 | 0.212 | 0.086 | 0.347 |
| 2008 | 1.127 | 0.028 | 0.403 | 0.203 | 0.003 | 0.388 | 0.112 | 0.573 | 0.036 | 0.573 | 0.973 | 0.098 | 0.169 | 0.090 | 0.274 |
| 2009 | 0.446 | 0.016 | 0.241 | 0.098 | 0.005 | 0.218 | 0.055 | 0.081 | 0.016 | 0.105 | 0.105 | 0.061 | 0.161 | 0.083 | 0.116 |
| 2010 | 1.108 | 0.031 | 0.207 | 0.109 | 0.018 | 1.213 | 0.172 | 0.089 | 0.122 | 0.178 | 0.178 | 0.182 | 0.221 | 0.103 | 0.270 |
| 2011 | 1.113 | 0.024 | 0.325 | 0.125 | 0.075 | 1.108 | 0.283 | 0.143 | 0.215 | 0.091 | 0.091 | 0.129 | 0.225 | 0.157 | 0.291 |
| 2012 | 1.131 | 0.044 | 0.300 | 0.144 | 0.146 | 0.856 | 0.279 | 0.215 | 0.224 | 0.152 | 0.152 | 0.095 | 0.287 | 0.155 | 0.285 |
| 2013 | 1.083 | 0.046 | 0.116 | 0.163 | 0.143 | 1.298 | 0.327 | 0.399 | 0.227 | 0.143 | 0.143 | 0.136 | 0.253 | 0.074 | 0.312 |
| 2014 | 0.655 | 0.057 | 0.088 | 0.124 | 0.136 | 1.219 | 0.277 | 0.199 | 0.214 | 0.110 | 0.110 | 0.084 | 0.390 | 0.035 | 0.244 |
| 2015 | 1.064 | 0.049 | 0.084 | 0.121 | 0.152 | 1.082 | 0.285 | 0.239 | 0.241 | 0.109 | 0.109 | 0.088 | 0.376 | 0.031 | 0.276 |
| 2016 | 0.806 | 0.088 | 0.130 | 0.038 | 0.112 | 0.692 | 0.304 | 0.381 | 0.335 | 0.119 | 0.119 | 0.142 | 0.308 | 0.043 | 0.257 |
| 2017 | 1.084 | 0.098 | 0.173 | 0.102 | 0.212 | 0.834 | 0.372 | 0.670 | 0.358 | 0.203 | 0.203 | 0.158 | 0.282 | 0.015 | 0.338 |
| 2018 | 1.160 | 0.108 | 0.446 | 0.026 | 1.087 | 1.154 | 0.117 | 1.186 | 0.197 | 0.035 | 0.035 | 0.146 | 0.318 | 0.016 | 0.437 |
| 2019 | 0.785 | 0.113 | 0.437 | 0.226 | 1.034 | 1.084 | 0.291 | 1.203 | 0.397 | 0.267 | 0.867 | 0.131 | 0.235 | 0.131 | 0.465 |
| 均值 | 0.955 | 0.053 | 0.302 | 0.133 | 0.211 | 0.820 | 0.212 | 0.475 | 0.176 | 0.206 | 0.313 | 0.115 | 0.252 | 0.084 | 0.317 |
| 排名 | 1 | 14 | 5 | 11 | 8 | 2 | 7 | 3 | 10 | 9 | 4 | 12 | 6 | 13 | - |
图1
新疆旅游业生态效率的时空演变过程"


图2
2005—2019年新疆旅游业生态效率空间分异演变 注:该图基于国家测绘地理信息局标准地图服务网站下载的审图号为GS(2019)3333号的标准地图制作,底图边界无修改。"
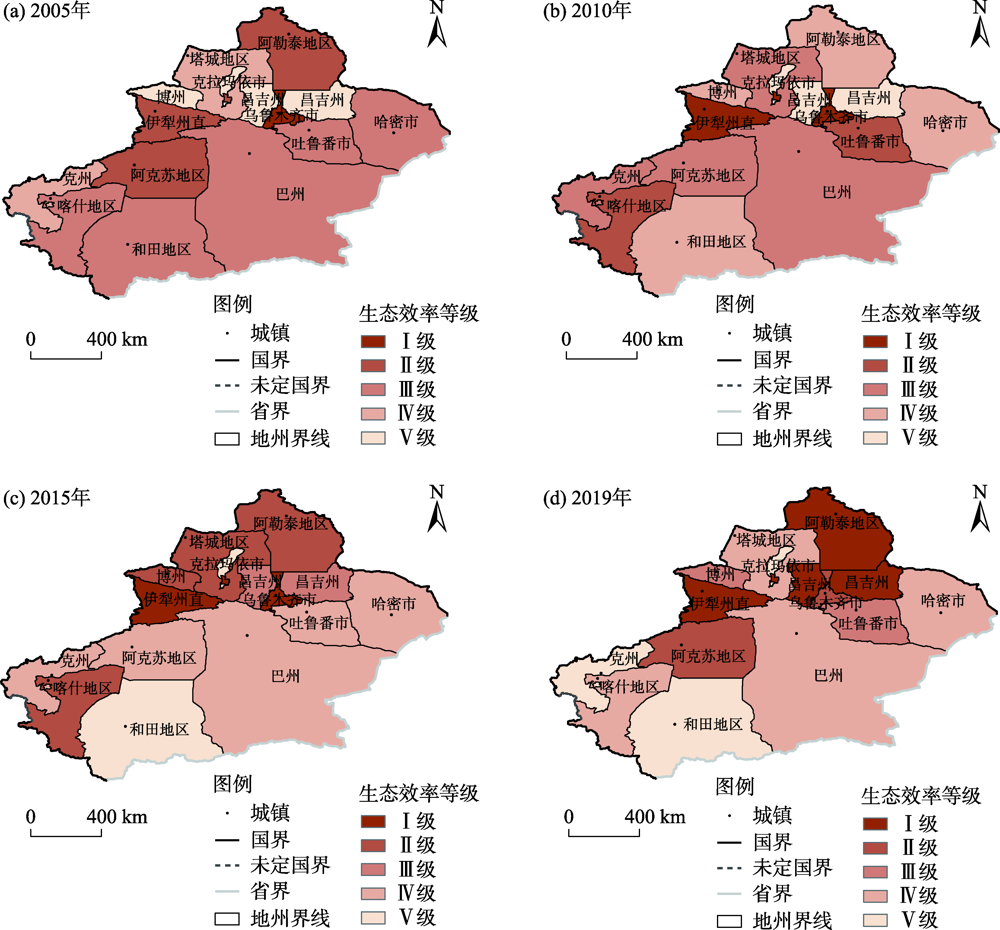
图3
新疆旅游业生态效率的总体差异趋势"
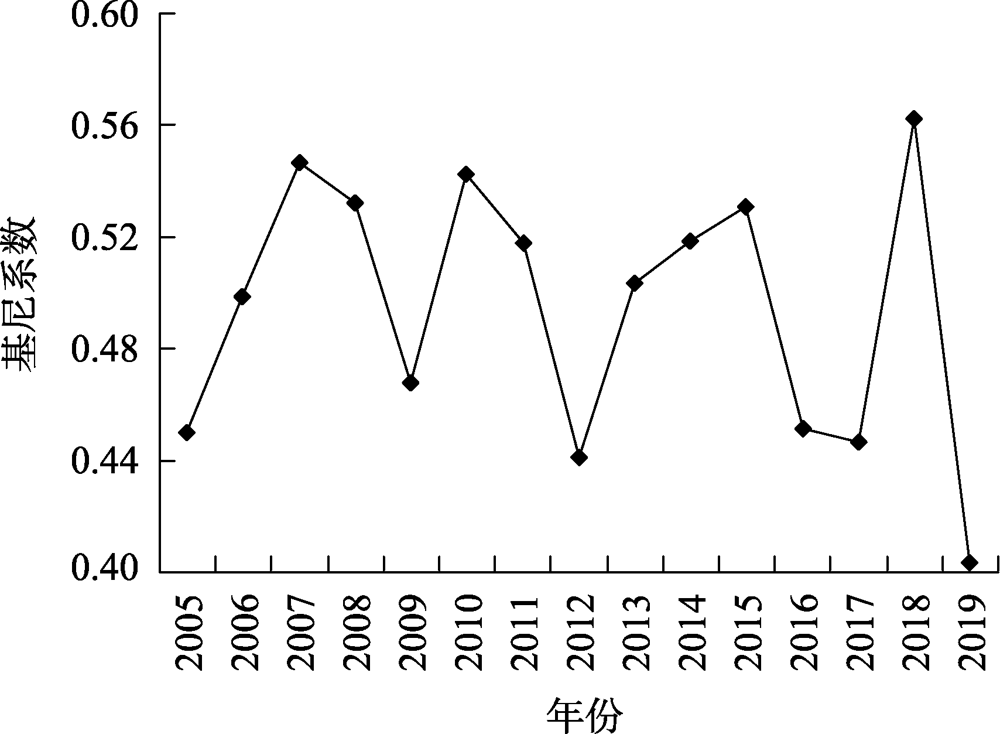

图4
新疆旅游业生态效率的三大区域内差异趋势"
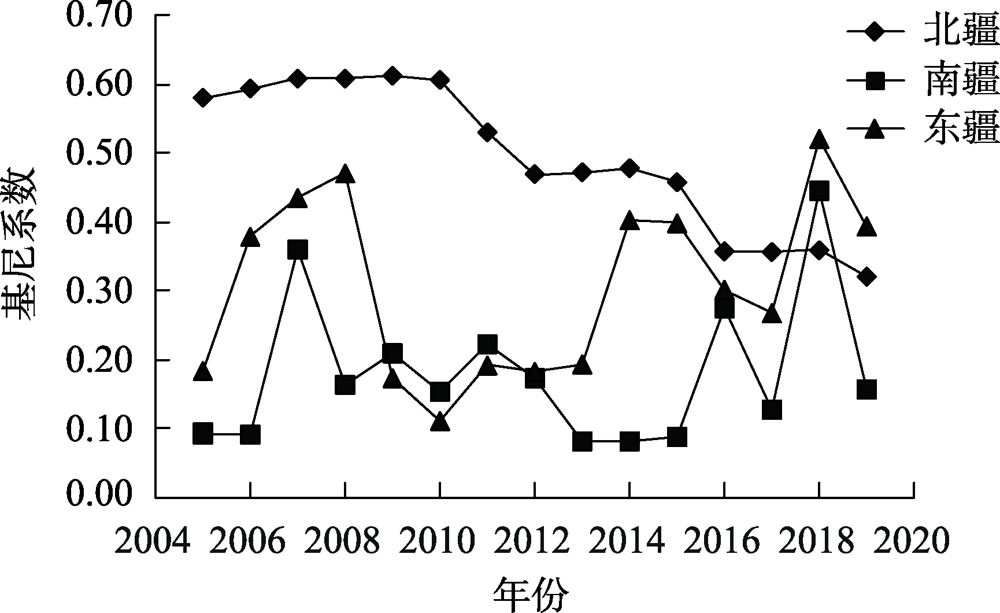

图5
新疆旅游业生态效率的三大区域间差异趋势"

表3
新疆旅游业生态效率Dagum基尼系数及其分解"
| 年份 | 总体 | 区域内 | 贡献率/% | 区域间 | 贡献率/% | 超变密度 | 贡献率/% |
|---|---|---|---|---|---|---|---|
| 2005 | 0.4499 | 0.1811 | 40.25 | 0.0517 | 11.50 | 0.2171 | 48.25 |
| 2006 | 0.4981 | 0.2068 | 41.51 | 0.0430 | 8.63 | 0.2483 | 49.85 |
| 2007 | 0.5466 | 0.2025 | 37.04 | 0.1007 | 18.43 | 0.2434 | 44.53 |
| 2008 | 0.5324 | 0.2140 | 40.19 | 0.0455 | 8.55 | 0.2729 | 51.26 |
| 2009 | 0.4673 | 0.1762 | 37.70 | 0.0822 | 17.59 | 0.2089 | 44.70 |
| 2010 | 0.5423 | 0.2221 | 40.96 | 0.2030 | 37.43 | 0.1172 | 21.61 |
| 2011 | 0.5179 | 0.2057 | 39.72 | 0.2365 | 45.67 | 0.0756 | 14.61 |
| 2012 | 0.4406 | 0.1779 | 40.38 | 0.2018 | 45.80 | 0.0609 | 13.83 |
| 2013 | 0.5035 | 0.1945 | 38.62 | 0.2759 | 54.79 | 0.0332 | 6.59 |
| 2014 | 0.5183 | 0.2068 | 39.89 | 0.2532 | 48.85 | 0.0583 | 11.25 |
| 2015 | 0.5304 | 0.2021 | 38.10 | 0.2794 | 52.68 | 0.0489 | 9.22 |
| 2016 | 0.4511 | 0.1576 | 34.94 | 0.2640 | 58.52 | 0.0295 | 6.54 |
| 2017 | 0.4464 | 0.1538 | 34.44 | 0.2668 | 59.77 | 0.0258 | 5.78 |
| 2018 | 0.5623 | 0.1706 | 30.34 | 0.3456 | 61.47 | 0.0460 | 8.19 |
| 2019 | 0.4030 | 0.1430 | 35.47 | 0.1819 | 45.14 | 0.0781 | 19.38 |
| 均值 | 0.4940 | 0.1876 | 37.97 | 0.1888 | 38.32 | 0.1176 | 23.71 |
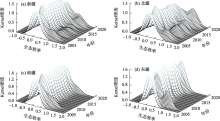
图6
新疆旅游业生态效率分布动态的演变"

表4
新疆旅游业生态效率分布动态演变特征"
| 区域 | 分布位置 | 主峰分布形态 | 极化趋势 | 延展性 |
|---|---|---|---|---|
| 新疆 | 左移-右移 | 主峰上升,宽度缩小 | 两极分化 | 右拖尾,延展扩宽 |
| 北疆 | 右移 | 主峰上升,宽度缩小 | 两极分化 | 右拖尾,延展扩宽 |
| 南疆 | 左移-右移 | 主峰下降,宽度扩大 | 无极化现象 | 右拖尾,延展扩宽 |
| 东疆 | 左移-右移 | 主峰下降,宽度扩大 | 无极化现象 | 右拖尾,延展扩宽 |
表5
新疆旅游业生态效率的收敛性回归结果及稳健性检验"
| 回归变量 控制效应 统计描述 | | |||||
|---|---|---|---|---|---|---|
| 绝对收敛 (模型1) | 条件收敛 (模型2) | 俱乐部收敛 (模型3) | 绝对收敛 (模型4) | 条件收敛 (模型5) | 俱乐部收敛 (模型6) | |
| | -0.0310*** (0.0074) | -0.0308*** (0.0099) | -0.0309*** (0.0074) | -0.0296*** (0.0076) | -0.0291*** (0.0077) | -0.0295*** (0.0076) |
| 人口数量 | 0.0010*** (0.0006) | 0.0010*** (0.0006) | 0.0014*** (0.0006) | |||
| 人均公园面积 | -0.0065* (0.0047) | -0.0073 (0.0049) | -0.0068** (0.0047) | |||
| 水资源总量 | -0.0003** (0.009) | -0.0006* (0.001) | 0.0001** (0.001) | |||
| 年固定效应 | 是 | 是 | 是 | 是 | 是 | 是 |
| 地区固定效应 | 否 | 否 | 是 | 否 | 否 | 是 |
| 城市固定效应 | 否 | 是 | 否 | 否 | 是 | 否 |
| Constant | 0.2153*** | 0.9698** | 0.4033** | 0.1578* | 0.7197* | 0.2151** |
| (0.0885) | (0.0542) | (0.1059) | (0.1382) | (0.2839) | (0.1460) | |
| 观测值 | 196 | 196 | 196 | 196 | 196 | 196 |
| R2 | 0.1919 | 0.6482 | 0.1207 | 0.1944 | 0.7141 | 0.3941 |
| [1] |
Goessling S, Peeters P, Ceron J P, et al. The eco-efficiency of tourism[J]. Ecological Economics, 2005, 54(4): 417-434.
doi: 10.1016/j.ecolecon.2004.10.006 |
| [2] |
Cole V. Measuring the ecological footprint of a Himalayan tourist center[J]. Mountain Research and Development, 2002, 22(5): 132-141.
doi: 10.1659/0276-4741(2002)022[0132:MTEFOA]2.0.CO;2 |
| [3] | 王兆峰, 刘庆芳. 长江经济带旅游生态效率时空演变及其影响因素[J]. 长江流域资源与环境, 2019, 28(10): 2289-2298. |
| [ Wang Zhaofeng, Liu Qingfang. Spatio-temporal evolution and influencing factors of tourism eco-efficiency in the Yangtze River Economic Belt[J]. Resources and Environment in the Yangtze Basin, 2019, 28(10): 2289-2298. ] | |
| [4] | Schaltegger S, Burritt R. Contemporary environmental accounting: Issues, concepts and practice[M]. California: Greenleaf, 2000: 43-65. |
| [5] |
Kristina D, Paul E. Eco-efficiency trends in the UK steel and aluminum industries[J]. Journal of Industrial Ecology, 2008, 9(4): 171-188.
doi: 10.1162/108819805775247954 |
| [6] | Hoffiren J. Measuring the eco-efficiency of welfare generation in a national economy: The case of Finland[D]. Finland: Faculty of Economics and Administration, 2001. |
| [7] |
Rees W E. Ecological footprints and appropriated carrying capacity: What urban economics leaves out[J]. Environment and Urbanization, 1992, 4(2): 121-130.
doi: 10.1177/095624789200400212 |
| [8] |
Efthymios G T, George A. Short-run and long-run performance of international tourism: Evidence from Bayesian dynamic models[J]. Tourism Management, 2014, 42(4): 22-36.
doi: 10.1016/j.tourman.2013.08.003 |
| [9] | Matthias F. Strategy development in tourism destinations: A DEA approach[J]. Ponan University Economics Review, 2004, 4(1): 52-73. |
| [10] | 李鹏, 杨桂华, 郑彪, 等. 基于温室气体排放的云南香格里拉旅游线路产品生态效率[J]. 生态学报, 2008, 28(5): 2207-2219. |
| [ Li Peng, Yang Guihua, Zheng Biao, et al. GHG emission-based eco-efficiency study on tourism itinerary products in Shangri-La, Yunnan Province, China[J]. Acta Ecologica Sinica, 2008, 28(5): 2207-2219. ] | |
| [11] | 李胜兰, 初善冰, 申晨. 地方政府竞争、环境规制与区域生态效率[J]. 世界经济, 2014, 37(4): 88-110. |
| [ Li Shenglan, Chu Shanbing, Shen Chen. Local government competition, environmental regulation and regional ecological efficiency[J]. World Economy, 2014, 37(4): 88-110. ] | |
| [12] | 胡兰双. 中国旅游业生态效率测度与时空演变研究[D]. 广州: 华南理工大学, 2018. |
| [ Hu Lanshuang. Research on eco-efficiency measurement and spatio-temporal evolution of China’s tourism industry[D]. Guangzhou: South China University of Technology, 2018. ] | |
| [13] | 林文凯, 林璧属. 区域旅游产业生态效率评价及其空间差异研究--以江西省为例[J]. 华东经济管理, 2018, 32(6): 19-25. |
| [ Lin Wenkai, Lin Bishu. Ecological efficiency evaluation and its spatial differences of regional tourism industry: A case of Jiangxi Province[J]. East China Economic Management, 2018, 32(6): 19-25. ] | |
| [14] | 高志刚, 童思聪. 基于非期望产出的新疆区域生态经济投入效益分析[J]. 干旱区地理, 2020, 43(3): 777-785. |
| [ Gao Zhigang, Tong Sicong. Regional eco-economic input efficiency of Xinjiang based on undesirable output[J]. Arid Land Geography, 2020, 43(3): 777-785. ] | |
| [15] |
Tosun C, Timothy D J, Ztürk Y. Tourism growth, national development and regional inequality in Turkey[J]. Journal of Sustainable Tourism, 2003, 11(2-3): 133-161.
doi: 10.1080/09669580308667200 |
| [16] |
Blancas F J, Caballero R, M González, et al. Goal programming synthetic indicators: An application for sustainable tourism in Andalusian coastal counties[J]. Ecological Economics, 2010, 69(11): 2158-2172.
doi: 10.1016/j.ecolecon.2010.06.016 |
| [17] | 张军民, 荣城, 马玉香. 新疆城镇化绿色发展时空分异及驱动因子探究[J]. 干旱区地理, 2022, 45(1): 251-262. |
| [ Zhang Junmin, Rong Cheng, Ma Yuxiang. Spatial and temporal differences and driving factors of the green development of urbanization in Xinjiang[J]. Arid Land Geography, 2022, 45(1): 251-262. ] | |
| [18] |
周亮, 车磊, 周成虎. 中国城市绿色发展效率时空演变特征及影响因素[J]. 地理学报, 2019, 74(10): 2027-2044.
doi: 10.11821/dlxb201910006 |
|
[ Zhou Liang, Che Lei, Zhou Chenghu. Spatio-temporal evolution and influencing factors of urban green development efficiency in China[J]. Acta Geographica Sinica, 2019, 74(10): 2027-2044. ]
doi: 10.11821/dlxb201910006 |
|
| [19] |
杨勇, 邓祥征. 中国城市生态效率时空演变及影响因素的区域差异[J]. 地理科学, 2019, 39(7): 1111-1118.
doi: 10.13249/j.cnki.sgs.2019.07.009 |
|
[ Yang Yong, Deng Xiangzheng. The spatio-temporal evolutionary characteristics and regional differences in affecting factors analysis of China’s urban eco-efficiency[J]. Scientia Geographica Sinica, 2019, 39(7): 1111-1118. ]
doi: 10.13249/j.cnki.sgs.2019.07.009 |
|
| [20] | 陈洪星, 杨德刚, 徐红涛, 等. 基于POI的住宿业时空格局演化及与旅游景点的空间关联研究[J]. 干旱区地理, 2020, 43(5): 1382-1390. |
| [ Chen Hongxing, Yang Degang, Xu Hongtao, et al. Spatial and temporal evolution of the accommodation industry and spatial association with tourist spots based on POI[J]. Arid Land Geography, 2020, 43(5): 1382-1390. ] | |
| [21] | 于伟, 张鹏, 姬志恒. 中国城市群生态效率的区域差异、分布动态和收敛性研究[J]. 数量经济技术经济研究, 2021, 38(1): 23-42. |
| [ Yu Wei, Zhang Peng, Ji Zhiheng. Study on regional difference, distribution dynamics and convergence of eco-efficiency of urban clusters in China[J]. Journal of Quantitative Economics and Technical Economics, 2021, 38(1): 23-42. ] | |
| [22] |
刘华军, 乔列成, 孙淑惠. 黄河流域用水效率的空间格局及动态演进[J]. 资源科学, 2020, 42(1): 57-68.
doi: 10.18402/resci.2020.01.06 |
|
[ Liu Huajun, Qiao Liecheng, Sun Shuhui. Spatial distribution and dynamic change of water use efficiency in the Yellow River Basin[J]. Resources Science, 2020, 42(1): 57-68. ]
doi: 10.18402/resci.2020.01.06 |
|
| [23] | 李静, 任继达. 中国工业的用水效率与决定因素--资源和环境双重约束下的分析[J]. 工业技术经济, 2018, 37(1): 122-129. |
| [ Li Jing, Ren Jida. Study on efficiency of lndustrial water use in China based on MinDS model: An empirical analysis under the dual restrictions of resources and environment[J]. Industrial Technology Economy, 2018, 37(1): 122-129. ] | |
| [24] | 侯孟阳, 姚顺波. 中国城市生态效率测定及其时空动态演变[J]. 中国人口·资源与环境, 2018, 28(3): 13-21. |
| [ Hou Mengyang, Yao Shunbo. Measurement and temporal-spatial dynamic evolution of urban eco-efficiency in China[J]. China Population, Resources and Environment, 2018, 28(3): 13-21. ] | |
| [25] | 陈明华, 刘文斐, 王山, 等. 长江经济带城市生态效率的时空分异及其驱动因素[J]. 中国人口·资源与环境, 2020, 30(9): 121-127. |
| [ Chen Minghua, Liu Wenfei, Wang Shan, et al. Spatial-temporal differentiation of urban eco-efficiency in the Yangtze River Economic Belt and its driving factors[J]. China Population, Resources and Environment, 2020, 30(9): 121-127. ] | |
| [26] |
Dagum C. A new approach to the decomposition of the Gini income inequality ratio[J]. Empirical Economics, 1997, 22(4): 515-531.
doi: 10.1007/BF01205777 |
| [27] |
Rosenblatt M. Remarks on some nonparametric estimates of a density function[J]. Annals of Mathematical Statistics, 1956, 27(3): 832-837.
doi: 10.1214/aoms/1177728190 |
| [28] | 陈良敏. 进城农民工市民化测度及影响因素研究[D]. 武汉: 中南财经政法大学, 2020. |
| [ Chen Liangmin. The measurement and influencing factors of urbanization of migrant workers[D]. Wuhan: Zhongnan University of Economics and Law, 2020. ] | |
| [29] |
Dani R. Unconditional convergence in manufacturing[J]. Quarterly Journal of Economics, 2012, 128(1): 165-204.
doi: 10.1093/qje/qjs047 |
| [30] | 戴觅, 茅锐. 产业异质性、产业结构与中国省际经济收敛[J]. 管理世界, 2015(6): 34-46, 62, 187. |
| [ Dai Mi, Mao Rui. The industrial heterogeneity, the lndustrial structure, and the provincial growth convergence in China[J]. Management World, 2015(6): 34-46, 62, 187. ] | |
| [31] | 解亚丽, 柯小玲, 闵园园, 等. 基于超效率DEA模型的三峡库区生态效率评价及空间演化格局分析[J]. 中国环境管理, 2020, 12(1): 113-120. |
| [ Xie Yali, Ke Xiaoling, Min Yuanyuan, et al. Ecological efficiency evaluation and spatial evolution pattern analysis of the Three Gorges Reservoir Area based on super efficiency DEA model[J]. China Environmental Management, 2020, 12(1): 113-120. ] |
| [1] | 朱瑷嫒, 殷颂葵, 刘琼慧. 中国西北地区农业生态效率时空分异及影响因素研究[J]. 干旱区地理, 2024, 47(7): 1210-1219. |
| [2] | 马明德, 李俊杰, 薛晨皓. 宁夏区域发展对环境胁迫的时空演变及驱动机制分析[J]. 干旱区地理, 2024, 47(6): 1061-1072. |
| [3] | 王嘉嘉, 张轲. 生态保护视角下的黄河流域高质量发展非均衡性及演进趋势分析[J]. 干旱区地理, 2024, 47(4): 695-706. |
| [4] | 周成, 赵亚玲, 任敏敏, 靳轶婷, 吕丝丝. 黄河流域国家湿地公园时空分异、重心演化与驱动因素分析[J]. 干旱区地理, 2024, 47(3): 506-514. |
| [5] | 周霞, 王佳. 中国省域经济韧性与生态效率测度及其协同演化分析[J]. 干旱区地理, 2024, 47(2): 319-331. |
| [6] | 王松茂, 宁文萍, 牛金兰, 安康. 黄河流域城市生态韧性时空分异及收敛研究——基于七大城市群61个城市的实证分析[J]. 干旱区地理, 2024, 47(1): 93-103. |
| [7] | 周成, 赵亚玲, 张旭红, 周霖, 任敏敏. 黄河流域城市生态韧性与效率时空演化特征及协调发展分析[J]. 干旱区地理, 2023, 46(9): 1514-1523. |
| [8] | 田小波,胡静,贾垚焱,朱磊. 高质量发展阶段旅游业发展水平空间分异成因探测——基于因素分解的黄河流域实证[J]. 干旱区地理, 2023, 46(3): 460-470. |
| [9] | 余焕, 雷敏, 马金晶, 李睿. 基于绿色GDP和生态效率的区域可持续发展研究——以陕西省为例[J]. 干旱区地理, 2023, 46(2): 284-293. |
| [10] | 陈超超, 马丁丑, 陈强强. 湟水流域西宁段产业结构升级与生态效率提升的耦合路径识别[J]. 干旱区地理, 2023, 46(12): 2042-2051. |
| [11] | 杜娅明, 白永平, 梁建设, 张春悦, 荆林祥, 王立果, 邹嘉铖. 黄河流域旅游业碳排放效率综合测度及影响因素研究[J]. 干旱区地理, 2023, 46(12): 2074-2085. |
| [12] | 张志高, 徐晓曼, 郭超凡, 蔡茂堂, 袁征, 张明哲. 近61 a黄河流域霜冻日期时空分异特征及影响因素[J]. 干旱区地理, 2022, 45(6): 1685-1694. |
| [13] | 李玲蔚,白永平,杨雪荻,张春悦,梁建设,王倩. 黄河几字湾地区可持续发展的动态演变及区域差异[J]. 干旱区地理, 2022, 45(2): 639-649. |
| [14] | 张军民,荣城,马玉香. 新疆城镇化绿色发展时空分异及驱动因子探究[J]. 干旱区地理, 2022, 45(1): 251-262. |
| [15] | 张阳,靳雪,龚先洁. 中国沙漠地区旅游业与旅客运输的空间格局及动态响应研究[J]. 干旱区地理, 2021, 44(4): 1153-1163. |
| Viewed | ||||||||||||||||||||||||||||||||||||||||||||||||||
|
Full text 79
|
|
|||||||||||||||||||||||||||||||||||||||||||||||||
|
Abstract 378
|
|
|||||||||||||||||||||||||||||||||||||||||||||||||
Cited |
|
|||||||||||||||||||||||||||||||||||||||||||||||||
| Shared | ||||||||||||||||||||||||||||||||||||||||||||||||||
|
||