Arid Land Geography ›› 2025, Vol. 48 ›› Issue (7): 1153-1166.doi: 10.12118/j.issn.1000-6060.2024.461
• Climatology and Hydrology • Previous Articles Next Articles
ZHANG Xinhan1( ), ZHAO Wenting1, JIAO Juying1,2(), MA Xiaowu1, YANG Bo2, LING Qi1
Received:2024-08-03
Revised:2024-09-21
Online:2025-07-25
Published:2025-07-04
Contact:
JIAO Juying
E-mail:zxh_0630@163.com;jyjiao@ms.iswc.ac.cn
ZHANG Xinhan, ZHAO Wenting, JIAO Juying, MA Xiaowu, YANG Bo, LING Qi. Spatiotemporal evolution characteristics of extreme precipitation events on the Loess Plateau from 1960 to 2023[J].Arid Land Geography, 2025, 48(7): 1153-1166.
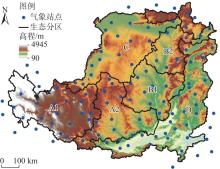
Fig. 1
Ecological regionalizations and distribution of meteorological stations on the Loess Plateau"

Tab. 1
Extreme precipitation indicators and definitions"
| 极端降水指标 | 定义 | 单位 | |
|---|---|---|---|
| 极端降水事件指标 | 极端降水量 | 年内超过极端降水阈值的降水量总和 | mm |
| 极端降水日数 | 年内发生极端降水事件的日数 | d | |
| 极端降水强度 | 极端降水量与极端降水天数的比值 | mm·d-1 | |
| 极端降水指数 | 连续降水日数(CWD) | 年内日降水量≥1 mm的最长持续时间 | d |
| 大雨日数(R25mm) | 年内日降水量>25 mm的总日数 | d | |
| 暴雨日数(R50mm) | 年内日降水量>50 mm的总日数 | d | |
| 日最大降水量(RX1day) | 年内日降水量最大值 | mm | |
| 连续5 d最大降水量(RX5day) | 年内连续5 d降水量最大值 | mm | |
Fig. 2
Spatial distributions of extreme precipitation thresholds and annual average precipitation at each station on the Loess Plateau"
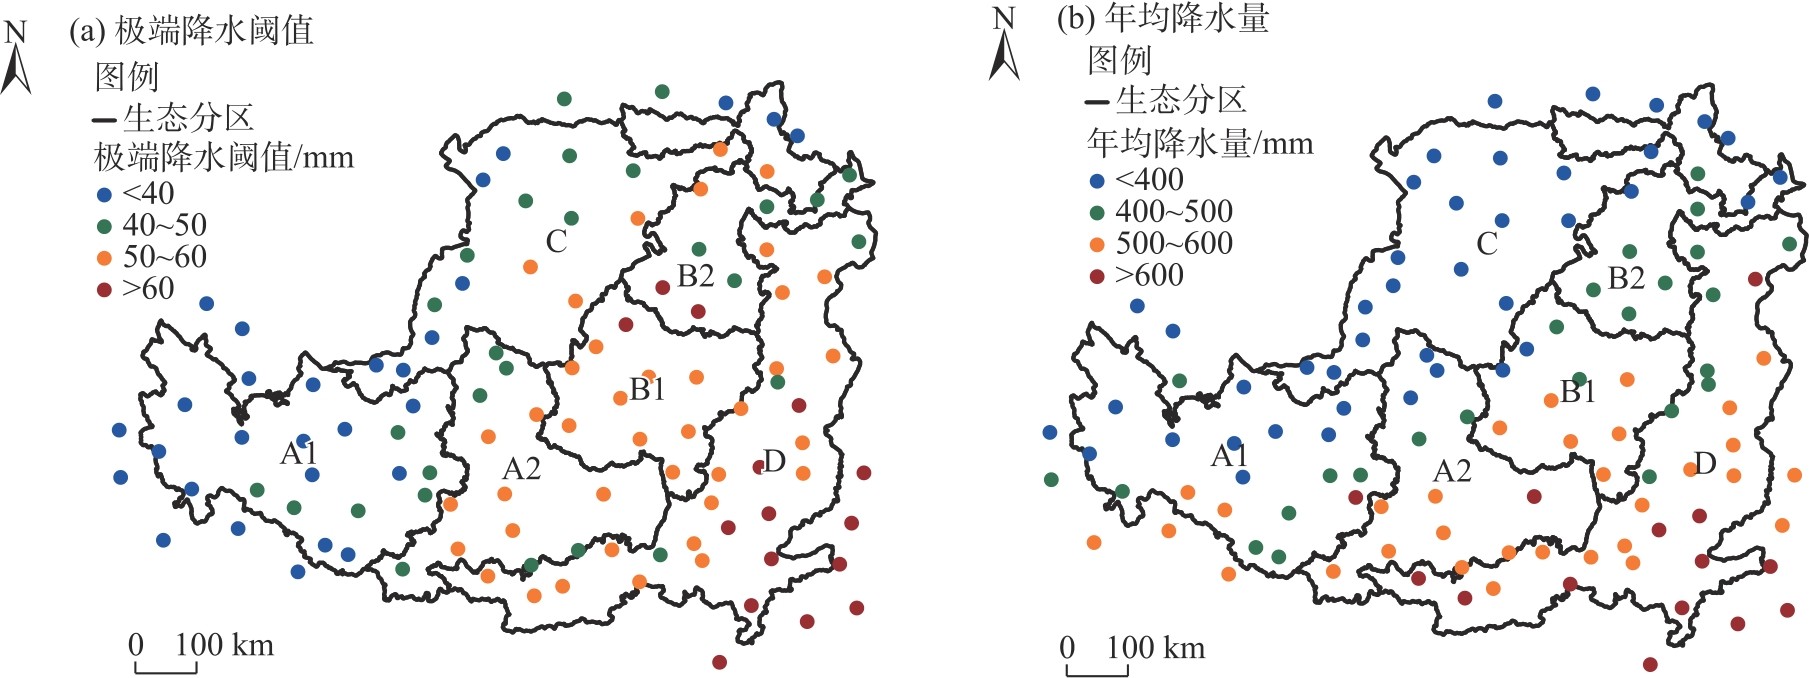
Tab. 2
Extreme precipitation thresholds in different ecological regionalizations"
| 分区 | 雨量站数量/站 | 阈值范围/mm | 平均值±标准误/mm |
|---|---|---|---|
| A1 | 26 | 27.4~49.1 | 35.0±1.1 |
| A2 | 12 | 42.4~59.0 | 51.6±1.5 |
| B1 | 10 | 53.3~61.2 | 57.1±0.7 |
| B2 | 8 | 41.8~62.6 | 50.6±2.8 |
| C | 17 | 34.1~57.2 | 44.5±1.8 |
| D | 38 | 35.7~89.1 | 59.6±2.2 |
Fig. 3
Spatial distributions of multi-year average extreme precipitation indicators"
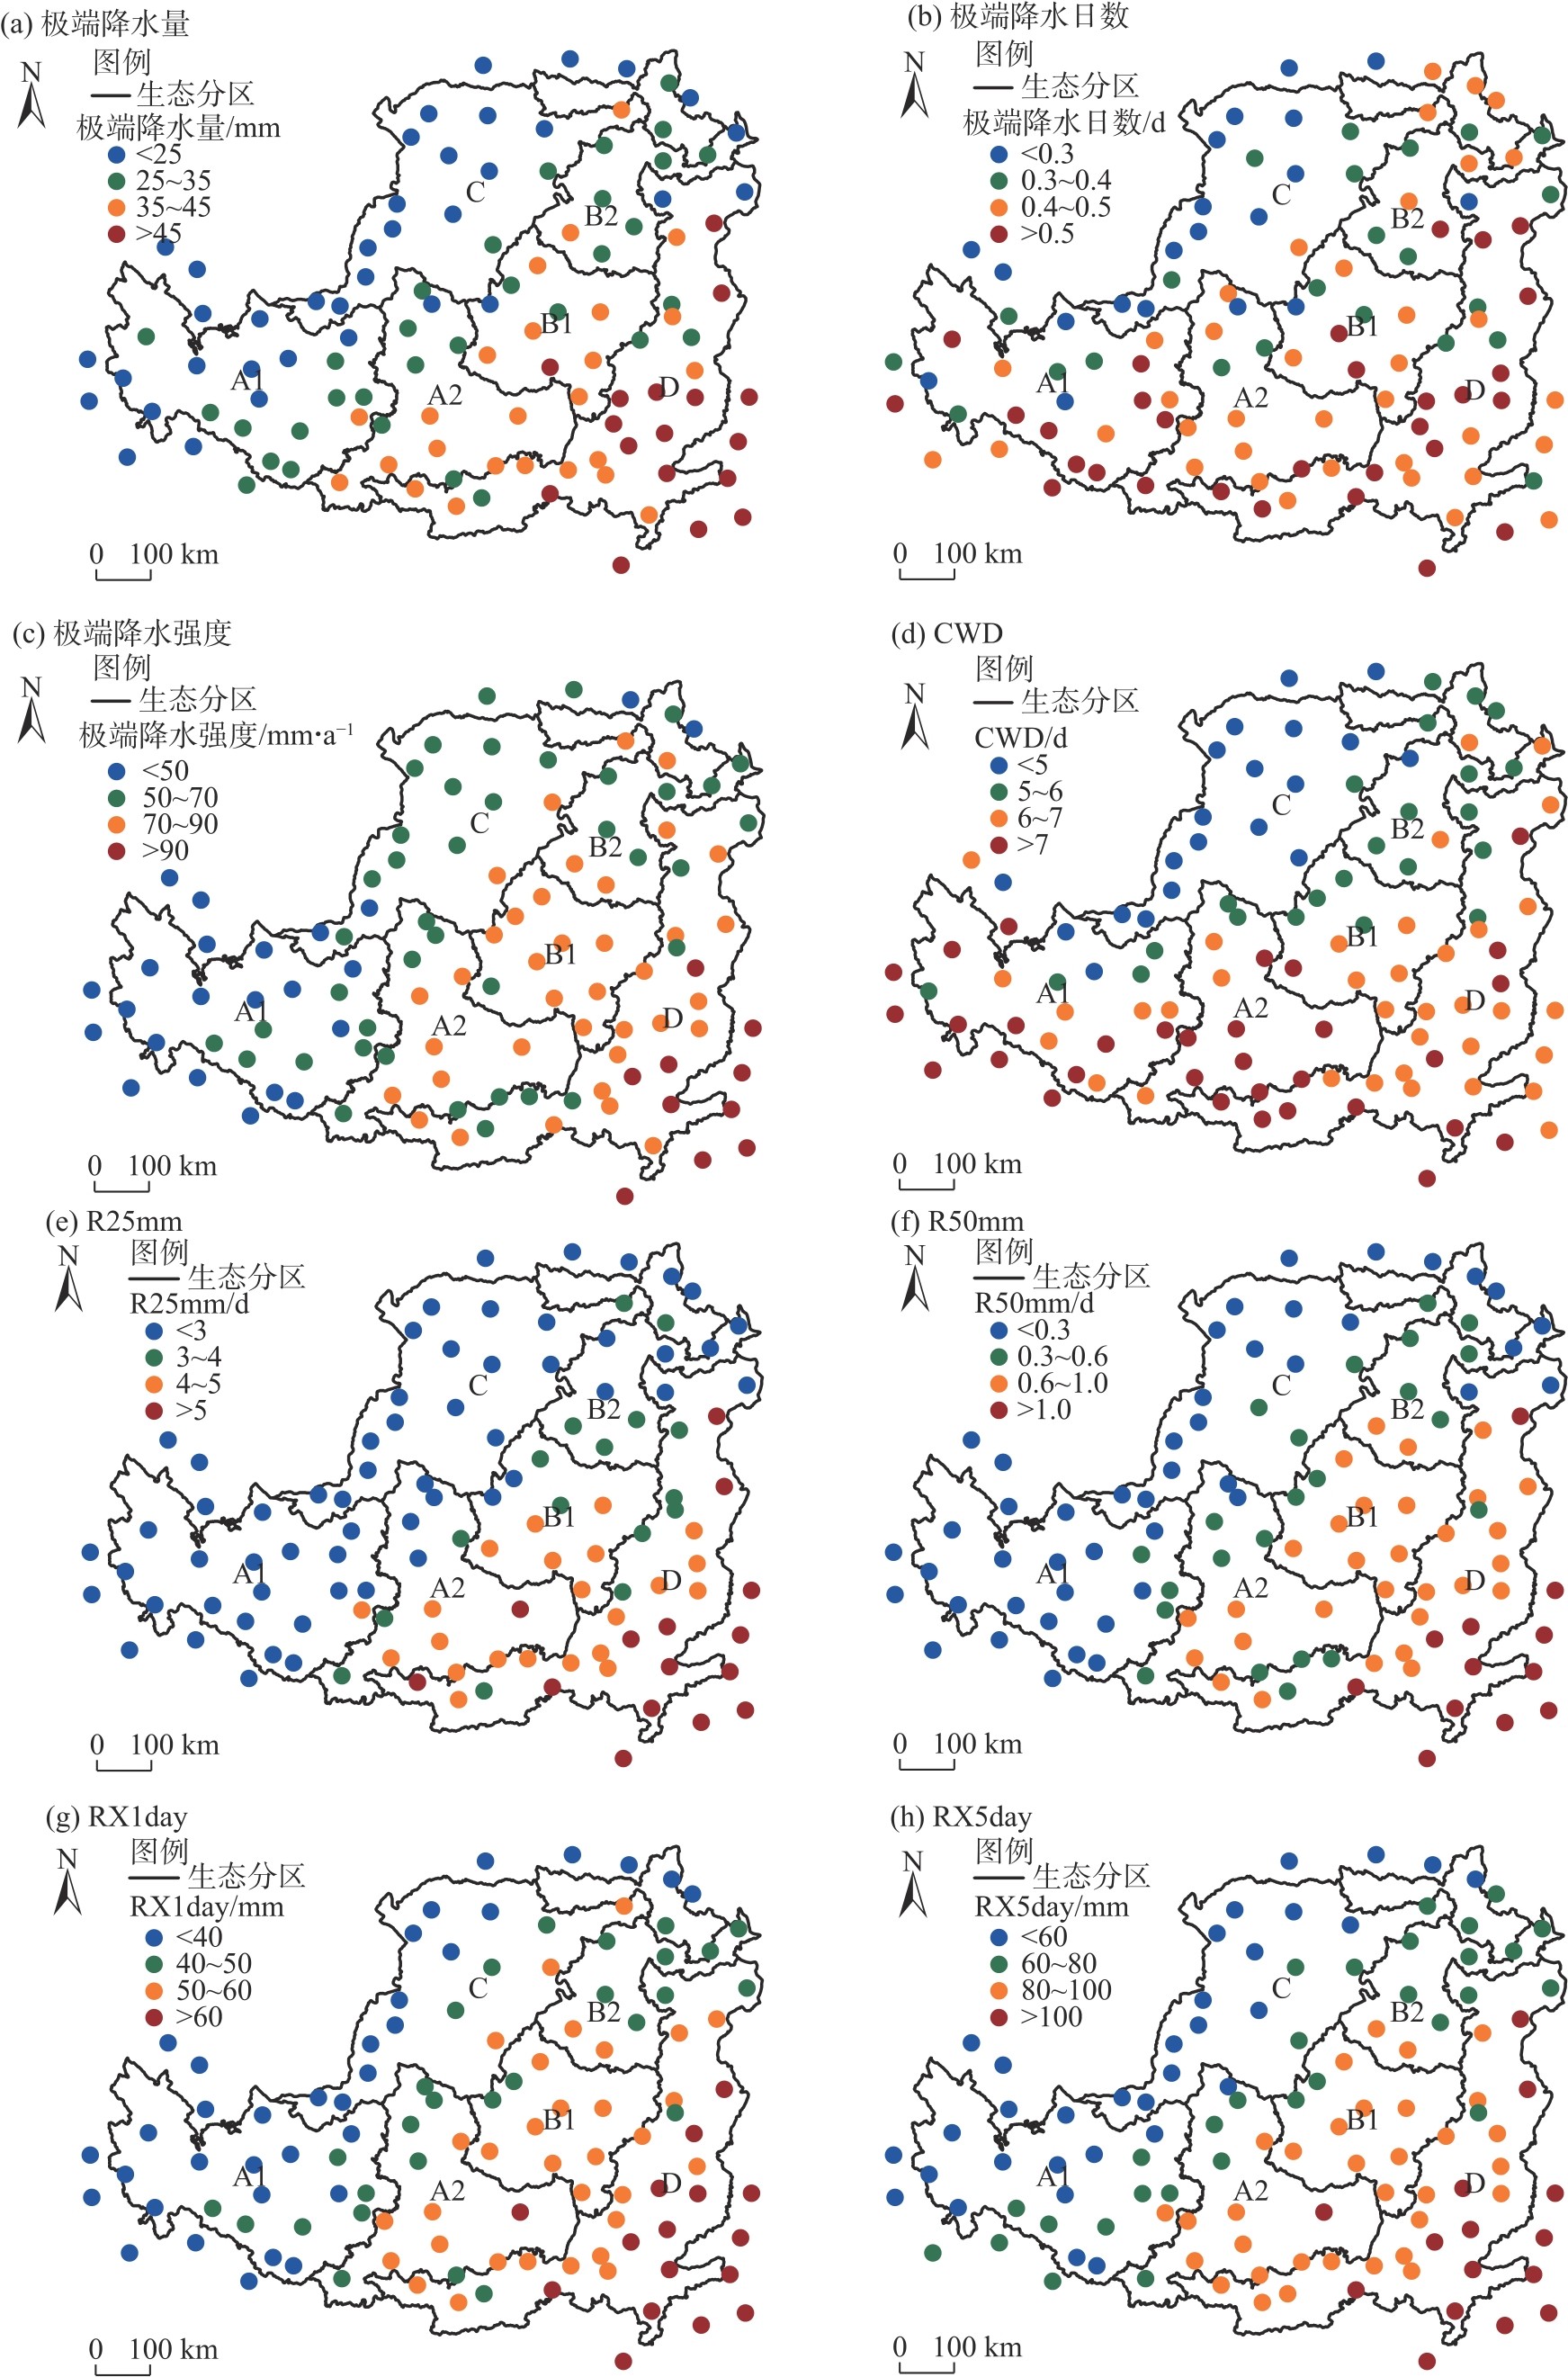
Tab. 3
Extreme precipitation indicator values in different ecological regionalizations"
| 极端降水指标 | 生态分区 | ||||||
|---|---|---|---|---|---|---|---|
| A1 | A2 | B1 | B2 | C | D | ||
| 极端降水事件指标 | 极端降水量/mm | 22.83±1.71 | 33.75±2.22 | 35.37±2.18 | 30.09±1.74 | 21.08±1.81 | 42.94±2.34 |
| 极端降水日数/d | 0.50±0.03 | 0.49±0.03 | 0.48±0.03 | 0.46±0.03 | 0.34±0.02 | 0.53±0.02 | |
| 极端降水强度/mm·d-1 | 45.17±1.68 | 68.35±2.11 | 74.99±1.23 | 66.40±4.24 | 59.91±2.40 | 79.91±3.33 | |
| 极端降水指数 | CWD/d | 7.22±0.34 | 7.06±0.27 | 6.27±0.18 | 5.73±0.17 | 4.35±0.13 | 6.80±0.14 |
| R25mm/d | 1.64±0.19 | 3.59±0.34 | 3.84±0.20 | 2.94±0.15 | 1.48±0.19 | 4.77±0.29 | |
| R50mm/d | 0.14±0.03 | 0.58±0.06 | 0.70±0.05 | 0.50±0.06 | 0.26±0.04 | 0.96±0.10 | |
| RX1day/mm | 33.81±1.41 | 50.53±1.89 | 54.27±1.27 | 48.30±2.12 | 38.10±1.91 | 59.64±2.43 | |
| RX5day/mm | 54.92±2.58 | 79.56±4.11 | 85.16±3.10 | 74.51±3.18 | 52.18±3.25 | 95.92±3.83 | |
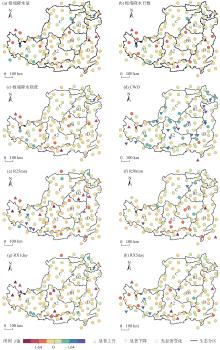
Fig. 4
Variation trends of extreme precipitation indicators at each meteorological station"
Tab. 4
Statistical test results of extreme precipitation indicators on the whole Loess Plateau"
| 极端降水指标 | 平均值 | 最大值 | 最小值 | 变异系数 | Z值 | Sen斜率 | |
|---|---|---|---|---|---|---|---|
| 极端降水事件指标 | 极端降水量/mm | 32.4 | 76.7 | 7.5 | 0.40 | 1.40 | 0.128 |
| 极端降水日数/d | 0.5 | 0.9 | 0.1 | 0.39 | 1.49 | 0.001 | |
| 极端降水强度/mm·d-1 | 66.9 | 90.9 | 54.5 | 0.10 | 0.25 | 0.009 | |
| 极端降水指数 | CWD/d | 6.4 | 9.5 | 5.0 | 0.13 | -1.63 | -0.009 |
| R25mm/d | 3.2 | 5.1 | 1.4 | 0.22 | 1.85 | 0.010 | |
| R50mm/d | 0.6 | 1.2 | 0.2 | 0.35 | 1.37 | 0.001 | |
| RX1day/mm | 48.0 | 61.3 | 32.2 | 0.12 | 0.74 | 0.035 | |
| RX5day/mm | 75.3 | 90.7 | 47.5 | 0.14 | 0.57 | 0.036 | |
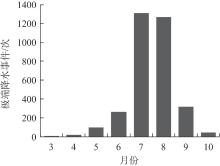
Fig. 5
Monthly distribution of extreme precipitation events on the Loess Plateau from 1960 to 2023"
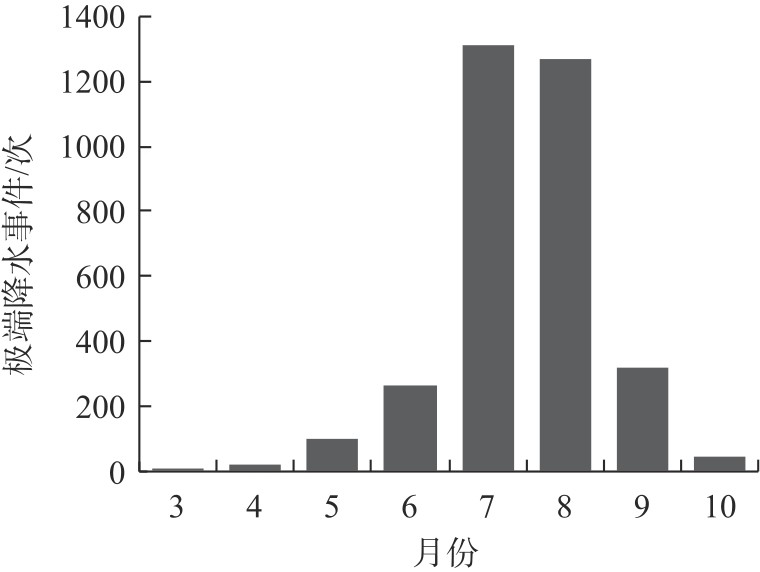
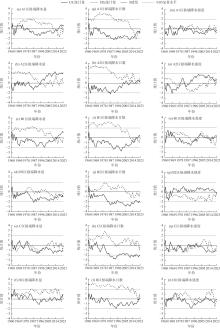
Fig. 6
Mann-Kendall mutation test of extreme precipitation events in different ecological regionalizations"

| [1] | 江志红, 丁裕国, 陈威霖. 21世纪中国极端降水事件预估[J]. 气候变化研究进展, 2007, 3(4): 202-207. |
| [ Jiang Zhihong, Ding Yuguo, Chen Weilin. Projection of precipitation extremes for the 21st century over China[J]. Climate Change Research, 2007, 3(4): 202-207. ] | |
| [2] | 袁文德, 郑江坤, 董奎. 1962—2012年西南地区极端降水事件的时空变化特征[J]. 资源科学, 2014, 36(4): 766-772. |
| [ Yuan Wende, Zheng Jiangkun, Dong Kui. Spatial and temporal variation in extreme precipitation events in southwestern China during 1962—2012[J]. Resources Science, 2014, 36(4): 766-772. ] | |
| [3] | Liu B J, Chen J F, Chen X H, et al. Uncertainty in determining extreme precipitation thresholds[J]. Journal of Hydrology, 2013, 503: 233-245. |
| [4] | Watters P A, Martin F. A method for estimating long-range power law correlations from the electroencephalogram[J]. Biological Psychology, 2004, 66(1): 79-89. |
| [5] | 杨萍, 侯威, 封国林. 基于去趋势波动分析方法确定极端事件阈值[J]. 物理学报, 2008, 57(8): 5333-5342. |
| [ Yang Ping, Hou Wei, Feng Guolin. Determining the threshold of extreme events with detrended fluctuation analysis[J]. Acta Physica Sinica, 2008, 57(8): 5333-5342. ] | |
| [6] | 刘丙军, 伍丽丽, 陆文秀. 基于DFA方法的珠江流域极端降水阈值研究[J]. 中山大学学报(自然科学版), 2013, 52(1): 136-141. |
| [ Liu Bingjun, Wu Lili, Lu Wenxiu. Researches on DFA-based extreme precipitation threshold in the Pearl River Basin[J]. Acta Scientiarum Naturalium Universitatis Sunyatseni, 2013, 52(1): 136-141. ] | |
| [7] | 郑祚芳, 张秀丽, 曹鸿兴, 等. 用去趋势涨落分析研究北京气候的长程变化特征[J]. 地球物理学报, 2007(2): 420-424. |
| [ Zheng Zuofang, Zhang Xiuli, Cao Hongxing, et al. Characteristics of long-term climate change in Beijing with detrended fluctuation analysis[J]. Chinese Journal of Geophysics, 2007(2): 420-424. ] | |
| [8] | 郑腾飞, 郭建茂, 尹继福, 等. 基于DFA法的江苏省极端降水时空分布特征研究[J]. 自然灾害学报, 2012, 21(4): 76-83. |
| [ Zheng Tengfei, Guo Jianmao, Yin Jifu, et al. DFA-based research on spatiotemporal distribution of extreme precipitations in Jiangsu Province[J]. Journal of Natural Disasters, 2012, 21(4): 76-83. ] | |
| [9] | Chi X X, Yin Z E, Wang X, et al. Spatiotemporal variations of precipitation extremes of China during the past 50 years (1960—2009)[J]. Theoretical and Applied Climatology, 2016, 124(3-4): 555-564. |
| [10] | Wang L Y, Chen S F, Zhu W B, et al. Spatiotemporal variations of extreme precipitation and its potential driving factors in China’s north-south transition zone during 1960—2017[J]. Atmospheric Research, 2021, 252: 105429, doi: 10.1016/j.atmosres.2020.105429. |
| [11] | 新华网. 山西严重洪涝灾害已致175万余人受灾[EB/OL]. [2021-10-10]. . |
| [ Xinhua News Agency. Severe floods and waterlogging in Shanxi have affected more than 1.75 million people[EB/OL]. [2021-10-10]. . ] | |
| [12] | Alexander L V, Tapper N, Zhang X, et al. Climate extremes: Progress and future directions[J]. International Journal of Climatology: A Journal of the Royal Meteorological Society, 2009, 29(3): 317-319. |
| [13] | Mass C, Skalenakis A, Warner M. Extreme precipitation over the west coast of North America: Is there a trend?[J]. Journal of Hydrometeorology, 2011, 12(2): 310-318. |
| [14] | 卢珊, 胡泽勇, 王百朋, 等. 近56年中国极端降水事件的时空变化格局[J]. 高原气象, 2020, 39(4): 683-693. |
| [ Lu Shan, Hu Zeyong, Wang Baipeng, et al. Spatio-temporal patterns of extreme precipitation events over China in recent 56 years[J]. Plateau Meteorology, 2020, 39(4): 683-693. ] | |
| [15] | 景丞, 陶辉, 王艳君, 等. 基于区域气候模式CCLM的中国极端降水事件预估[J]. 自然资源学报, 2017, 32(2): 266-277. |
| [ Jing Cheng, Tao Hui, Wang Yanjun, et al. Projection of extreme precipitation events in China based on regional climate model CCLM[J]. Journal of Natural Resources, 2017, 32(2): 266-277. ] | |
| [16] | 王志福, 钱永甫, 林惠娟, 等. 区域海气耦合模式对我国极端降水模拟分析[J]. 高原气象, 2008, 27(1): 113-121. |
| [ Wang Zhifu, Qian Yongfu, Lin Huijuan, et al. Analysis of numerical simulation on extreme precipitation in China using a coupled regional ocean-atmosphere model[J]. Plateau Meteorology, 2008, 27(1): 113-121. ] | |
| [17] | Zhang J J, Gao G Y, Fu B J, et al. A universal multifractal approach to assessment of spatiotemporal extreme precipitation over the Loess Plateau of China[J]. Hydrology and Earth System Sciences, 2020, 24(2): 809-826. |
| [18] | 卢珊, 胡泽勇, 付春伟, 等. 黄土高原夏季极端降水及其成因分析[J]. 高原气象, 2022, 41(1): 241-254. |
| [ Lu Shan, Hu Zeyong, Fu Chunwei, et al. Characteristics and possible causes for extreme precipitation in summer over the Loess Plateau[J]. Plateau Meteorology, 2022, 41(1): 241-254. ] | |
| [19] | 李志, 郑粉莉, 刘文兆. 1961—2007年黄土高原极端降水事件的时空变化分析[J]. 自然资源学报, 2010, 25(2): 291-299. |
| [ Li Zhi, Zheng Fenli, Liu Wenzhao. Analyzing the spatial-temporal changes of extreme precipitation events in the Loess Plateau from 1961 to 2007[J]. Journal of Natural Resources, 2010, 25(2): 291-299. ] | |
| [20] | 王国桢, 晏宏, 刘成程, 等. 1960—2017年黄土高原极端降水的时空演化及其对环流变化的响应[J]. 地球环境学报, 2023, 14(5): 588-602. |
| [ Wang Guozhen, Yan Hong, Liu Chengcheng, et al. Spatio-temporal evolution of extreme precipitation in Loess Plateau during 1960—2017 and its response to atmospheric circulation changes[J]. Journal of Earth Environment, 2023, 14(5): 588-602. ] | |
| [21] | 周晓红, 赵景波. 黄土高原气候变化与植被恢复[J]. 干旱区研究, 2005, 22(1): 116-119. |
| [ Zhou Xiaohong, Zhao Jingbo. Climatic change and vegetation restoration on the Loess Plateau[J]. Arid Zone Research, 2005, 22(1): 116-119. ] | |
| [22] | 裴宏泽, 赵亚超, 张廷龙. 2000—2020年黄土高原NEP时空格局与驱动力[J]. 干旱区研究, 2023, 40(11): 1833-1844. |
| [ Pei Hongze, Zhao Yachao, Zhang Tinglong. Analysis of spatial and temporal patterns and drivers of local regional NEP in the Loess Plateau from 2000 to 2020[J]. Arid Zone Research, 2023, 40(11): 1833-1844. ] | |
| [23] | 杨艳芬, 王兵, 王国梁, 等. 黄土高原生态分区及概况[J]. 生态学报, 2019, 39(20): 7389-7397. |
| [ Yang Yanfen, Wang Bing, Wang Guoliang, et al. Ecological regionalization and overview of the Loess Plateau[J]. Acta Ecologica Sinica, 2019, 39(20): 7389-7397. ] | |
| [24] | Sen P K. Estimates of the regression coefficient based on Kendall’s Tau[J]. Journal of the American Statistical Association, 1968, 63(324): 1379-1389. |
| [25] | Hirsch R M, Slack J R. A nonparametric trend test for seasonal data with serial dependence[J]. Water Resources Research, 1984, 20(6): 727-732. |
| [26] | 井乐, 李建平, 张翼, 等. 黄土高原不同土地利用方式下土壤干层差异[J]. 草业科学, 2018, 35(8): 1829-1835. |
| [ Jing Le, Li Jianping, Zhang Yi, et al. Study on dry soil layers under different land-use systems in the Loess Plateau[J]. Pratacultural Science, 2018, 35(8): 1829-1835. ] | |
| [27] | 赵安周, 朱秀芳, 潘耀忠. 1965—2013年黄土高原地区极端降水事件时空变化特征[J]. 北京师范大学学报(自然科学版), 2017, 53(1): 43-50. |
| [ Zhao Anzhou, Zhu Xiufang, Pan Yaozhong. Spatiotemporal variations of extreme precipitation events in the Loess Plateau from 1965 to 2013[J]. Journal of Beijing Normal University (Natural Science Edition), 2017, 53(1): 43-50. ] | |
| [28] | 王万忠, 焦菊英, 魏艳红, 等. 近半个世纪以来黄土高原侵蚀产沙的时空分异特征[J]. 泥沙研究, 2015, 40(2): 9-16. |
| [ Wang Wanzhong, Jiao Juying, Wei Yanhong, et al. Spatial-temporal differentiation characteristics of erosion sediment yield on the Loess Plateau during the recent half century[J]. Journal of Sediment Research, 2015, 40(2): 9-16. ] | |
| [29] | 张光辉. 从土壤侵蚀角度诠释泥沙连通性[J]. 水科学进展, 2021, 32(2): 295-308. |
| [ Zhang Guanghui. Understanding sediment connectivity from soil erosion perspective[J]. Advances in Water Science, 2021, 32(2): 295-308. ] | |
| [30] | 央视网. 陕西大荔持续降雨致49.1万亩农田被淹紧急转移1.8万余名群众[EB/OL]. [2021-10-10]. . |
| [ CCTV network. Continuous rainfall in Dali, Shaanxi Province has caused 491000 mu of farmland to be flooded and urgently evacuated over 18000 people[EB/OL]. [2021-10-10]. . ] | |
| [31] | 杜世雄, 吴瑞英, 孙怀卫, 等. 中巴经济走廊极端降水事件分析[J]. 农业工程学报, 2022, 38(增刊1): 152-160. |
| [ Du Shixiong, Wu Ruiying, Sun Huaiwei, et al. Analysis of extreme precipitation events along the China-Pakistan economic corridor[J]. Transactions of the Chinese Society of Agricultural Engineering, 2022, 38(Suppl. 1): 152-160. ] | |
| [32] | 杨东, 程军奇, 李小亚, 等. 甘肃黄土高原各级降水和极端降水时空分布特征[J]. 生态环境学报, 2012, 21(9): 1539-1547. |
| [ Yang Dong, Cheng Junqi, Li Xiaoya, et al. The variation characteristic of different levels of precipitation and extreme precipitation in Loess Plateau of Gansu Province region in recent 52 years[J]. Ecology and Environmental Sciences, 2012, 21(9): 1539-1547. ] | |
| [33] | 李双双, 孔锋, 韩鹭, 等. 陕北黄土高原区极端降水时空变化特征及其影响因素[J]. 地理研究, 2020, 39(1): 140-151. |
| [ Li Shuangshuang, Kong Feng, Han Lu, et al. Spatiotemporal variability of extreme precipitation and influencing factors on the Loess Plateau in northern Shaanxi Province[J]. Geographical Research, 2020, 39(1): 140-151. ] | |
| [34] | 黎珩, 朱冰冰, 边熇, 等. 1970—2020年黄土高原水蚀风蚀交错区极端降水时空变化研究及驱动因素分析[J]. 干旱区地理, 2024, 47(4): 539-548. |
| [ Li Heng, Zhu Bingbing, Bian He, et al. Temporal and spatial changes in extreme precipitation and its driving factors in the water-wind erosion crisscross region of the Loess Plateau from 1970 to 2020[J]. Arid Land Geography, 2024, 47(4): 539-548. ] | |
| [35] | 高涛, 谢立安. 近50年来中国极端降水趋势与物理成因研究综述[J]. 地球科学进展, 2014, 29(5): 577-589. |
| [ Gao Tao, Xie Li’an. Study on progress of the trends and physical causes of extreme precipitation in China during the last 50 years[J]. Advances in Earth Science, 2014, 29(5): 577-589. ] | |
| [36] | 刘国彬, 上官周平, 姚文艺, 等. 黄土高原生态工程的生态成效[J]. 中国科学院院刊, 2017, 32(1): 11-19. |
| [ Liu Guobin, Shangguan Zhouping, Yao Wenyi, et al. Ecological effects of soil conservation in Loess Plateau[J]. Chinese Academy of Sciences, 2017, 32(1): 11-19. ] | |
| [37] | 张宝庆, 田磊, 赵西宁, 等. 植被恢复对黄土高原局地降水的反馈效应研究[J]. 中国科学: 地球科学, 2021, 51(7): 1080-1091. |
| [ Zhang Baoqing, Tian Lei, Zhao Xining, et al. Study on the feedback effect of vegetation restoration on local precipitation on the Loess Plateau[J]. Science China (Earth Sciences), 2021, 51(7): 1080-1091. ] | |
| [38] | 安彬, 肖薇薇, 刘宇峰, 等. 1955—2021年黄土高原地区相对湿度时空演变规律[J]. 干旱区地理, 2023, 46(12): 1939-1950. |
| [ An Bin, Xiao Weiwei, Liu Yufeng, et al. Temporal and spatial evolution of relative humidity in the Loess Plateau during 1955—2021[J]. Arid Land Geography, 2023, 46(12): 1939-1950. ] | |
| [39] | Tabari H. Climate change impact on flood and extreme precipitation increases with water availability[J]. Scientific Reports, 2020, 10(1): 13768, doi: 10.1038/s41598-020-70816-2. |
| [40] | 卢燕. 2021年全球气候不能承受之变[J]. 绿色中国, 2021(23): 16-21. |
| [ Lu Yan. Unbearable changes in global climate in 2021[J]. Green China, 2021(23): 16-21. ] |
|
||