Arid Land Geography ›› 2022, Vol. 45 ›› Issue (4): 1165-1175.doi: 10.12118/j.issn.1000-6060.2021.477
• Earth Information Sciences • Previous Articles Next Articles
LIU Xuhui1,2( ),BAI Yungang2(),CHAI Zhongping1,ZHANG Jianghui2,DING Bangxin2,3,JIANG Zhu2
Received:2021-10-15
Revised:2022-01-01
Online:2022-07-25
Published:2022-08-11
Contact:
Yungang BAI
E-mail:454949752@qq.com;xjbaiyg@sina.com
LIU Xuhui,BAI Yungang,CHAI Zhongping,ZHANG Jianghui,DING Bangxin,JIANG Zhu. Inversion and validation of soil salinity based on multispectral remote sensing in typical oasis cotton field in spring[J].Arid Land Geography, 2022, 45(4): 1165-1175.

Fig. 1
Sketch maps of the study area location and soil sample distribution"

Tab. 1
Spectral parameters and related formulas"
| 光谱参量 | 计算公式 | 参考文献 | |
|---|---|---|---|
| 波段 | b1 | CA | [ |
| b2 | B | [ | |
| b3 | G | [ | |
| b4 | R | [ | |
| b5 | NIR | [ | |
| b6 | SWIR1 | [ | |
| b7 | SWIR2 | [ | |
| 盐分指数 | NDSI | | [ |
| SI-T | | [ | |
| SI1 | | [ | |
| SI2 | | [ | |
| SI3 | | [ | |
| SI4 | | [ | |
| S1 | | [ | |
| S2 | | [ | |
| S3 | | [ | |
| S4 | | [ | |
| S5 | | [ | |
| S6 | | [ | |
Tab. 2
Descriptive statistical analysis on soil salinity"
| 数据集 | 样本数/个 | 土壤含盐量/g·kg-1 | 标准差 | 变异系数 | ||||||
|---|---|---|---|---|---|---|---|---|---|---|
| 总样本 | 非盐化土 | 轻度盐化土 | 中度盐化土 | 最小值 | 最大值 | 平均值 | ||||
| 总样本 | 77 | 50 | 21 | 6 | 0.37 | 11.82 | 3.02 | 2.03 | 0.67 | |
| 建模集 | 51 | 33 | 14 | 4 | 0.42 | 11.82 | 3.05 | 2.07 | 0.68 | |
| 验证集 | 26 | 17 | 7 | 2 | 0.37 | 9.64 | 2.97 | 1.95 | 0.66 | |
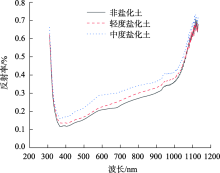
Fig. 2
Spectral reflectance curves of soil with different salinization grades"

Tab. 3
Correlation between spectral parameters and soil salinity"
| 光谱参量 | 相关系数(r) | |
|---|---|---|
| 波段 | b1 | 0.591** |
| b2 | 0.550** | |
| b3 | 0.539** | |
| b4 | 0.525** | |
| b5 | 0.297 | |
| b6 | 0.196 | |
| b7 | 0.329 | |
| 盐分指数 | NDSI | 0.304 |
| SI-T | 0.197 | |
| SI1 | 0.535** | |
| SI2 | 0.452** | |
| SI3 | 0.533** | |
| SI4 | 0.416** | |
| S1 | -0.162 | |
| S2 | -0.163 | |
| S3 | 0.497** | |
| S4 | 0.545** | |
| S5 | 0.540** | |
| S6 | 0.269 | |
Tab. 4
Regression models based on different groups of variables"
| 变量组 | 建模 方法 | 表达式 | 建模集(n=51) | 验证集(n=26) | ||
|---|---|---|---|---|---|---|
| R2 | RMSE | R2 | RMSE | |||
| 波段组 | MSR | Y=624.08b1-440.71b2-29.42 | 0.411 | 1.588 | 0.473 | 1.414 |
| PLSR | Y=40.75b1+35.51b2+25.32b3+19.94b4-21.19 | 0.314 | 1.713 | 0.496 | 1.382 | |
| 光谱 指数组 | MSR | Y=-94.05SI2+170.77SI4+246.21S5-14.30 | 0.341 | 1.679 | 0.377 | 1.544 |
| PLSR | Y=13.32SI1+6.02SI2+9.3SI3+26.55SI4+7.86S3+16S4+16.58S5-16.74 | 0.269 | 1.768 | 0.449 | 1.447 | |
| 全变 量组 | MSR | Y=592.81b1-318.31b3-75.19SI2+462.30SI4-23.33 | 0.439 | 1.549 | 0.359 | 1.562 |
| PLSR | Y=15.29b1+13.33b2+9.5b3+7.48b4+8.53SI1+3.86SI2+5.96SI3+17.01SI4+5.03S3+10.25S4+10.62S5-18.73 | 0.290 | 1.742 | 0.470 | 1.418 | |
Tab. 5
Machine learning models based on different variable groups"
| 变量组 | 建模方法 | 建模集(n=51) | 验证集(n=26) | ||
|---|---|---|---|---|---|
| R2 | RMSE | R2 | RMSE | ||
| 波段组 | ELM | 0.617 | 1.279 | 0.533 | 1.998 |
| SVM | 0.782 | 0.985 | 0.476 | 1.996 | |
| BPNN | 0.736 | 1.067 | 0.538 | 1.460 | |
| 光谱指数组 | ELM | 0.621 | 1.274 | 0.508 | 1.986 |
| SVM | 0.769 | 0.997 | 0.409 | 2.001 | |
| BPNN | 0.730 | 1.080 | 0.459 | 1.567 | |
| 全变量组 | ELM | 0.540 | 1.403 | 0.490 | 1.565 |
| SVM | 0.533 | 1.515 | 0.488 | 1.658 | |
| BPNN | 0.705 | 1.133 | 0.556 | 1.409 | |

Fig. 3
Kriging interpolation distributions of soil salinity in tillage area"
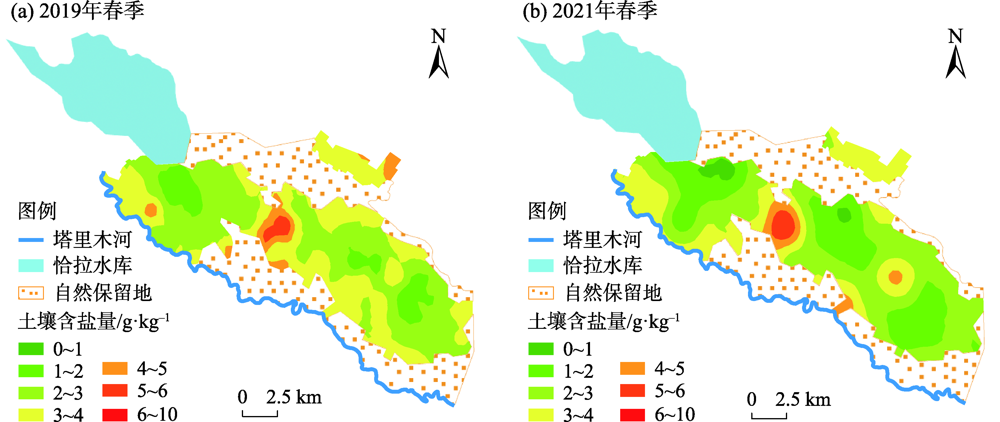

Fig. 4
Inversion grade distributions of soil salinity in tillage area"

Tab. 6
Number and proportion of pixels at different salinity levels"
| 土壤类型 | 土壤含盐量/g·kg-1 | 2019年 | 2021年 | ||
|---|---|---|---|---|---|
| 像元个数 | 面积占比/% | 像元个数 | 面积占比/% | ||
| 非盐化土(0~3 g·kg-1) | 0~1 | 4508 | 0.35 | 14 | 0.00 |
| 1~2 | 92995 | 7.17 | 366240 | 28.25 | |
| 2~3 | 622671 | 48.03 | 471548 | 36.37 | |
| 轻度盐化土(3~6 g·kg-1) | 3~4 | 428918 | 33.08 | 398125 | 30.71 |
| 4~5 | 128548 | 9.92 | 47257 | 3.65 | |
| 5~6 | 16989 | 1.31 | 10556 | 0.81 | |
| 中度盐化土(6~10 g·kg-1) | 6~10 | 1848 | 0.14 | 2737 | 0.21 |
| [1] | 梁萌, 米晓军, 李晨华, 等. 新疆准噶尔盆地未开垦盐碱土盐分与盐生植被多样性分析[J]. 干旱区地理, 2022, 45(1): 185-196. |
| [ Liang Meng, Mi Xiaojun, Li Chenhua, et al. Salinity characteristics and halophytic vegetation diversity of uncultivated saline-alkali soil in Junggar Basin, Xinjiang[J]. Arid Land Geography, 2022, 45(1): 185-196. ] | |
| [2] | 孙亚楠, 李仙岳, 史海滨, 等. 基于多源数据融合的盐分遥感反演与季节差异性研究[J]. 农业机械学报, 2020, 51(6): 169-180. |
| [ Sun Ya’nan, Li Xianyue, Shi Haibin, et al. Remote sensing inversion of soil salinity and seasonal difference analysis based on multi-source data fusion[J]. Transactions of the Chinese Society for Agricultural Machinery, 2020, 51(6): 169-180. ] | |
| [3] | 李晓明, 杨劲松, 杨奇勇. 基于电磁感应的南疆典型田块土壤盐分空间异质性研究[J]. 水土保持学报, 2011, 25(1): 167-170. |
| [ Li Xiaoming, Yang Jinsong, Yang Qiyong. Spatial heterogeneity of soil salinity in a typical field in south Xinjiang based on electromagnetic induction[J]. Journal of Soil and Water Conservation, 2011, 25(1): 167-170. ] | |
| [4] | 李彪, 王耀强. 土壤盐渍化雷达反演模拟研究[J]. 干旱区资源与环境, 2015, 29(8): 180-184. |
| [ Li Biao, Wang Yaoqiang. Radar inversion and simulation of salty soil salinization[J]. Journal of Arid Land Resources and Environment, 2015, 29(8): 180-184. ] | |
| [5] |
Sreenivas K, Venkataratnam L, Rao P V N. Dielectric properties of salt-affected soils[J]. International Journal of Remote Sensing, 1995, 16(4): 641-649.
doi: 10.1080/01431169508954431 |
| [6] | Ding J L, Yu D L. Monitoring and evaluating spatial variability of soil salinity in dry and wet seasons in the Werigan-Kuqa Oasis, China, using remote sensing and electromagnetic induction instruments[J]. Geoderma, 2014, 235: 316-322. |
| [7] |
Rao B R M, Ravi Sankar T, Dwivedi R S, et al. Spectral behaviour of salt-affected soils[J]. International Journal of Remote Sensing, 1995, 16(12): 2125-2136.
doi: 10.1080/01431169508954546 |
| [8] | 奚雪, 赵庚星, 高鹏, 等. 基于Sentinel卫星及无人机多光谱的滨海冬小麦种植区土壤盐分反演研究--以黄三角垦利区为例[J]. 中国农业科学, 2020, 53(24): 5005-5016. |
| [ Xi Xue, Zhao Gengxing, Gao Peng, et al. Inversion of soil salinity in coastal winter wheat growing area based on sentinel satellite and unmanned aerial vehicle multi-spectrum: A case study in Kenli District of the Yellow River delta[J]. Scientia Agricultura Sinica, 2020, 53(24): 5005-5016. ] | |
| [9] | 张素铭, 赵庚星, 王卓然, 等. 滨海盐渍区土壤盐分遥感反演及动态监测[J]. 农业资源与环境学报, 2018, 35(4): 349-358. |
| [ Zhang Suming, Zhao Gengxing, Wang Zhuoran, et al. Remote sensing inversion and dynamic monitoring of soil salt in coastal saline area[J]. Journal of Agricultural Resources and Environment, 2018, 35(4): 349-358. ] | |
| [10] |
周晓红, 张飞, 张海威, 等. 艾比湖湿地自然保护区土壤盐分多光谱遥感反演模型[J]. 光谱学与光谱分析, 2019, 39(4): 1229-1235.
doi: 10.3964/j.issn.1000-0593(2019)04-1229-07 |
|
[ Zhou Xiaohong, Zhang Fei, Zhang Haiwei, et al. A study of soil salinity inversion based on multispectral remote sensing index in Ebinur Lake Wetland Nature Reserve[J]. Spectroscopy and Spectral Analysis, 2019, 39(4): 1229-1235. ]
doi: 10.3964/j.issn.1000-0593(2019)04-1229-07 |
|
| [11] | 张晓光, 姜子璇, 孔繁昌. 滨海盐渍土可见近红外高光谱特征[J]. 遥感技术与应用, 2019, 34(4): 816-821. |
| [ Zhang Xiaoguang, Jiang Zixuan, Kong Fanchang. Hyperspectral characteristics of coastal saline soil with visible/near infrared spectroscopy[J]. Remote Sensing Technology and Application, 2019, 34(4): 816-821. ] | |
| [12] |
Zhang T T, Qi J G, Gao Y, et al. Detecting soil salinity with MODIS time series VI data[J]. Ecological Indicators, 2015, 52: 480-489.
doi: 10.1016/j.ecolind.2015.01.004 |
| [13] |
Alexakis D D, Daliakopoulos I N, Panagea I S, et al. Assessing soil salinity using WorldView-2 multispectral images in Timpaki, Crete, Greece[J]. Geocarto International, 2016, 33(4): 321-338.
doi: 10.1080/10106049.2016.1250826 |
| [14] | 张智韬, 魏广飞, 姚志华, 等. 基于无人机多光谱遥感的土壤含盐量反演模型研究[J]. 农业机械学报, 2019, 50(12): 151-160. |
| [ Zhang Zhitao, Wei Guangfei, Yao Zhihua, et al. Soil salt inversion model based on UAV multispectral remote sensing[J]. Transactions of the Chinese Society for Agricultural Machinery, 2019, 50(12): 151-160. ] | |
| [15] | 冯雪力, 刘全明. 基于多源遥感协同反演的区域性土壤盐渍化监测[J]. 农业机械学报, 2018, 49(7): 127-133. |
| [ Feng Xueli, Liu Quanming. Regional soil salinity monitoring based on multi-source collaborative remote sensing data[J]. Transactions of the Chinese Society for Agricultural Machinery, 2018, 49(7): 127-133. ] | |
| [16] | 刘恩, 王军涛, 常步辉, 等. 小开河引黄灌区土壤盐渍化定量遥感反演[J]. 中国农村水利水电, 2019(12): 20-24. |
| [ Liu En, Wang Juntao, Chang Buhui, et al. Quantitative remote sensing inversion of soil salinization in Xiaokaihe Yellow River irrigation district[J]. China Rural Water and Hydropower, 2019(12): 20-24. ] | |
| [17] | 张智韬, 杜瑜燕, 劳聪聪, 等. 基于雷达遥感的不同深度土壤含盐量反演模型[J]. 农业机械学报, 2020, 51(10): 243-251. |
| [ Zhang Zhitao, Du Yuyan, Lao Congcong, et al. Inversion model of soil salt content in different depths based on radar remote sensing[J]. Transactions of the Chinese Society for Agricultural Machinery, 2020, 51(10): 243-251. ] | |
| [18] | 何宝忠, 丁建丽, 刘博华, 等. 渭库绿洲土壤盐渍化时空变化特征[J]. 林业科学, 2019, 55(9): 185-196. |
| [ He Baozhong, Ding Jianli, Liu Bohua, et al. Spatiotemporal variation of soil salinization in Weigan-Kuqa River Delta Oasis[J]. Scientia Silvae Sinicae, 2019, 55(9): 185-196. ] | |
| [19] | 阿尔达克·克里木, 塔西甫拉提·特依拜, 张东, 等. 基于高光谱的ASTER影像土壤盐分模型校正及验证[J]. 农业工程学报, 2016, 32(12): 144-150. |
| [ Kelimu Ardak, Tiyip Tashpolat, Zhang Dong, et al. Calibration and validation of soil salinity estimation model based on measured hyperspectral and ASTER image[J]. Transactions of the Chinese Society of Agricultural Engineering, 2016, 32(12): 144-150. ] | |
| [20] | 丁邦新, 白云岗, 柴仲平, 等. 塔里木河下游绿洲灌区土壤盐渍化特征及季节性变化规律[J]. 水土保持通报, 2020, 40(2): 77-84. |
| [ Ding Bangxin, Bai Yungang, Chai Zhongping, et al. Soil salinization characteristics and its seasonal variation in oasis irrigation district of lower reaches of Tarim River[J]. Bulletin of Soil and Water Conservation, 2020, 40(2): 77-84. ] | |
| [21] | 叶勤, 姜雪芹, 李西灿, 等. 基于高光谱数据的土壤有机质含量反演模型比较[J]. 农业机械学报, 2017, 48(3): 164-172. |
| [ Ye Qin, Jiang Xueqin, Li Xican, et al. Comparison on inversion model of soil organic matter content based on hyperspectral data[J]. Transactions of the Chinese Society for Agricultural Machinery, 2017, 48(3): 164-172. ] | |
| [22] | Marshall F E, Smith D T, Nickerson D M. Empirical tools for simulating salinity in the estuaries in Everglades National Park, Florida[J]. Estuarine Coastal & Shelf Science, 2011, 95(4): 377-387. |
| [23] | 冯娟, 丁建丽, 杨爱霞, 等. 干旱区土壤盐渍化信息遥感建模[J]. 干旱地区农业研究, 2018, 36(1): 266-273. |
| [ Feng Juan, Ding Jianli, Yang Aixia, et al. Remote sensing modeling of soil salinization information in arid areas[J]. Agricultural Research in the Arid Areas, 2018, 36(1): 266-273. ] | |
| [24] | 吴忠强, 毛志华, 王正, 等. 基于极限学习机的浅海水深遥感反演研究[J]. 海洋测绘, 2019, 39(3): 11-15. |
| [ Wu Zhongqiang, Mao Zhihua, Wang Zheng, et al. Research on remote sensing inversion of shallow water depth based on extreme learning machine[J]. Hydrographic Surveying and Charting, 2019, 39(3): 11-15. ] | |
| [25] | 陆军胜, 陈绍民, 黄文敏, 等. 采用 SEPLS_ELM 模型估算夏玉米地上部生物量和叶面积指数[J]. 农业工程学报, 2021, 37(18): 128-135. |
| [ Lu Junsheng, Chen Shaomin, Huang Wenmin, et al. Estimation of aboveground biomass and leaf area index of summer maize using SEPLS_ELM model[J]. Transactions of the Chinese Society of Agricultural Engineering, 2021, 37(18): 128-135. ] | |
| [26] | 姜雯, 吴陈. 基于改进粒子群算法的支持向量机遥感影像分类[J]. 江苏科技大学学报(自然科学版), 2020, 34(5): 66-72. |
| [ Jiang Wen, Wu Chen. Remote sensing image classification by support vector machine based on improved particle swarm optimization[J]. Journal of Jiangsu University of Science and Technology (Natural Science Edition), 2020, 34(5): 66-72. ] | |
| [27] | 赵洪莹, 舒清态, 罗文秀, 等. 基于Landsat 8-OLI的高山松叶面积指数采样尺度优化分析[J]. 西南林业大学学报(自然科学版), 2021, 41(5): 114-120. |
| [ Zhao Hongying, Shu Qingtai, Luo Wenxiu, et al. Optimization analysis of sampling scale of Pinus densata leaf area index based on Landsat 8-OLI[J]. Journal of Southwest Forestry University (Natural Sciences Edition), 2021, 41(5): 114-120. ] | |
| [28] | 李柏年, 吴礼斌. MATLAB数据分析方法[M]. 北京: 机械工业出版社, 2012: 170-171. |
| [ Li Bainian, Wu Libin. MATLAB data analysis methods[M]. Beijing: China Machine Press, 2012: 170-171. ] | |
| [29] | 张录, 张芳, 熊黑钢, 等. 不同季节强碱土土壤呼吸影响因子分析与模型预测[J]. 干旱地区农业研究, 2017, 35(1): 71-78. |
| [ Zhang Lu, Zhang Fang, Xiong Heigang, et al. Impact factor analysis and model prediction of strong alkaline soil respiration in different seasons[J]. Agricultural Research in the Arid Areas, 2017, 35(1): 71-78. ] | |
| [30] | 新疆维吾尔自治区农业厅, 新疆土壤普查办公室. 新疆土壤[M]. 北京: 科学出版社, 1996: 151-521. |
| [Xinjiang Department of Agriculture, Xinjiang Soil Survey Office. The soil of Xinjiang[M]. Beijing: Science Press, 1996: 151-521. ] | |
| [31] |
Peck A J. Note on the role of a shallow aquifer in dryland salinity[J]. Soil Research, 1978, 16(2): 237-240.
doi: 10.1071/SR9780237 |
| [32] | 柳菲, 陈沛源, 于海超, 等. 民勤绿洲不同土地利用类型下土壤水盐的空间分布特征分析[J]. 干旱区地理, 2020, 43(2): 406-414. |
| [ Liu Fei, Chen Peiyuan, Yu Haichao, et al. Spatial distribution characteristics of soil water and salt under different land use types in Minqin Oasis[J]. Arid Land Geography, 2020, 43(2): 406-414. ] | |
| [33] | 姜凌, 李佩成, 胡安焱, 等. 干旱区绿洲土壤盐渍化分析评价[J]. 干旱区地理, 2009, 32(2): 234-239. |
| [ Jiang Ling, Li Peicheng, Hu Anyan, et al. Analysis and evaluation of soil salinization in oasis of arid region[J]. Arid Land Geography, 2009, 32(2): 234-239. ] | |
| [34] | 王雪梅, 周晓红. 渭干河-库车河三角洲绿洲棉田土壤盐分估算及遥感反演[J]. 干旱地区农业研究, 2018, 36(6): 250-254, 262. |
| [ Wang Xuemei, Zhou Xiaohong. Estimation and inversion modeling of salinity of cotton field soil using remote sensing in the delta oasis of Weigan and Kuqa Rivers[J]. Agricultural Research in the Arid Areas, 2018, 36(6): 250-254, 262. ] | |
| [35] | 边玲玲, 王卷乐, 郭兵, 等. 基于特征空间的黄河三角洲垦利县土壤盐分遥感提取[J]. 遥感技术与应用, 2020, 35(1): 211-218. |
| [ Bian Lingling, Wang Juanle, Guo Bing, et al. Remote sensing extraction of soil salinity in Yellow River delta Kenli County based on feature space[J]. Remote Sensing Technology and Application, 2020, 35(1): 211-218. ] | |
| [36] |
贾萍萍, 张俊华, 孙媛, 等. 基于实测高光谱和Landsat 8 OLI影像的土壤盐化和碱化程度反演研究[J]. 土壤通报, 2020, 51(3): 511-520.
doi: 10.1046/j.1365-2389.2000.00318.x |
|
[ Jia Pingping, Zhang Junhua, Sun Yuan, et al. Inversion of soil salinity and pH degree based on measured hyper-spectral and Landsat 8 OLI image[J]. Chinese Journal of Soil Science, 2020, 51(3): 511-520. ]
doi: 10.1046/j.1365-2389.2000.00318.x |
|
| [37] | 杨小虎, 罗艳琴, 杨海昌, 等. 玛纳斯河流域绿洲农田土壤盐分反演及空间分布特征[J]. 干旱区资源与环境, 2021, 35(2): 156-161. |
| [ Yang Xiaohu, Luo Yanqin, Yang Haichang, et al. Soil salinity retrieval and spatial distribution of oasis farmland in Manasi River Basin[J]. Journal of Arid Land Resources and Environment, 2021, 35(2): 156-161. ] |
| [1] | LIU Ruiliang, JIA Keli, LI Xiaoyu, CHEN Ruihua, WANG Yijing, ZHANG Junhua. Inversion of soil salt content by combining optical and microwave remote sensing in cultivated land [J]. Arid Land Geography, 2024, 47(3): 433-444. |
| [2] | CUI Jintao, Mamat SAWUT. Estimation of leaf water content in upland cotton based on feature band selection and machine learning [J]. Arid Land Geography, 2023, 46(11): 1836-1847. |
| [3] | WEI Huimin, JIA Keli, ZHANG Xu, ZHANG Junhua. Prediction of soil salinity based on machine learning and multispectral remote sensing in Yinchuan Plain [J]. Arid Land Geography, 2023, 46(1): 103-114. |
| [4] | ZHAO Shuang,DING Jianli,HAN Lijing,HUANG Shuai,GE Xiangyu. Response analysis and modeling of microwave dielectric properties of typical saline soil in Xinjiang [J]. Arid Land Geography, 2022, 45(5): 1534-1546. |
| [5] | YIN Hanmin,Guli JIAPAER,YU Tao,Jeanine UMUHOZA,LI Xu. Wheat yield estimation with remote sensing in northern Kazakhstan [J]. Arid Land Geography, 2022, 45(2): 488-498. |
| [6] | HU Guigui,YANG Fenli,YANG Lian’an,ZHENG Yurong,WANG Hui,CHEN Weijun,LI Yali. Spatial prediction modeling of soil organic matter content based on principal components and machine learning [J]. Arid Land Geography, 2021, 44(4): 1114-1124. |
| [7] | LI Hui-rong. Estimation of snow depth based on reflectance and bright temperature in Xilin Gol League [J]. Arid Land Geography, 2020, 43(6): 1567-1572. |
| [8] |
LIU Fei, CHEN Pei-yuan, YU Hai-chao, MA Jin-zhu .
Spatial distribution characteristics of soil water and salt under different land use types in Minqin Oasis [J]. Arid Land Geography, 2020, 43(2): 406-414. |
| [9] | WANG Dan-dan, YU Zhi-tong, CHENG Meng, ZHAO Cheng-yi, DING Jian-li, ZHANG Xiao-lei. Characteristics of soil salinity under different land use types in Weigan River Oasis [J]. 干旱区地理, 2018, 41(2): 349-357. |
| [10] | DENG Bao-shan,WAHAP Halik,DANG Jian-hua,ZHANG Yu-ping,XUAN Jun-wei. Coupled analysis of spatio-temporal variability of groundwater depth and soil salinity in Keriya Oasis [J]. , 2008, 38(3): 599-607. |
|
||