Arid Land Geography ›› 2025, Vol. 48 ›› Issue (7): 1243-1254.doi: 10.12118/j.issn.1000-6060.2024.527
• Tourism Geography • Previous Articles Next Articles
XIA Ziyang1( ), XIA Yunfan2, WANG Ning1, LIN Wei1, MA Lina1, TAN Xiaoping1, ZHANG Yanzhen1, JIAO Rui1
Received:2024-09-03
Revised:2024-11-29
Online:2025-07-25
Published:2025-07-04
XIA Ziyang, XIA Yunfan, WANG Ning, LIN Wei, MA Lina, TAN Xiaoping, ZHANG Yanzhen, JIAO Rui. Spatial pattern and influencing factors of tourism elements in the urban agglomeration on the northern slope of Tianshan Mountains based on POI[J].Arid Land Geography, 2025, 48(7): 1243-1254.

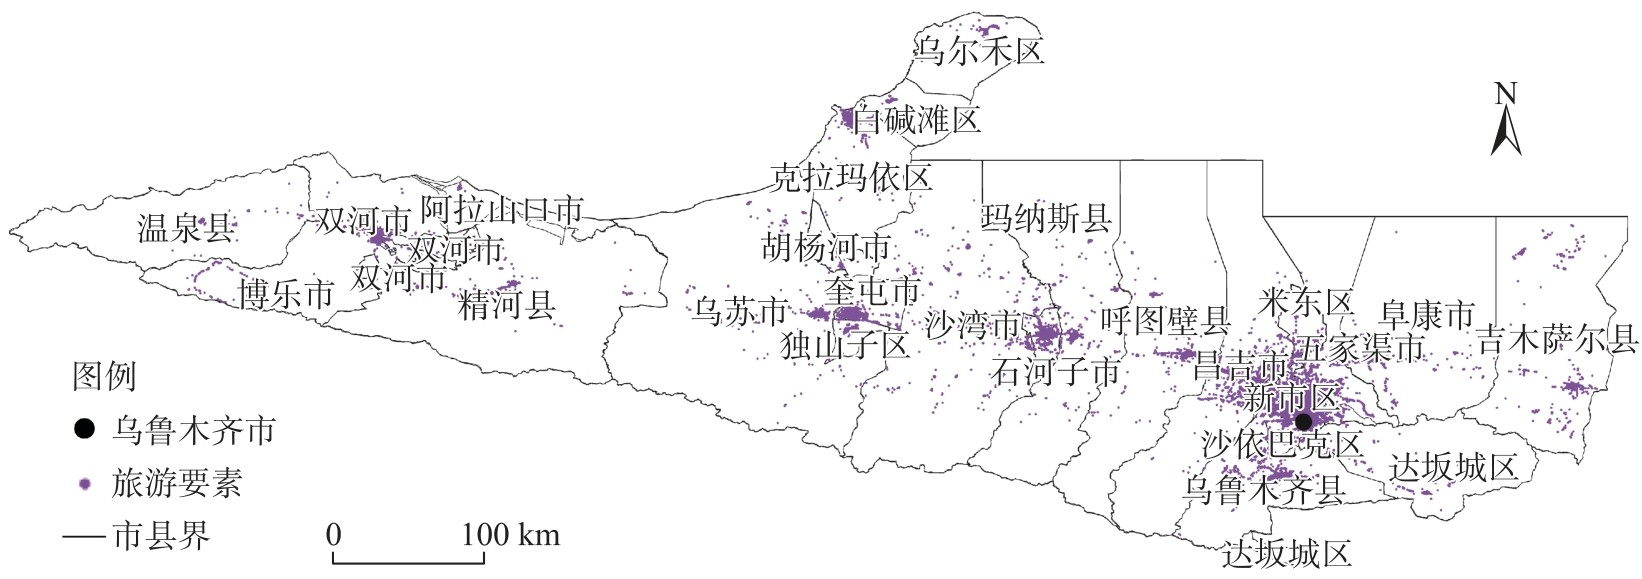
Fig. 1
Schematic diagram of the study area"
Tab. 1
Classification and statistics of POIs of tourism elements in the urban agglomeration on the northern slope of Tianshan Mountains"
| 要素 | POI类型 | POI数量 | 百分比/% |
|---|---|---|---|
| “食” | 餐饮场所:餐厅、咖啡冷饮、蛋糕甜品店等 | 38797 | 27.43 |
| “住” | 住宿服务相关:招待所、宾馆酒店、民宿等 | 4684 | 3.31 |
| “行” | 交通设施相关:停车场、火车站、飞机场等 | 12851 | 9.08 |
| “游” | 风景名胜相关:景点、纪念馆、公园、广场等 | 1075 | 0.76 |
| “购” | 购物服务相关:综合市场、专卖店、超市等 | 76525 | 54.10 |
| “娱” | 影剧院、度假疗养场所、娱乐场所、运动场馆等 | 7528 | 5.32 |
Tab. 2
Influencing factors and data sources"
| 一级指标 | 二级指标 | 年份 | 数据来源 |
|---|---|---|---|
| 基础设施 | 夜间灯光指数( | 2022 | 国家地球系统科学数据中心( |
| A级景区数量( | 2022 | 新疆维吾尔自治区(新疆生产建设兵团)文化和旅游厅(局)官方网站数据( | |
| 经济发展水平 | GDP( | 2022 | 资源环境科学数据平台( |
| 人口 | 人口密度( | 2022 | 美国能源部橡树岭国家实验室(ORNL, |
| 产业结构 | 第三产业比重( | 2022 | 研究区内各区县官网发布 |
| 交通 | 路网密度( | 2023 | 开放街道地图(OSM)路网数据 |
| 自然环境 | 年累积降水量( | 2022 | 国家地球系统科学数据中心( |
| 年平均气温( | 2022 | 国家地球系统科学数据中心( | |
| DEM( | 2010 | 国家地球系统科学数据中心( | |
| 坡度( | 2010 | DEM数据基于ArcGIS坡度计算得到 |
Tab. 3
Characteristics of spatial agglomeration of each tourism element in the urban agglomeration on the northern slope of Tianshan Mountains"
| 要素 | 平均观测距离/km | 期望平均距离/km | 最近邻指数 | Z值 | P值 | 空间分布类型 |
|---|---|---|---|---|---|---|
| “食” | 0.068 | 1.552 | 0.044 | -360.24 | 0 | 显著集聚型 |
| “住” | 0.364 | 4.340 | 0.084 | -119.94 | 0 | 显著集聚型 |
| “行” | 0.278 | 2.678 | 0.104 | -194.37 | 0 | 显著集聚型 |
| “游” | 2.881 | 9.413 | 0.306 | -43.53 | 0 | 显著集聚型 |
| “购” | 0.053 | 1.095 | 0.049 | -503.42 | 0 | 显著集聚型 |
| “娱” | 0.052 | 3.556 | 0.147 | -141.51 | 0 | 显著集聚型 |
| “六要素” | 0.053 | 0.828 | 0.064 | -673.70 | 0 | 显著集聚型 |

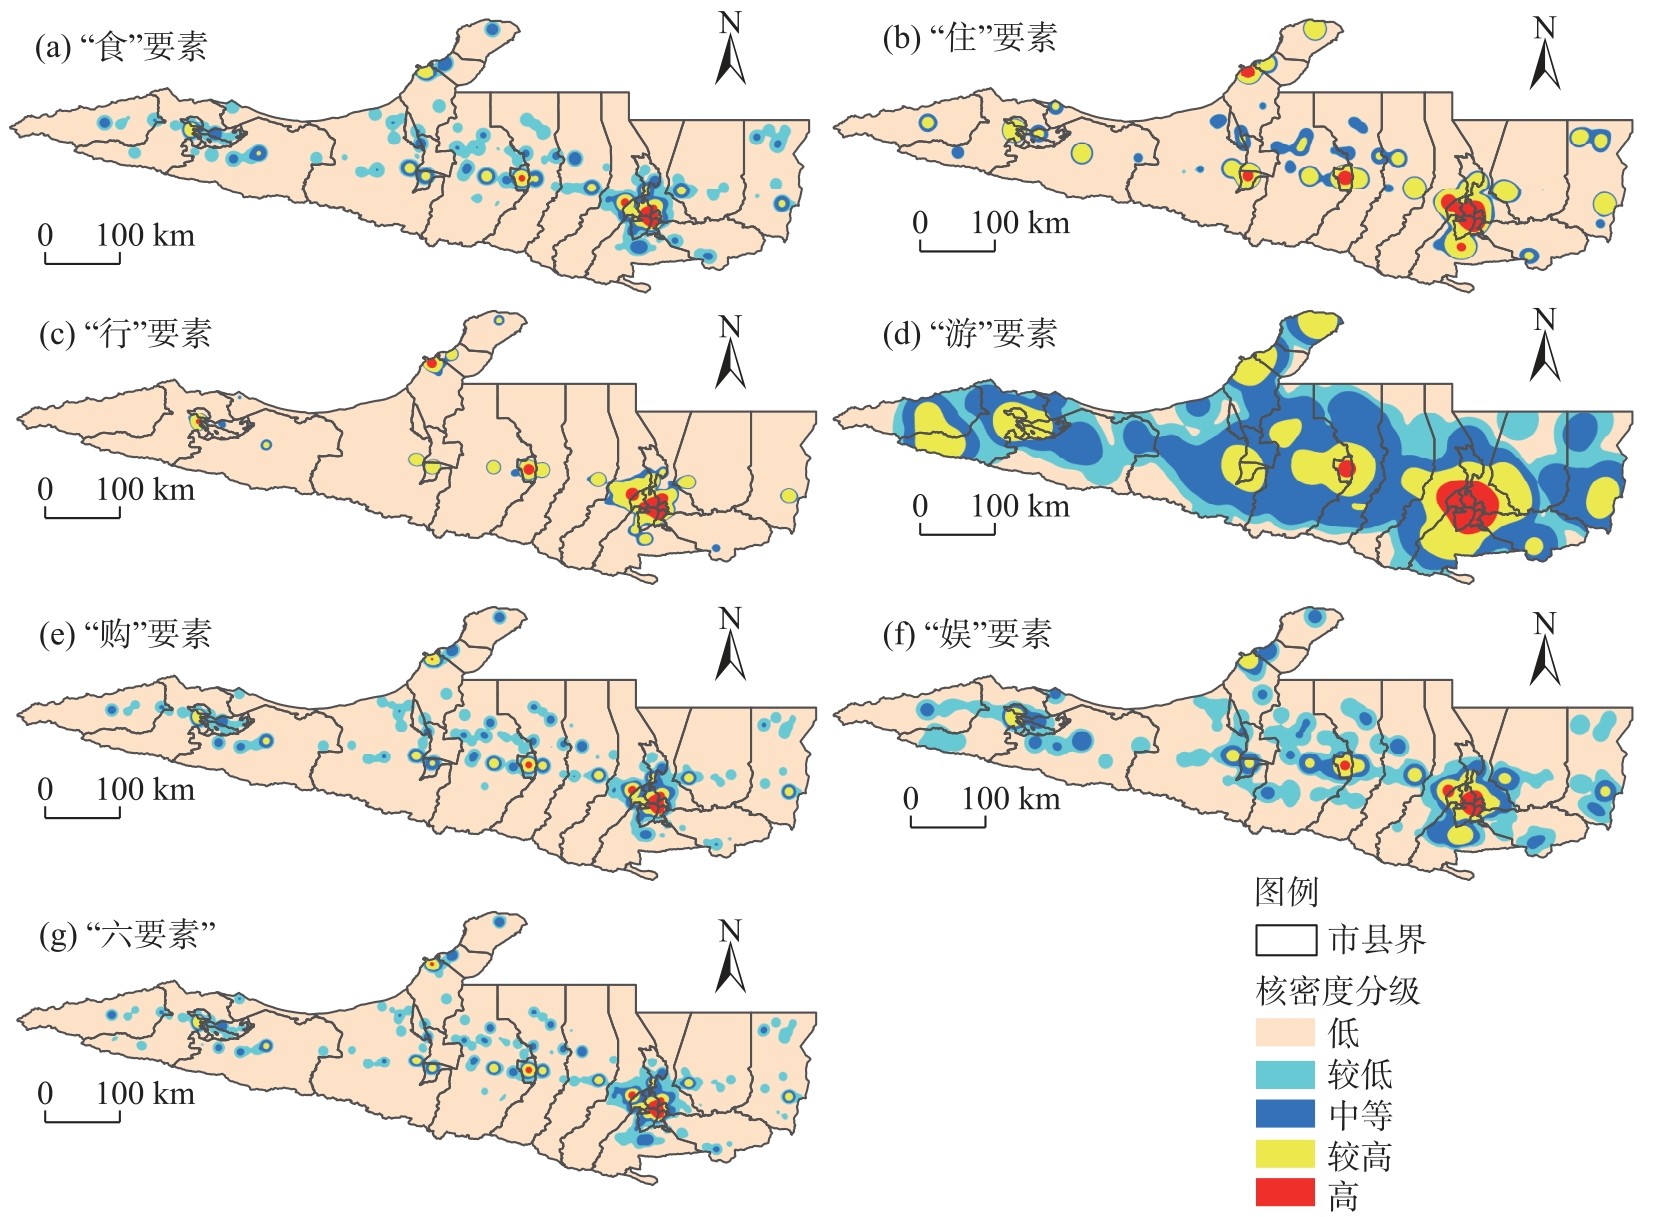
Fig. 2
Kernel density of spatial distribution of tourism elements in the urban agglomeration on the northern slope of Tianshan Mountains"
Tab. 4
Spatial autocorrelation test of each tourism element in the city cluster on the northern slope of Tianshan Mountains"
| 要素 | “住” | “游” | “行” | “食” | “购” | “娱” |
|---|---|---|---|---|---|---|
| “住” | - | - | - | - | - | - |
| “游” | 0.193** | - | - | - | - | - |
| “行” | 0.319*** | 0.246** | - | - | - | - |
| “食” | 0.282** | 0.214** | 0.359*** | - | - | - |
| “购” | 0.281** | 0.199** | 0.362*** | 0.333** | - | - |
| “娱” | 0.299** | 0.240** | 0.394*** | 0.351*** | 0.350*** | - |

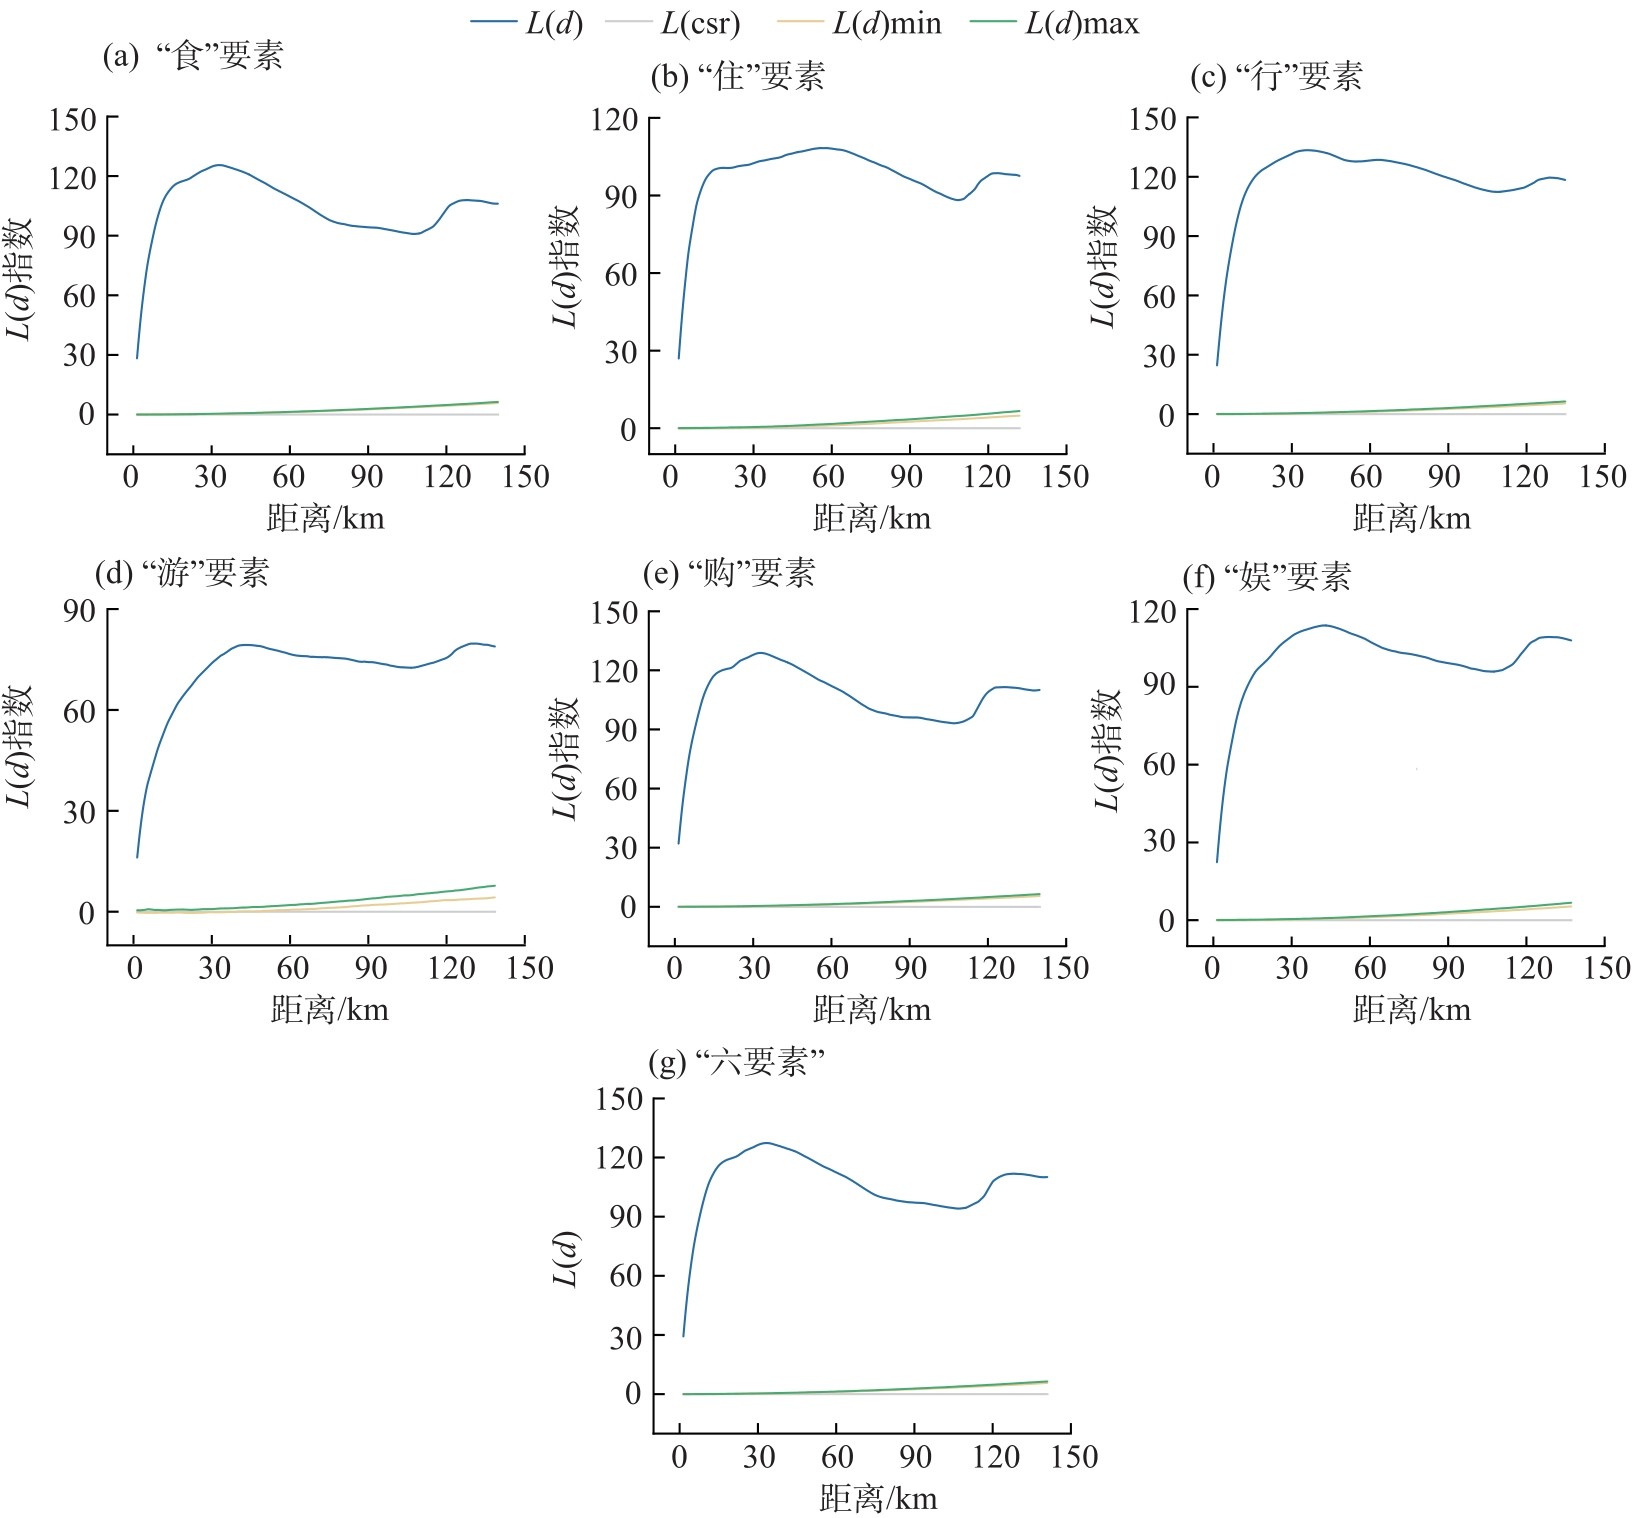
Fig. 3
Ripley’s K-function analysis of each tourism element in the urban agglomeration on the northern slope of Tianshan Mountains"
Tab. 5
One-way influence analysis"
| 要素类型 | ||||||||||
|---|---|---|---|---|---|---|---|---|---|---|
| “食” | 0.428*** | 0.304*** | 0.394*** | 0.212*** | 0.188*** | 0.161*** | 0.010*** | 0.010*** | 0.027*** | 0.002 |
| “住” | 0.427*** | 0.215*** | 0.315*** | 0.172*** | 0.293*** | 0.142*** | 0.017*** | 0.014*** | 0.032*** | 0.004** |
| “行” | 0.418*** | 0.269*** | 0.402*** | 0.209*** | 0.201*** | 0.153*** | 0.015*** | 0.014*** | 0.033*** | 0.003 |
| “游” | 0.419*** | 0.164*** | 0.174*** | 0.087*** | 0.411*** | 0.132*** | 0.051*** | 0.039*** | 0.077*** | 0.011*** |
| “购” | 0.415*** | 0.319*** | 0.433*** | 0.221*** | 0.159*** | 0.150*** | 0.009*** | 0.008*** | 0.022*** | 0.001 |
| “娱” | 0.448*** | 0.275*** | 0.325*** | 0.179*** | 0.245*** | 0.142*** | 0.019*** | 0.016*** | 0.040*** | 0.005*** |
| “六要素” | 0.422*** | 0.336*** | 0.470*** | 0.246*** | 0.150*** | 0.145*** | 0.008*** | 0.009*** | 0.023*** | 0.003 |

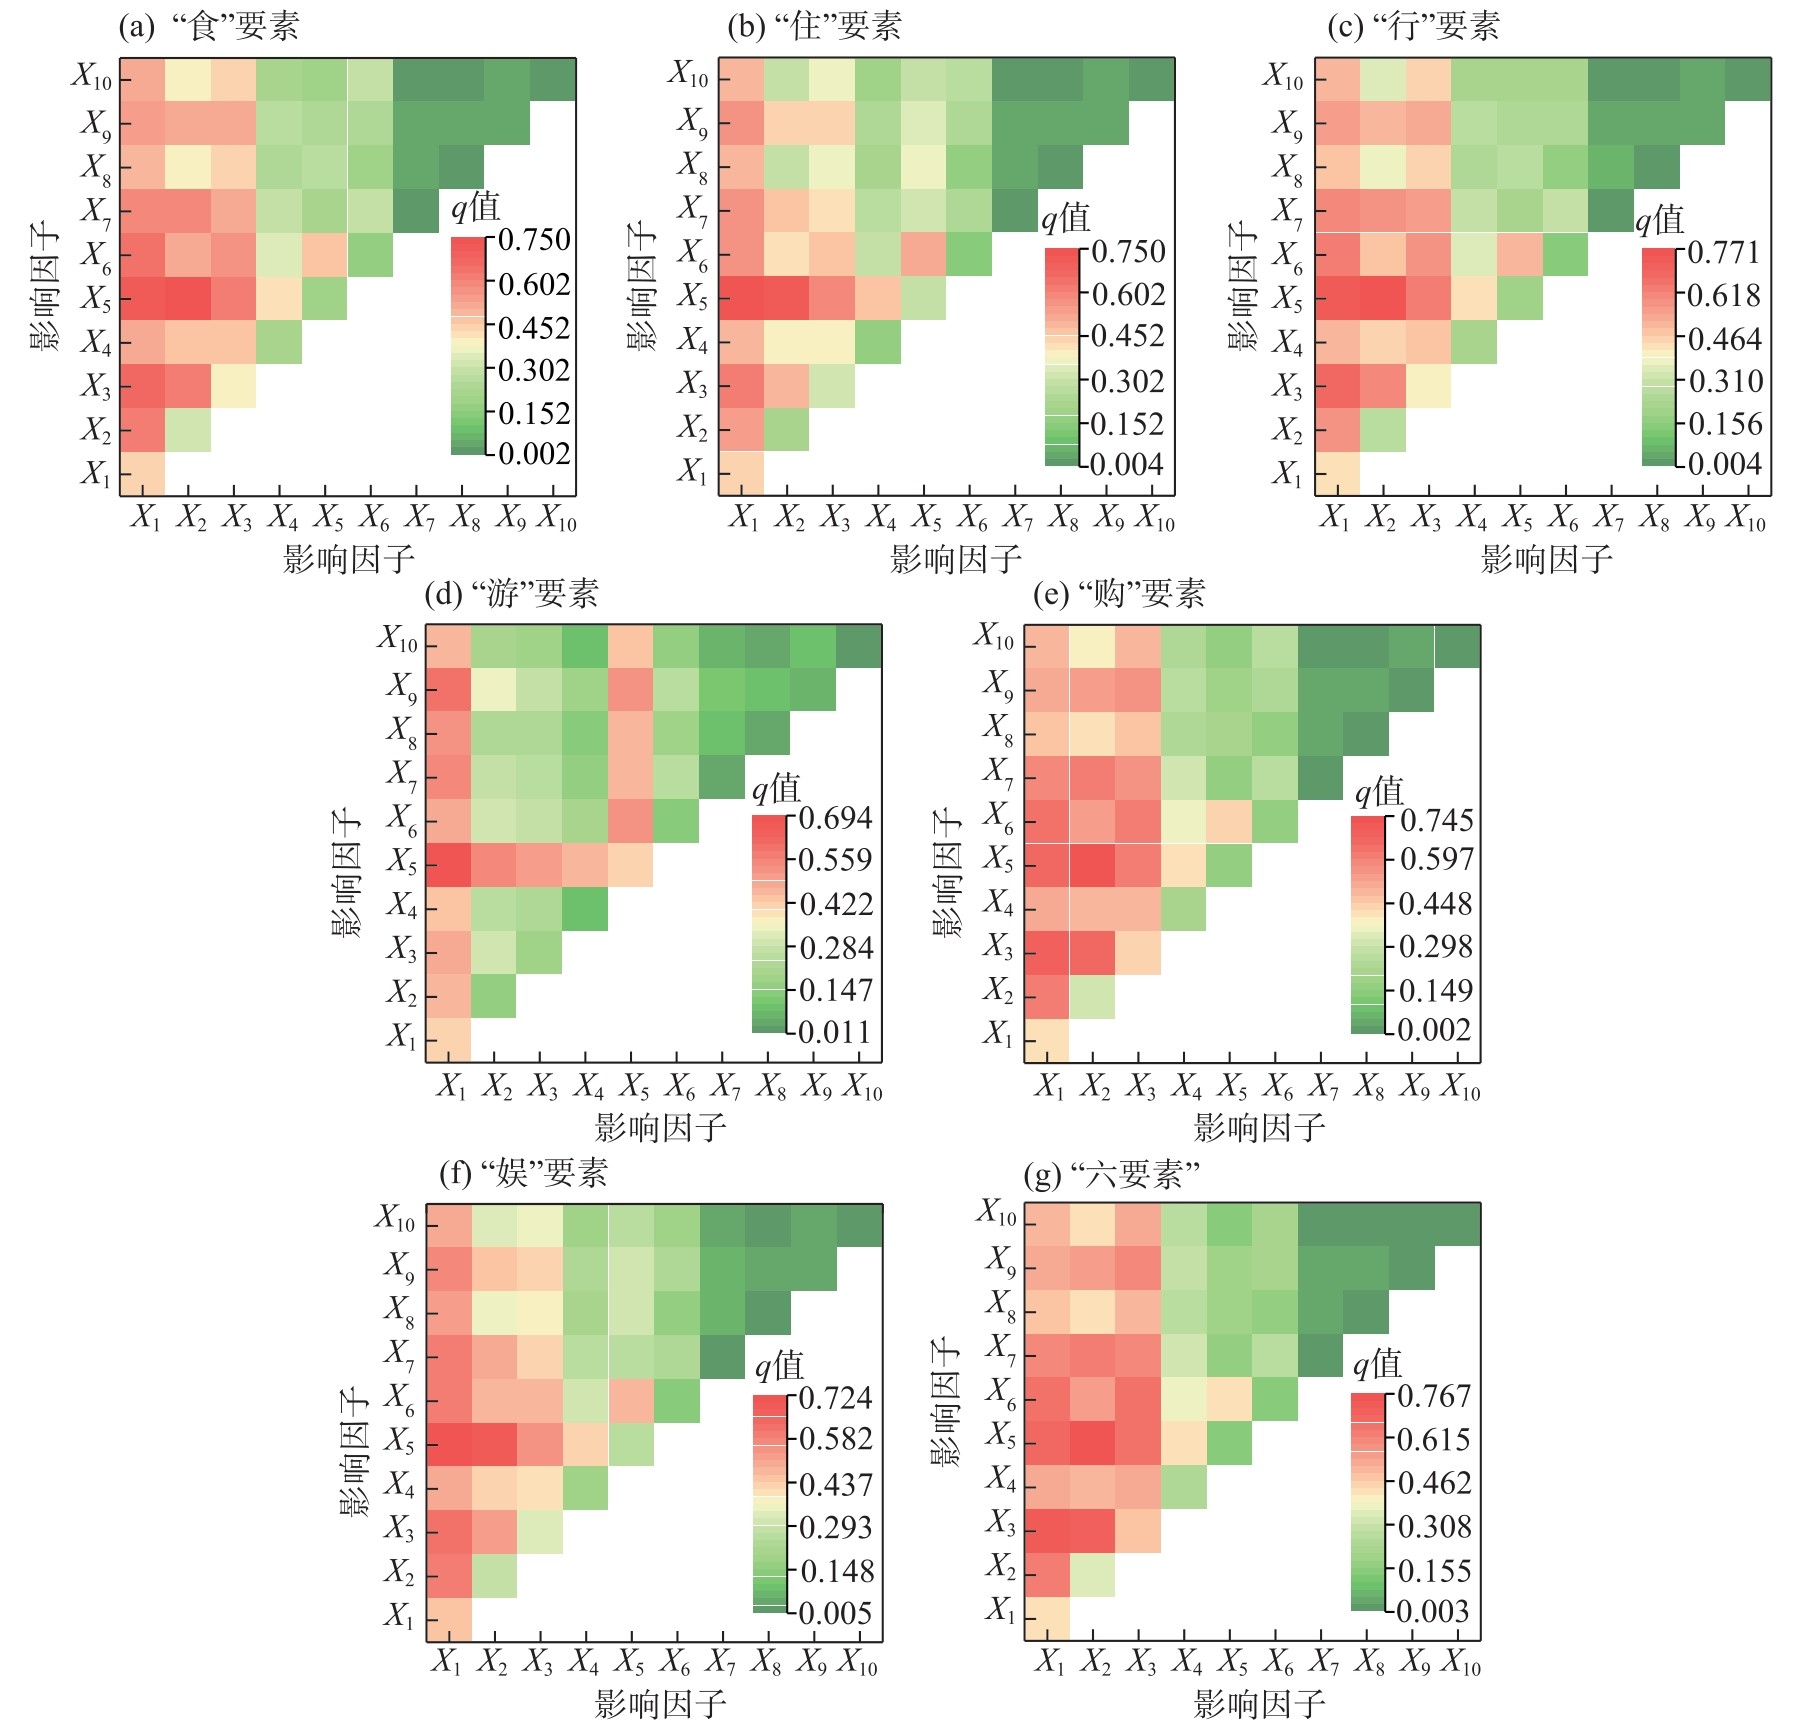
Fig. 4
Interaction analysis of factors influencing the spatial differentiation of each tourism element in the urban agglomeration on the northern slope of Tianshan Mountains"
| [1] | 杨效忠, 李冬花, 黄剑锋, 等. 线性旅游目的地的概念框架与研究展望[J]. 地理学报, 2023, 78(12): 2939-2957. |
| [ Yang Xiaozhong, Li Donghua, Huang Jianfeng, et al. Conceptual framework and research perspectives of route tourism destinations[J]. Acta Geographica Sinica, 2023, 78(12): 2939-2957. ] | |
| [2] | 陈静, 吕雁琴, 潘云峰. 新疆旅游产业集群的测度及其驱动因子研究[J]. 地域研究与开发, 2021, 40(5): 107-112. |
| [ Chen Jing, Lü Yanqin, Pan Yunfeng. Research on measurement and driving factors of tourism industry cluster in Xinjiang[J]. Areal Research and Development, 2021, 40(5): 107-112. ] | |
| [3] | 王凯, 刘美伦, 谭佳欣. 旅游产业集聚与旅游生态安全的互动关系研究——以长江中游城市群为例[J]. 中南林业科技大学学报(社会科学版), 2024, 18(2): 70-82. |
| [ Wang Kai, Liu Meilun, Tan Jiaxin. Research on the interactive relationship between tourism industry agglomeration and tourism ecological security: A case study of the urban agglomerations in the middle reaches of Yangtze River[J]. Journal of Central South University of Forestry & Technology (Social Sciences Edition), 2024, 18(2): 70-82. ] | |
| [4] | 李会琴, 惠余杰, 代姗姗, 等. 中国5A级旅游景区网络关注度时空格局演变与影响因素[J]. 中国生态旅游, 2024, 14(1): 151-166. |
| [ Li Huiqin, Hui Yujie, Dai Shanshan, et al. Spatiotemporal evolution of network attention of 5A tourist attractions and its influencing factors in China[J]. Journal of Chinese Ecotourism, 2024, 14(1): 151-166. ] | |
| [5] | 杨欢, 祁妤, 张赫, 等. 陕西省乡村民宿价格分级的空间分异及其影响因素[J]. 经济地理, 2023, 43(12): 204-211. |
| [ Yang Huan, Qi Yu, Zhang He, et al. Spatial differentiation and Influencing factors of price classificaton of rural homestays in Shaanxi Province[J]. Economic Geography, 2023, 43(12): 204-211. ] | |
| [6] | 李新静, 白洋, 何昭丽, 等. 新疆高星级农家乐空间分布及驱动机制[J]. 西北师范大学学报(自然科学版), 2022, 58(4): 120-127. |
| [ Li Xinjing, Bai Yang, He Zhaoli, et al. Spatial distribution and driving mechanisms of high-star agritainments in Xinjiang[J]. Journal of Northwest Normal University (Natural Science Edition), 2022, 58(4): 120-127. ] | |
| [7] | 肖博鸿, 马源. 广州历史街区旅游要素空间分布与交通可达性关联研究[J]. 经济地理, 2024, 44(4): 231-240. |
| [ Xiao Bohong, Ma Yuan. Correlation study between spatial distribution of tourism elements and transportation accessibility in historic districts of Guangzhou City[J]. Economic Geography, 2024, 44(4): 231-240. ] | |
| [8] | 王甜, 杨兆萍, 韩芳, 等. 基于地理探测器的新疆A级旅游景区时空演变特征及其影响机理[J]. 中国科学院大学学报, 2023, 40(3): 322-332. |
| [ Wang Tian, Yang Zhaoping, Han Fang, et al. Spatial-temporal evolution characteristics and influence mechanism of Xinjiang A-grade tourist attractions based on geo-detector[J]. Journal of University of Chinese Academy of Sciences, 2023, 40(3): 322-332. ] | |
| [9] | Jiang Y H, Huang W, Xiong X X, et al. Investigating spatial patterns and determinants of tourist attractions utilizing POI data: A case study of Hubei Province, China[J]. Heliyon, 2024, 10(11): e32370, doi: 10.1016/j.heliyon.2024.e32370. |
| [10] | 章坤, 谢朝武. 城市旅游产业要素“距离-集聚”空间关联模式[J]. 中国生态旅游, 2024, 14(3): 621-635. |
| [ Zhang Kun, Xie Chaowu. Spatial correlation pattern of “distance-agglomeration” of urban tourism industry factors[J]. Journal of Chinese Ecotourism, 2024, 14(3): 621-635. ] | |
| [11] | 张坤, 苏欣蕾, 苏凯红, 等. 基于POI大数据的京津冀旅游资源空间分异研究[J]. 地域研究与开发, 2021, 40(1): 103-108. |
| [ Zhang Kun, Su Xinlei, Su Kaihong, et al. Research on distribution characteristic of tourism resource in Beijing-Tianjin-Hebei region based on POI big data[J]. Areal Research and Development, 2021, 40(1): 103-108. ] | |
| [12] | 张爱霞, 马斌斌, 卢家旺, 等. 基于POI数据挖掘的兰州市休闲旅游空间格局及其驱动机制研究[J]. 干旱区资源与环境, 2022, 36(11): 200-208. |
| [ Zhang Aixia, Ma Binbin, Lu Jiawang, et al. Spatial pattern and driving mechanism of leisure tourism in Lanzhou[J]. Journal of Arid Land Resources and Environment, 2022, 36(11): 200-208. ] | |
| [13] | Fang C L, Gao Q, Zhang X L, et al. Spatiotemporal characteristics of the expansion of an urban agglomeration and its effect on the eco-environment: Case study on the northern slope of the Tianshan Mountains[J]. Science China Earth Science, 2019, 62: 1461-1472. |
| [14] | Yan Y B, Chai Z Y, Yang X D, et al. The temporal and spatial changes of the ecological environment quality of the urban agglomeration on the northern slope of Tianshan Mountain and the influencing factors[J]. Ecological Indicators, 2021, 133: 108380, doi: 10.1016/j.ecolind.2021.108380. |
| [15] | 万红莲, 王晓利, 黄敏, 等. 基于POI数据的关中平原城市群县域旅游要素空间格局及影响因素研究[J]. 干旱区资源与环境, 2024, 38(6): 200-208. |
| [ Wan Honglian, Wang Xiaoli, Huang Min, et al. Spatial pattern of county tourism elements in Guanzhong Plain urban agglomeration and influencing factors: Point of interest-based analysis[J]. Journal of Arid Land Resources and Environment, 2024, 38(6): 200-208. ] | |
| [16] | 胡宇娜, 马榕禧, 高晓莘, 等. 基于POI数据的海岛旅游要素空间分布特征研究——以山东长岛为例[J]. 东北师大学报(自然科学版), 2023, 55(2): 134-139. |
| [ Hu Yuna, Ma Rongxi, Gao Xiaoshen, et al. Research on the spatial distribution characteristics of island tourism elements based on POI data: A case study of Shandong Changdao[J]. Journal of Northeast Normal University (Natural Science Edition), 2023, 55(2): 134-139. ] | |
| [17] | 魏娟, 钟永德, 朱安妮. 旅游要素POI对夜间灯光指数的贡献及其空间特征分析[J]. 生态经济, 2021, 37(5): 139-147. |
| [ Wei Juan, Zhong Yongde, Zhu Anni. Analysis of the contribution of tourism elements POI to night light index and its spatial characteristics[J]. Ecological Economy, 2021, 37(5): 139-147. ] | |
| [18] | 赵沁娜, 李航. 国家工业遗产空间分异特征及形成机理研究[J]. 城市问题, 2022(11): 54-64. |
| [ Zhao Qinna, Li Hang. Research on the spatial differentiation characteristics and formation mechanism of national industrial heritage[J]. Urban Problems, 2022(11): 54-64. ] | |
| [19] | 刘敏, 郝炜. 山西省国家A级旅游景区空间分布影响因素研究[J]. 地理学报, 2020, 75(4): 878-888. |
| [ Liu Min, Hao Wei. Spatial distribution and its influencing factors of national A-level tourist attractions in Shanxi Province[J]. Acta Geographica Sinica, 2020, 75(4): 878-888. ] | |
| [20] | 冒小飞, 王克, 周京奎. 京津冀地区制造业、生产性服务业协同演进与机理研究[J]. 管理学报, 2024, 21(9): 1302-1311. |
| [ Mao Xiaofei, Wang Ke, Zhou Jingkui. Research on collaborative evolution and mechanism of manufacturing and producer services in Beijing-Tianjin-Hebei region[J]. Chinese Journal of Management, 2024, 21(9): 1302-1311. ] | |
| [21] | 孙小龙, 郜捷, 林璧属, 等. 管制型制度环境、旅游投资与区域旅游经济增长——来自贵州旅发大会的证据[J]. 西北师范大学学报(自然科学版), 2022, 58(6): 93-100. |
| [ Sun Xiaolong, Gao Jie, Lin Bishu, et al. Regulated institutional environment, tourism investment and regional tourism economic growth: Evidence from the tourism industry development conference of Guizhou Province[J]. Journal of Northwest Normal University (Natural Science Edtion), 2022, 58(6): 93-100. ] | |
| [22] | 刘敏, 郝炜, 张芙蓉. 山西省A级旅游景区空间分布与影响因素[J]. 经济地理, 2020, 40(8): 231-240. |
| [ Liu Min, Hao Wei, Zhang Furong. The spatial distribution and influence factors of A-level scenic spots in Shanxi Province[J]. Economic Geography, 2020, 40(8): 231-240. ] | |
| [23] | 蔚丹丹, 李山, 张粮锋, 等. 旅游气候舒适性评价: 模型优化与中国案例[J]. 旅游学刊, 2021, 36(5): 14-28. |
| [ Yu Dandan, Li Shan, Zhang Liangfeng, et al. Evaluate tourism climate using modified holiday climate index in China[J]. Tourism Tribune, 2021, 36(5): 14-28. ] | |
| [24] | 贾垚焱, 胡静, 刘大均, 等. 长江中游城市群A级旅游景区空间演化及影响机理[J]. 经济地理, 2019, 39(1): 198-206. |
| [ Jia Yaoyan, Hu Jing, Liu Dajun, et al. Spatial evolution and influence mechanism of A-level scenic spots in urban agglomeration in the middle reaches of the Yangtze River[J]. Economic Geography, 2019, 39(1): 198-206. ] | |
| [25] | 纪颖超, 武克军, 陈焕桃, 等. 中国高原地区涉旅安全事件时空分异及其驱动因子识别[J]. 中国生态旅游, 2023, 13(5): 870-889. |
| [ Ji Yingchao, Wu Kejun, Chen Huantao, et al. Spatio-temporal differentiation of tourism safety events and its driving factors in the plateau area of China[J]. Journal of Chinese Ecotourism, 2023, 13(5): 870-889. ] | |
| [26] | 马晨, 王宏卫, 谈波, 等. 新疆典型绿洲城乡聚落规模体系特征及空间重构——以渭干河-库车河三角洲绿洲为例[J]. 地理学报, 2022, 77(4): 852-868. |
| [ Ma Chen, Wang Hongwei, Tan Bo, et al. Characteristics and spatial reconstruction of an urban-rural settlement scale system in a typical oasis in Xinjiang: A case study of the Ugan-Kuqa River Delta oasis[J]. Acta Geographica Sinica, 2022, 77(4): 852-868. ] | |
| [27] | 唐鸿, 许春晓. 长沙市休闲旅游资源空间分布特征及形成机制[J]. 经济地理, 2022, 42(12): 214-223. |
| [ Tang Hong, Xu Chunxiao. Spatial distribution characteristics and formation mechanism of urban leisure tourism resources in Changsha City[J]. Economic Geography, 2022, 42(12): 214-223. ] | |
| [28] | 关颖, 朱翊. 基于空间分析的区域地质灾害点的分布特征研究——以新疆为例[J]. 测绘工程, 2016, 25(9): 15-19. |
| [ Guan Ying, Zhu Yi. A study of the distribution characteristics of regional geological hazards based on spatial analysis: A case of Xinjiang[J]. Engineering of Surveying and Mapping, 2016, 25(9): 15-19. ] | |
| [29] | 刘佳, 赵青华, 王慧. 乡村旅游发展促进农村可持续生计的空间效应及机制[J]. 自然资源学报, 2023, 38(2): 490-510. |
| [ Liu Jia, Zhao Qinghua, Wang Hui. Study on the spatial effect and mechanism of rural tourism development promoting rural sustainable livelihood[J]. Journal of Natural Resources, 2023, 38(2): 490-510. ] | |
| [30] | 王劲峰, 徐成东. 地理探测器: 原理与展望[J]. 地理学报, 2017, 72(1): 116-134. |
| [ Wang Jinfeng, Xu Chengdong. Geodetector: Principle and prospective[J]. Acta Geographica Sinica, 2017, 72(1): 116-134. ] | |
| [31] | 谢凯, 秦志龙, 张荣杰, 等. 交通基础设施改善与家庭旅游消费——来自“高铁县”的经验证据[J]. 数量经济技术经济研究, 2023, 40(12): 90-110. |
| [ Xie Kai, Qin Zhilong, Zhang Rongjie, et al. Improved transportation infrastructure and household tourism consumption: Empirical evidence from counties with high-speed railway[J]. Journal of Quantitative & Technological Economics, 2023, 40(12): 90-110. ] | |
| [32] | 王华, 孙根年, 王亚力, 等. 武陵山片区旅游空间模式对运输通道演化的响应机理研究[J]. 地理科学, 2021, 41(5): 851-862. |
| [ Wang Hua, Sun Gennian, Wang Yali, et al. The response mechanism of tourism spatial model to the evolution of transport corridor in the Wuling Moutain area[J]. Scientia Geographica Sinica, 2021, 41(5): 851-862. ] | |
| [33] | 龙顺发, 曹开军, 商宁. 旅游促进乡村发展的空间效应——基于新疆83个县市的实证分析[J]. 地理科学, 2024, 44(8): 1387-1395. |
| [ Long Shunfa, Cao Kaijun, Shang Ning. Spatial effect of tourism promoting rural development: An empirical analysis of 83 counties in Xinjiang Uygur Autonomous Region[J]. Scientia Geographica Sinica, 2024, 44(8): 1387-1395. ] | |
| [34] | 白洋, 谭李娜, 陈春燕, 等. 城际列车对新疆旅游经济高质量发展的影响效应及驱动机制[J]. 干旱区地理, 2023, 46(4): 658-666. |
| [ Bai Yang, Tian Lina, Chen Chunyan, et al. Influence effect and driving mechanism of intercity trains on high-quality development of tourism economy in Xinjiang[J]. Arid Land Geography, 2023, 46(4): 658-666. ] |
|
||