- Apr. 8, 2025
Arid Land Geography ›› 2022, Vol. 45 ›› Issue (2): 512-521.doi: 10.12118/j.issn.1000-6060.2021.280
• Earth Information Sciences • Previous Articles Next Articles
ZHAO Zhixin1,2( ),HUO Aidi1,2(),ZHANG Dan3,YI Xiu1,2,CHEN Siming1,2,CHEN Sibin1,2,CHEN Jian1,2
Received:2021-06-18
Revised:2021-09-26
Online:2022-03-25
Published:2022-04-02
Contact:
Aidi HUO
E-mail:zhao1201xin@163.com;huoaidi@163.com
ZHAO Zhixin,HUO Aidi,ZHANG Dan,YI Xiu,CHEN Siming,CHEN Sibin,CHEN Jian. Assessing heat wave risk in Ningxia segment based on remote sensing[J].Arid Land Geography, 2022, 45(2): 512-521.

Fig. 1
Location and elevation of the study area"

Tab. 1
Detailed description of the data"
| 数据名称 | 观测平台 | 时间分辨率/次·d-1 | 空间分辨率/km | 数据来源 |
|---|---|---|---|---|
| LST | Aqua | 2 | 1.00 | https://modis.gsfc.nasa.gov/ |
| NDVI | Aqua | 2 | 0.25 | https://modis.gsfc.nasa.gov/ |
| DMSP/OLS夜间灯光 | DMSP | 1 | 1.00 | http://ngdc.noaa.gov/eog/ |
| DEM | Terra | 2 | 0.08 | http://www.gscloud.cn/search |
| 气象数据 | - | - | - | http://data.cma.cn |
| 社会统计数据 | - | - | - | 2014、2017年和2019年宁夏统计年鉴 |
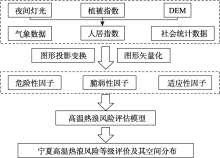
Fig. 2
Frame of heat wave risk assessment"

Tab. 2
Evaluation indexes and weight values of heat waves risk"
| 目标层(A) | 准则层(B) | 指标层(C) |
|---|---|---|
| 高温热浪 风险A | 高温热浪危险性B1(+0.46) | 地表温度C1(+0.4) |
| 气温C2(+0.4) | ||
| 降水量C3(-0.1) | ||
| 风速C4(-0.05) | ||
| 气压C5(-0.05) | ||
| 社会经济脆弱性B2(+0.31) | 人居指数C6(+0.6) | |
| 常住人口C7(+0.24) | ||
| 14岁以下65岁以上 人口占比C8(+0.1) | ||
| 建筑施工人员C9 (+0.06) | ||
| 高温热浪风险适应性B3 (-0.23) | 人均GDP C10(-0.6) | |
| 城镇每百户空调拥有率C11(-0.18) | ||
| 城镇卫生机构床位数C12(-0.11) | ||
| 城镇医疗卫生技术人员C13(-0.11) |

Fig. 3
Spatial distributions of hazard factors of heat wave"

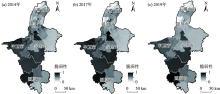
Fig. 4
Spatial distributions of vulnerability factors of heat wave"

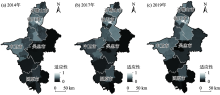
Fig. 5
Spatial distributions of adaptation factors of heat wave"
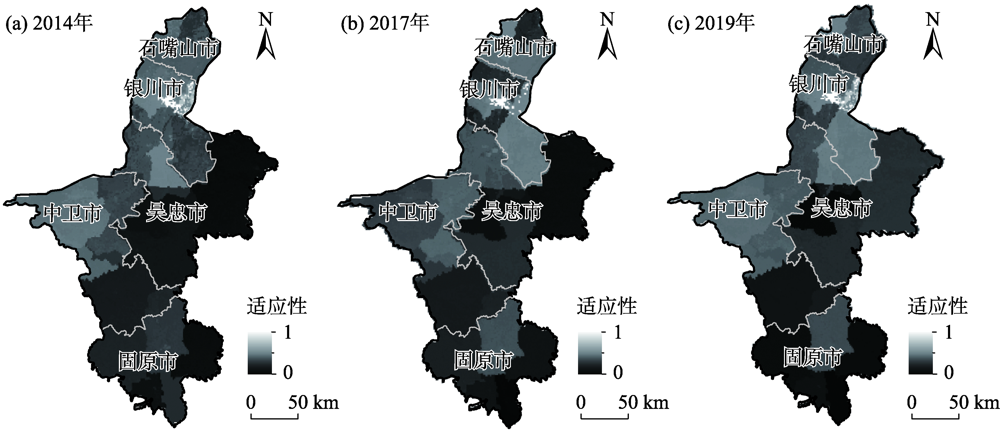

Fig. 6
Spatial distributions of the heat wave risk of Ningxia"


Fig. 7
Variations of heat risk index in different directions"
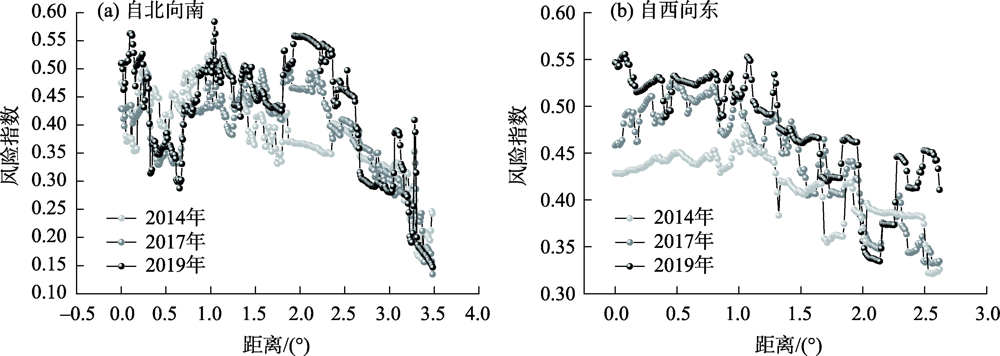

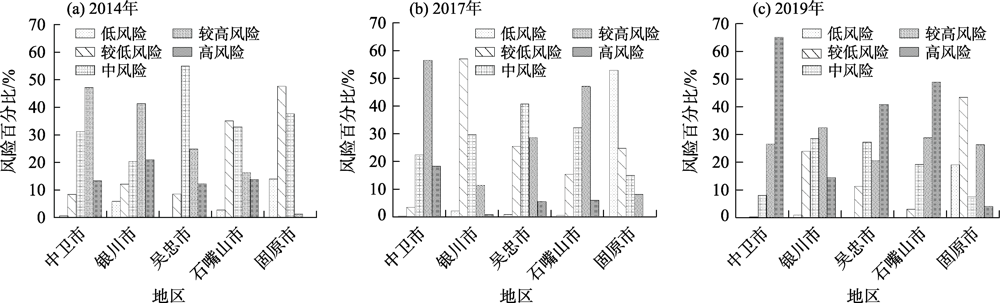
Fig. 8
Area proportions of different heat risk levels of each district in Ningxia"
| [1] | IPCC. Summary for policymakers[C]// Climate Change 2013: The Physical Science Basis. Contribution of Working Group I to the Fifth Assessment Report of the Intergovernmental Panel on Climate Change. Cambridge: Cambridge University Press, 2013: 1-30. |
| [2] | 冯雷, 李旭东. 高温热浪对人类健康影响的研究进展[J]. 环境与健康杂志, 2016, 33(2):182-188. |
| [ Feng Lei, Li Xudong. Effects of heat waves on human health: A review of recent study[J]. Journal of Environment and Health, 2016, 33(12):182-188. ] | |
| [3] | 张晓东, 赵银鑫, 武丹, 等. 基于遥感的银川市建成区城市扩展及其热环境变化分析[J]. 干旱区地理, 2020, 43(5):1278-1288. |
| [ Zhang Xiaodong, Zhao Yinxin, Wu Dan, et al. Urban built-up area expansion and thermal environment variation in Yinchuan City based on remote sensing[J]. Arid Land Geography, 2020, 43(5):1278-1288. ] | |
| [4] |
Yang J, Ou C Q, Ding Y, et al. Daily temperature and mortality: A study of distributed lag non-linear effect and effect modification in Guangzhou[J]. Environmental Health, 2012, 11(1):63, doi: 10.1186/1476-069X-11-63.
doi: 10.1186/1476-069X-11-63 |
| [5] |
López-Bueno J A, Navas-Martín M A, Linares C, et al. Analysis of the impact of heat waves on daily mortality in urban and rural areas in Madrid[J]. Environmental Research, 2021, 195(1):110892, doi: 110810.111016/j.envres.112021.110892.
doi: 110810.111016/j.envres.112021.110892 |
| [6] |
Lansu E M, Heerwaarden C C, Stegehuis A I, et al. Atmospheric aridity and apparent soil moisture drought in european forest during heat waves[J]. Geophysical Research Letters, 2020, 47(6): e2020GL087091, doi: 87010.81029/82020GL087091.
doi: 87010.81029/82020GL087091 |
| [7] |
Huo A, Peng J, Cheng Y, et al. Hydrological analysis of Loess Plateau highland control schemes in Dongzhi Plateau[J]. Frontiers in Earth Science, 2020, 8:528632, doi: 528610.523389/feart.522020.528632.
doi: 528610.523389/feart.522020.528632 |
| [8] |
Lee Y Y, Grotjahn R. California central valley summer heat waves form two ways[J]. Journal of Climate, 2016, 29(3): 151208152351006, doi: 10.1175/JCLI-D-15-0270.1.
doi: 10.1175/JCLI-D-15-0270.1 |
| [9] |
Hochman A, Scher S, Quinting J, et al. A new view of heat wave dynamics and predictability over the eastern Mediterranean[J]. Earth System Dynamics, 2021, 12(1):133-149.
doi: 10.5194/esd-12-133-2021 |
| [10] |
Kunkel K E, Lian X Z, Zhu J H. Regional climate model projections and uncertainties of U.S. summer heat waves[J]. Journal of Climate, 2010, 23(16):4447-4458.
doi: 10.1175/2010JCLI3349.1 |
| [11] |
Yin C, Yang F, Wang J L, et al. Spatiotemporal distribution and risk assessment of heat waves based on apparent temperature in the One Belt and One Road Region[J]. Remote Sensing, 2020, 12(7):1174, doi: 10.3390/rs12071174.
doi: 10.3390/rs12071174 |
| [12] |
Semenza J C, Rubin C H, Falter K H, et al. Heat-related deaths during the july 1995 heat wave in Chicago[J]. The New England Journal of Medicine, 1996, 335(2):84-90.
doi: 10.1056/NEJM199607113350203 |
| [13] |
Mandal R, Joseph S, Sahai A K, et al. Real time extended range prediction of heat waves over India[J]. Scientific Reports, 2019, 9(1):9008, doi: 10.1038/s41598-019-45430-6.
doi: 10.1038/s41598-019-45430-6 pmid: 31227766 |
| [14] | Phung D, Chu C, Tran D N, et al. Spatial variation of heat-related morbidity: A hierarchical Bayesian analysis in multiple districts of the Mekong Delta Region[J]. Science of the Total Environment, 2018, 637:1559-1565. |
| [15] | Kuglitsch F G, Toreti A, Xoplaki E, et al. Heat wave changes in the eastern Mediterranean since 1960[J]. Geophysical Research Letters, 2010, 37(4):379-384. |
| [16] |
Inostroza L, Palme M, De la Barrera F. A heat vulnerability index: Spatial patterns of exposure, sensitivity and adaptive capacity for Santiago de Chile[J]. PloS one, 2016, 11(9):e0162464, doi: 0162410.0161371/journal.pone.0162464.
doi: 0162410.0161371/journal.pone.0162464 |
| [17] |
Gertrud, Hatvani-Kovacs, Martin. et al. Assessment of heatwave impacts[J]. Procedia Engineering, 2016, 169:316-323.
doi: 10.1016/j.proeng.2016.10.039 |
| [18] | 张晓艳, 刘梅先. 洞庭湖流域高温热浪风险变化特征[J]. 长江流域资源与环境, 2015, 24(10):1729-1735. |
| [ Zhang Xiaoyan, Liu Meixian. Trends and risks of extreme heat events in the Dongting Lake catchment[J]. Resources and Environment in the Yangtze Basin, 2015, 24(10):1729-1735. ] | |
| [19] | 焦文慧, 张勃, 马彬, 等. 近58 a中国北方地区极端气温时空变化及影响因素分析[J]. 干旱区地理, 2020, 43(5):1220-1230. |
| [ Jiao Wenhui, Zhang Bo, Ma Bin, et al. Temporal and spatial changes of extreme temperature and its influencing factors in northern China in recent 58 years[J]. Arid Land Geography, 2020, 43(5):1220-1230. ] | |
| [20] | 杨建玲, 冯建民, 闫军, 等. 宁夏高温气候特征及其大气环流异常分析[J]. 中国沙漠, 2012, 32(5):1417-1425. |
| [ Yang Jianling, Feng Jianmin, Yan Jun, et al. Analysis of high temperature climatic characteristics in Ningxia and atmospheric circulation anomaly[J]. Journal of Desert Research, 2012, 32(5):1417-1425. ] | |
| [21] |
孙艺杰, 刘宪锋, 任志远, 等. 1960—2016年黄土高原干旱和热浪时空变化特征[J]. 地理科学进展, 2020, 39(4):591-601.
doi: 10.18306/dlkxjz.2020.04.006 |
|
[ Sun Yijie, Liu Xianfeng, Ren Zhiyuan, et al. Spatiotemporal changes of droughts and heatwaves on the Loess Plateau during 1960—2016[J]. Progress in Geography, 2020, 39(4):591-601. ]
doi: 10.18306/dlkxjz.2020.04.006 |
|
| [22] | 刘学智, 李王成, 苏振娟, 等. 1962—2015年宁夏平均气温和极端气温的变化特征[J]. 干旱区研究, 2018, 35(5):1173-1180. |
| [ Liu Xuezhi, Li Wangcheng, Su Zhenjuan, et al. Change of mean temperature and extreme temperature in Ningxia during the period of 1962—2015[J]. Arid Zone Research, 2018, 35(5):1173-1180. ] | |
| [23] | 杨宝玲, 杨婧, 陈彦虎, 等. 西北地区夏季极端高温异常特征及其成因[J]. 农业科学研究, 2014, 35(1):20-28. |
| [ Yang Baoling, Yang Jing, Chen Yanhu, et al. The characteristics and causes of extremely high temperature events in summer in northwest China[J]. Journal of Agricultural Sciences, 2014, 35(1):20-28. ] | |
| [24] | 李志军. 宁夏气候变化及其对植被覆盖的影响[D]. 兰州: 兰州大学, 2010. |
| [ Li Zhijun. Ningxia climate change and its effects on vegetation cover[D]. Lanzhou: Lanzhou University, 2010. ] | |
| [25] |
Huo A D, Yang L, Luo P P, et al. Influence of landfill and land use scenario on runoff, evapotranspiration, and sediment yield over the Chinese Loess Plateau[J]. Ecological Indicators, 2021, 121:107208,doi: 107210.101016/j.ecolind.102020.107208.
doi: 107210.101016/j.ecolind.102020.107208 |
| [26] | 孙灏, 马立茹, 蔡创创, 等. 干旱区地表温度和热岛效应演变研究——以宁夏沿黄城市带为例[J]. 干旱区地理, 2020, 43(3):694-705. |
| [ Sun Hao, Ma Liru, Cai Chuangchuang, et al. Evolution of surface temperature and heat island effect in arid areas: A case of city belt along the Yellow River in Ningxia[J]. Arid Land Geography, 2020, 43(3):694-705. ] | |
| [27] | 张明军, 汪宝龙, 魏军林, 等. 近50年宁夏极端气温事件的变化研究[J]. 自然灾害学报, 2012, 21(4):152-160. |
| [ Zhang Mingjun, Wang Baolong, Wei Junlin, et al. Extreme event changes of air temperature in Ningxia in recent 50 years[J]. Journal of Natural Disasters, 2012, 21(4):152-160. ] | |
| [28] | 付含聪, 邓帆, 杨欢, 等. 基于遥感的长江中下游城市群高温热浪风险评估[J]. 长江流域资源与环境, 2020, 29(5):1174-1182. |
| [ Fu Hancong, Deng Fan, Yang Huan, et al. Assessing heat wave risk of urban agglomeration in the middle-lower Yangtze River based on remote sensing[J]. Resources and Environment in the Yangtze Basin, 2020, 29(5):1174-1182. ] | |
| [29] |
边增淦, 王文, 江渊. 黑河流域中游地区作物种植结构的遥感提取[J]. 地球信息科学学报, 2019, 21(10):1629-1641.
doi: 10.12082/dqxxkx.2019.190183 |
|
[ Bian Zenggan, Wang Wen, Jiang Yuan. Remote sensing of cropping structure in the middle reaches of the Heihe River Basin[J]. Journal of Geo-information Science, 2019, 21(10):1629-1641. ]
doi: 10.12082/dqxxkx.2019.190183 |
|
| [30] |
金星星, 祁新华, 陆玉麒, 等. 福建省高温热浪风险评估与空间分异研究[J]. 地球信息科学学报, 2018, 20(12):1820-1829.
doi: 10.12082/dqxxkx.2018.180295. |
|
[ Jin Xingxing, Qi Xinhua, Lu Yuqi, et al. Evaluation and spatial differentiation of heat waves risk of Fujian Province[J]. Journal of Geo-information Science, 2018, 20(12):1820-1829. ]
doi: 10.12082/dqxxkx.2018.180295. |
|
| [31] |
武夕琳, 刘庆生, 刘高焕, 等. 高温热浪风险评估研究综述[J]. 地球信息科学学报, 2019, 21(7):1029-1039.
doi: 10.12082/dqxxkx.2019.180544 |
|
[ Wu Xilin, Liu Qingsheng, Liu Gaohuan, et al. Risk assessment of heat waves: A review[J]. Journal of Geo-information Science, 2019, 21(7):1029-1039. ]
doi: 10.12082/dqxxkx.2019.180544 |
|
| [32] | 刘勇洪, 权维俊. 北京城市高温遥感指标初探与时空格局分析[J]. 气候与环境研究, 2014, 19(3):332-342. |
| [ Liu Yonghong, Quan Weijun. Research on high temperature indices of Beijing City and its spatiotemporal pattern based on satellite data[J]. Climatic and Environmental Research, 2014, 19(3):332-342. ] | |
| [33] |
Lu D S, Tian H Q, Zhou G M, et al. Regional mapping of human settlements in southeastern China with multisensor remotely sensed data[J]. Remote Sensing of Environment, 2008, 112(9):3668-3679.
doi: 10.1016/j.rse.2008.05.009 |
| [34] |
陈倩, 丁明军, 杨续超, 等. 长江三角洲地区高温热浪人群健康风险评价[J]. 地球信息科学学报, 2017, 19(11):1475-1484.
doi: 10.3724/SP.J.1047.2017.01475 |
|
[ Chen Qian, Ding Mingjun, Yang Xuchao, et al. Spatially explicit assessment of heat health risks using multi-source data: A case study of the Yangtze River Delta Region, China[J]. Journal of Geo-information Science, 2017, 19(11):1475-1484. ]
doi: 10.3724/SP.J.1047.2017.01475 |
|
| [35] | 王彦芳, 边继云, 李国庆. 未来情景下高温对雄安新区产业劳动生产率的影响及应对策略[J]. 中国人口·资源与环境, 2020, 30(6):73-83. |
| [ Wang Yanfang, Bian Jiyun, Li Guoqing. The impact of hot weather on regional labor productivity over Xiong’an New District under future climate scenario[J]. China Population, Resources and Environment, 2020, 30(6):73-83. ] | |
| [36] | 王梅梅, 朱志玲, 吴咏梅. 宁夏中部干旱带土地沙漠化评价[J]. 中国沙漠, 2013, 33(2):320-324. |
| [ Wang Meimei, Zhu Zhiling, Wu Yongmei. Assessment on the sensitivity to aeolian desertification and lmportance of controlling aeolian desertification in the middle arid region of Ningxia[J]. Journal of Desert Research, 2013, 33(2):320-324. ] | |
| [37] | 陈林, 杨新国, 宋乃平, 等. 宁夏中部干旱带主要植物叶性状变异特征研究[J]. 草业学报, 2014, 23(1):41-49. |
| [ Chen Lin, Yang Xin’guo, Song Naiping, et al. A study on variations in leaf trait of 35 plants in the arid region of middle Ningxia, China[J]. Acta Prataculturae Sinica, 2014, 23(1):41-49. ] | |
| [38] |
Wang J, Yan Z. Rapid rises in the magnitude and risk of extreme regional heat wave events in China[J]. Weather and Climate Extremes, 2021, 34(4):100379, doi: 100310.101016/j.wace.102021.100379.
doi: 100310.101016/j.wace.102021.100379 |
| [39] | 张嘉仪, 钱诚. 1960—2018年中国高温热浪的线性趋势分析方法与变化趋势[J]. 气候与环境研究, 2020, 25(3):225-239. |
| [ Zhang Jiayi, Qian Cheng. Linear trends in occurrence of high temperature and heat waves in China for the 1960—2018 period: Method and analysis results[J]. Climatic and Environmental Research, 2020, 25(3):225-239. ] | |
| [40] | 冯克鹏, 田军仓, 沈晖. 基于K-means聚类分区的西北地区近半个世纪气温变化特征分析[J]. 干旱区地理, 2019, 42(6):1239-1252. |
| [ Feng Kepeng, Tian Juncang, Shen Hui. Temperature variation characteristics of northwest China based on K-means clustering partition in the past half century[J]. Arid Land Geography, 2019, 42(6):1239-1252. ] | |
| [41] | 刘学智, 李王成, 苏振娟, 等. 1962—2015年宁夏平均气温和极端气温的变化特征[J]. 干旱区研究, 2018, 35(5):1173-1180. |
| [ Liu Xuezhi, Li Wangcheng, Su Zhenjuan, et al. Change of mean temperature and extreme temperature in Ningxia during the period of 1962—2015[J]. Arid Zone Research, 2018, 35(5):1173-1180. ] | |
| [42] | 杨春白雪, 李建华, 李佳康, 等. 宁夏生态移民新村人居环境适宜性评价[J]. 农业科学研究, 2020, 41(2):23-29. |
| [ Yang Chunbaixue, Li Jianhua, Li Jiakang, et al. The nature suitability evaluation of human settlement environment in Ningxia ecomigration villages[J]. Journal of Agricultural Sciences, 2020, 41(2):23-29. ] | |
| [43] | 吴洪斌, 刘荣国, 王原, 等. 宁夏沙坡头自然保护区气候变化脆弱性评价[J]. 中国人口·资源与环境, 2016, 26(增刊2):30-34. |
| [ Wu Hongbin, Liu Rongguo, Wang Yuan, et al. Climate change vulnerability assessment of Shapotou Nature Reserve in Ningxia[J]. China Population, Resources and Environment, 2016, 26(Suppl. 2):30-34. ] |
| [1] | XIE Junbo, WANG Xingpeng, HE Shuai, LIU Yang, ZHONG Zhibo, LI Yan, HONG Guojun. Soil salinity inversion in the Shajingzi irrigation district based on spectral index modeling [J]. Arid Land Geography, 2024, 47(7): 1199-1209. |
| [2] | MA Mingde, LI Junjie, XUE Chenhao. Spatiotemporal evolution and driving mechanism of environmental stress of regional development in Ningxia Hui Autonomous Region [J]. Arid Land Geography, 2024, 47(6): 1061-1072. |
| [3] | LYU Na, GUO Mengjing, ZHAO Xin, LIU Kele, HUANG Yujia. Remote sensing inversion of water quality and spatiotemporal evolution characteristics of the Bosten Inland Freshwater Lake [J]. Arid Land Geography, 2024, 47(6): 953-966. |
| [4] | WANG Dai, CUI Yang, WANG Suyan, ZHANG Wen. Interdecadal changes and risk assessment of drought events in Ningxia from 1961 to 2020 [J]. Arid Land Geography, 2024, 47(5): 785-797. |
| [5] | YUAN Qingwen, LIU Yanfang, ZHAO Jinmei, AN Rui, LIU Yaolin. Spatial and temporal distribution characteristics and driving factors of land intensive utilization in development zones of Ningxia [J]. Arid Land Geography, 2024, 47(5): 861-871. |
| [6] | CAO Jialin, LIU Yanfang, ZHAO Jinmei, AN Rui, HU Yichuan, SUN Wenjie, XIN Gege. Coupling and coordination of economical and intensive utilization of urban construction land and high-quality development in Ningxia [J]. Arid Land Geography, 2024, 47(5): 872-884. |
| [7] | HUANG Manjie, LI Yanzhong, WANG Yuangang, YU Zhiguo, ZHUANG Jiacheng, XING Yincong. Evaluation of meteorological drought performance of multisource remote-sensing precipitation products in arid northwest China [J]. Arid Land Geography, 2024, 47(4): 549-560. |
| [8] | LIU Ruiliang, JIA Keli, LI Xiaoyu, CHEN Ruihua, WANG Yijing, ZHANG Junhua. Inversion of soil salt content by combining optical and microwave remote sensing in cultivated land [J]. Arid Land Geography, 2024, 47(3): 433-444. |
| [9] | WANG Jian, GUAN Yao, HE Xinghong, DAI Yunhao, CHEN Yiwei, WANG Yuqiang, LI Huiwen, FAN Debao. Dynamic monitoring and evaluation of ecological environment quality in Tumshuk City from 2000 to 2021 [J]. Arid Land Geography, 2024, 47(3): 465-473. |
| [10] | CHEN Man, CHEN Yaning, FANG Gonghuan, LI Yupeng, SUN Huilan. Changes in glacial lakes on the northern slope of Kunlun Mountains and assessment of their outburst risks [J]. Arid Land Geography, 2024, 47(10): 1628-1639. |
| [11] | SHI Weiliang, CHE Luyang, LI Tao. Probability distribution and comprehensive risk assessment of extreme precipitation in flood season in Shaanxi Province [J]. Arid Land Geography, 2023, 46(9): 1407-1417. |
| [12] | TANG Taibin, ZHOU Bao, JIN Xiaomei, WEI Sailajia, MA Tao, ZHANG Yongyan. Change of surface temperature in the source area of the Yellow River in summer [J]. Arid Land Geography, 2023, 46(8): 1250-1259. |
| [13] | CHENG Shuo, LI Yanzhong, XING Yincong, YU Zhiguo, WANG Yuangang, HUANG Manjie. Simulation performance of remote sensing precipitation products on hydrological drought characteristics in the source region of the Yellow River [J]. Arid Land Geography, 2023, 46(7): 1063-1072. |
| [14] | YANG Xuewen, WANG Ninglian, LIANG Qian, CHEN An’an. Glacier changes on the north slope of Tianshan Mountains in recent 60 years [J]. Arid Land Geography, 2023, 46(7): 1073-1083. |
| [15] | LI Shiyao, CONG Shixiang, WANG Rongrong, YU Hailong, HUANG Juying. Monitoring of maize canopy SPAD value under drought stress based on UAV multi-spectral remote sensing [J]. Arid Land Geography, 2023, 46(7): 1121-1132. |
| Viewed | ||||||||||||||||||||||||||||||||||||||||||||||||||
|
Full text 422
|
|
|||||||||||||||||||||||||||||||||||||||||||||||||
|
Abstract 473
|
|
|||||||||||||||||||||||||||||||||||||||||||||||||
Cited |
|
|||||||||||||||||||||||||||||||||||||||||||||||||
| Shared | ||||||||||||||||||||||||||||||||||||||||||||||||||
|
||