干旱区地理 ›› 2024, Vol. 47 ›› Issue (4): 707-719.doi: 10.12118/j.issn.1000-6060.2023.088 cstr: 32274.14.ALG2023088
慕石雷1( ), 杨玉欢2, 乌日陶克套胡1()
收稿日期:2023-02-28
修回日期:2023-04-23
出版日期:2024-04-25
发布日期:2024-05-17
通讯作者:
乌日陶克套胡(1963-),男,教授,博士生导师,主要从事民族地区经济与社会发展研究. E-mail: wurtkth@imnu.edu.cn作者简介:慕石雷(1983-),男,博士研究生,主要从事民族经济、资源环境经济研究. E-mail: mushilei123@163.com
基金资助:
MU Shilei1(), YANG Yuhuan2, Wuritaoketaohu 1()
Received:2023-02-28
Revised:2023-04-23
Published:2024-04-25
Online:2024-05-17
摘要:
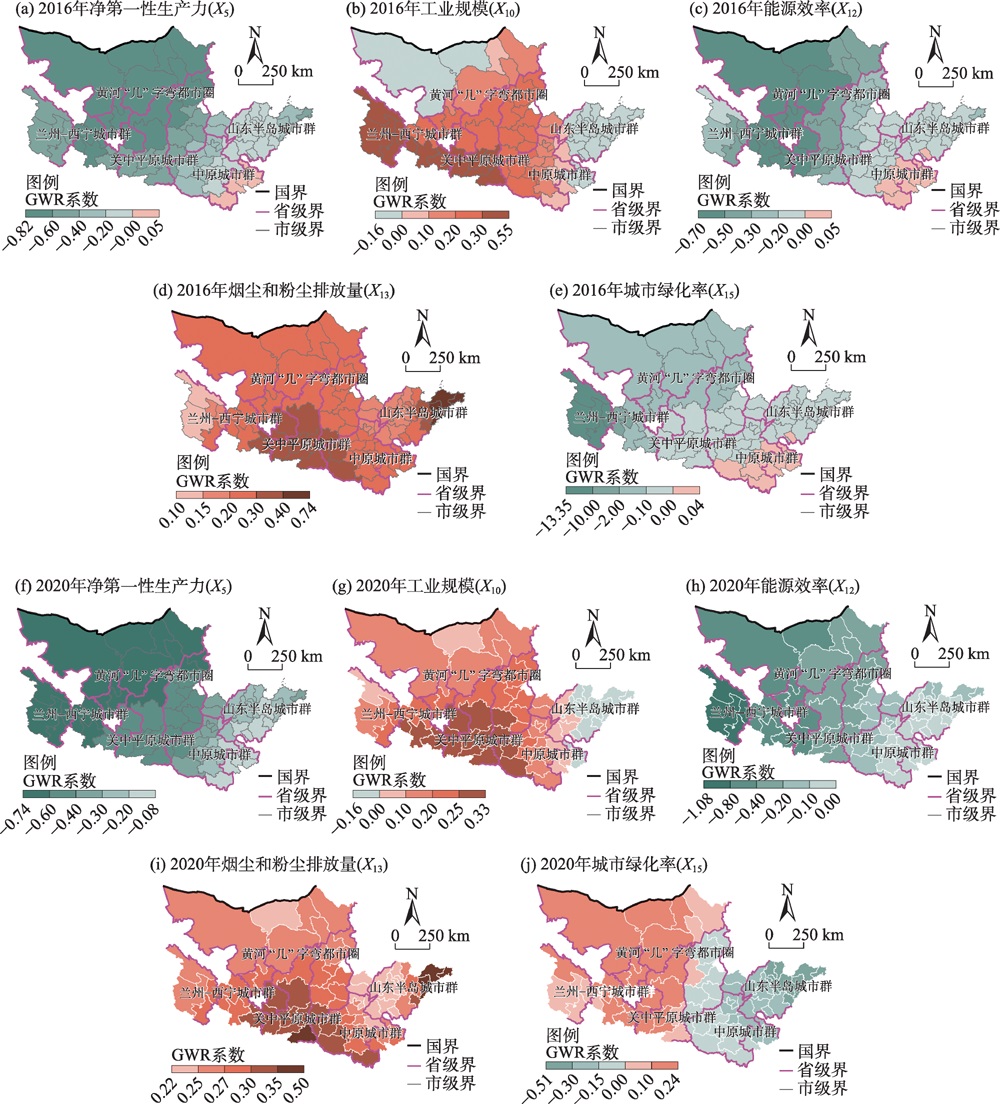
以黄河流域5大城市群82个城市为研究区域,选取2016—2020年中国环境监测总站发布的环境空气颗粒物(PM2.5)数据,采用空间自相关、地理探测器和地理加权回归等方法,研究PM2.5的时空分布特征和空间异质性的主要驱动影响因素。结果表明:(1) PM2.5年均值的变化大体呈倒“N”型,季均值变化呈先降后升的周期规律性的“U”型。(2) 在空间分布上,形成了黄河下游>中游>上游的梯度递减空间差异格局,并有逐渐下降的趋势。(3) PM2.5演变整体上呈正自相关集聚分布,集聚类型主要为高-高集聚、低-低集聚和低-高集聚类型。(4) 2016年和2020年PM2.5空间分异的自然地理因素比社会经济因素的驱动力更强,交互作用结果为双因子增强或非线性增强2种类型。(5) 通过地理加权回归模型对分异探测解释力变化最大的5个因子进行拟合,5 a间各因子对5大城市群PM2.5污染的负效应不断提高,正效应呈下降趋势,空间作用方向及强度上差异显著。研究结果为黄河流域5大城市群大气污染防治和环境规制完善提供参考依据,助推黄河流域生态保护和高质量发展。
慕石雷, 杨玉欢, 乌日陶克套胡. 黄河流域五大城市群PM2.5时空演变与影响因素探讨[J]. 干旱区地理, 2024, 47(4): 707-719.
MU Shilei, YANG Yuhuan, Wuritaoketaohu . Spatiotemporal evolution and influencing factors of PM2.5 in the five urban agglomerations in the Yellow River Basin[J]. Arid Land Geography, 2024, 47(4): 707-719.
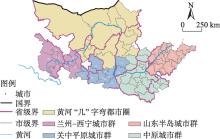
图1
黄河流域5大城市群示意图注:该图基于国家测绘地理信息局标准地图服务网站下载的审图号为GS(2019)1822号的标准地图制作,底图边界无修改。下同。"

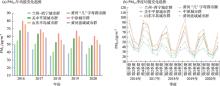
图2
2016—2020年黄河流域5大城市群PM2.5年均值和季均值变化"
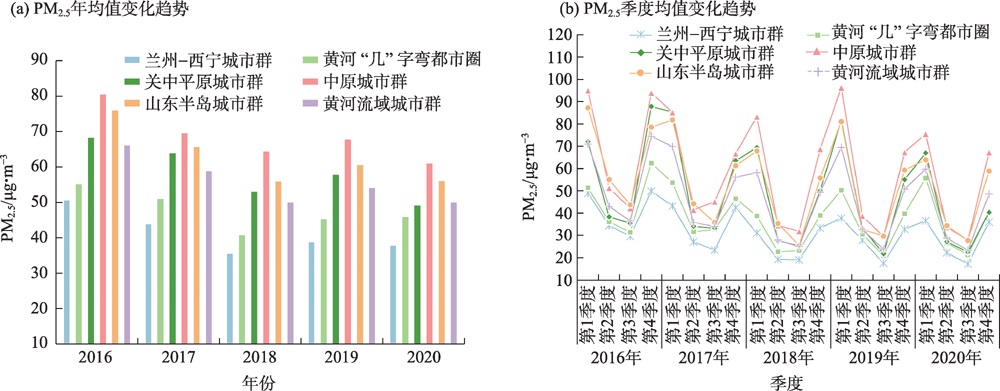
图3
2016—2020年黄河流域5大城市群PM2.5浓度变化率"
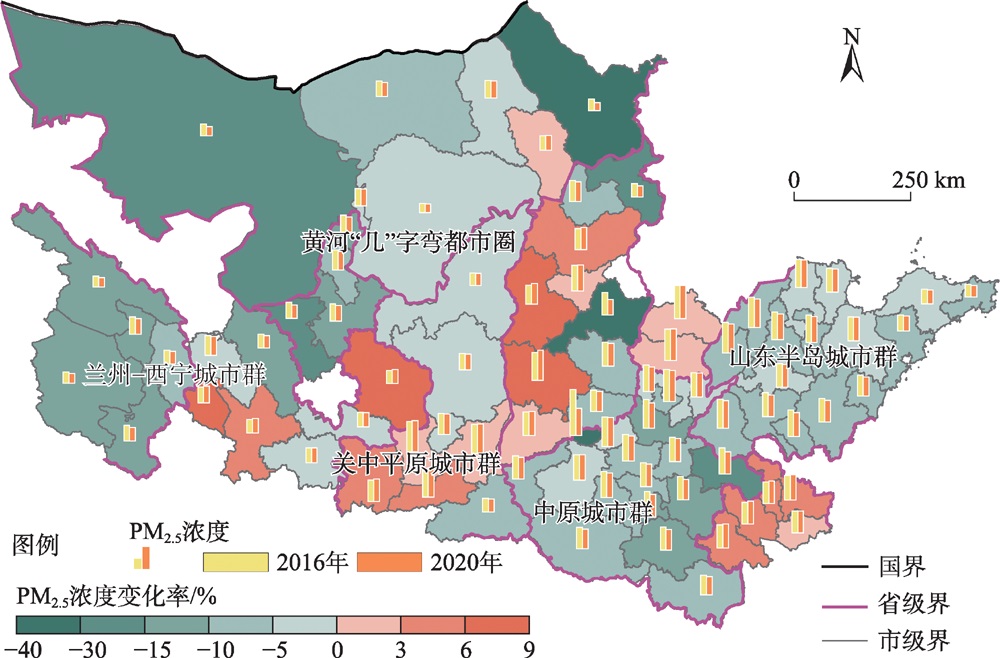
表1
黄河流域5大城市群PM2.5全局莫兰指数"
| 年份 | 兰州-西宁城市群 | 黄河“几”字弯都市圈 | 关中平原城市群 | 中原城市群 | 山东半岛城市群 | 黄河流域城市群 |
|---|---|---|---|---|---|---|
| 2016年 | -0.416*** | 0.078*** | 0.263*** | 0.144*** | 0.529*** | 0.481*** |
| 2020年 | -0.034*** | 0.040*** | 0.187*** | 0.316*** | 0.537*** | 0.435*** |
图4
2016、2020年黄河流域5大城市群PM2.5局部空间自相关对比分析"
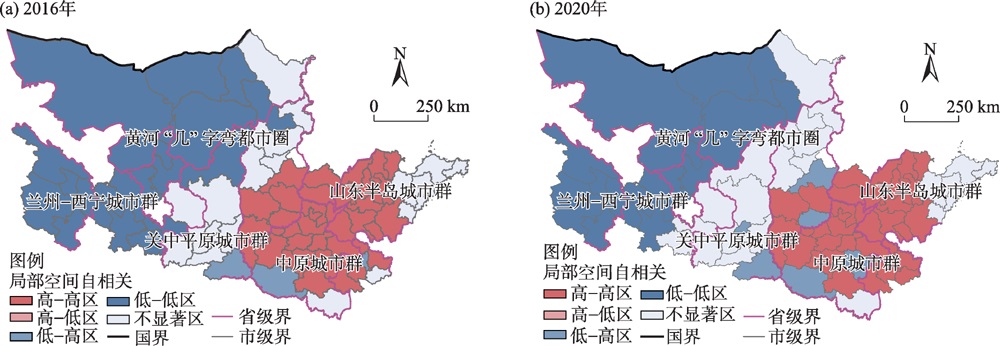
表2
黄河流域5大城市群PM2.5空间分布影响因素、因子解释力与分异探测结果"
| 影响因素 | 因子 | 评价指标 | 单位 | q | 差距 | |
|---|---|---|---|---|---|---|
| 2016年 | 2020年 | |||||
| 自然地理 | 地形起伏度(X1) | WAVI | m | 0.466*** | 0.443*** | -0.023 |
| 气温(X2) | 年平均气温 | ℃ | 0.417*** | 0.462*** | 0.045 | |
| 降水量(X3) | 年平均降水量 | mm | 0.085*** | 0.068*** | -0.017 | |
| 植被覆盖指数(X4) | NDVI | - | 0.256*** | 0.301*** | 0.045 | |
| 净第一性生产力(X5) | NPP | g·m-2·a-1 | 0.500*** | 0.546*** | 0.046 | |
| 社会经济 | 经济增长(X6) | 人均GDP | 元 | 0.154*** | 0.136*** | -0.018 |
| 城市化(X7) | 城市人口/总人口 | % | 0.056*** | 0.086*** | 0.030 | |
| 工业化(X8) | 第二产业占地区生产总值的比重 | % | 0.100*** | 0.101*** | 0.001 | |
| 人口规模(X9) | 常住人口数量 | 104人 | 0.249*** | 0.209*** | -0.040 | |
| 工业规模(X10) | 规模以上工业总产值 | 104元 | 0.203*** | 0.103*** | -0.100 | |
| 科技创新(X11) | 专利授权数 | 件 | 0.151*** | 0.159*** | 0.008 | |
| 能源效率(X12) | 单位GDP工业用电量倒数=GDP/工业用电量 | % | 0.036*** | 0.221*** | 0.185 | |
| 烟尘和粉尘排放量(X13) | 工业SO2、工业氮氧化物、工业颗粒物排放量 | 103 kg | 0.023*** | 0.098*** | 0.075 | |
| 公众环境关注度(X14) | 百度雾霾搜索指数 | - | 0.154*** | 0.198*** | 0.044 | |
| 城市绿化率(X15) | 建成区绿化覆盖率 | % | 0.014*** | 0.185*** | 0.171 | |
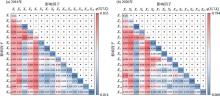
图5
黄河流域5大城市群PM2.5空间分布影响因子间交互作用探测结果注:X1~X15含义见表2;*表示非线性增强,q(Xi∩Xj)>Xi+Xj;+表示双因子交互增强,q(Xi∩Xj)>Max(Xi, Xj)。"
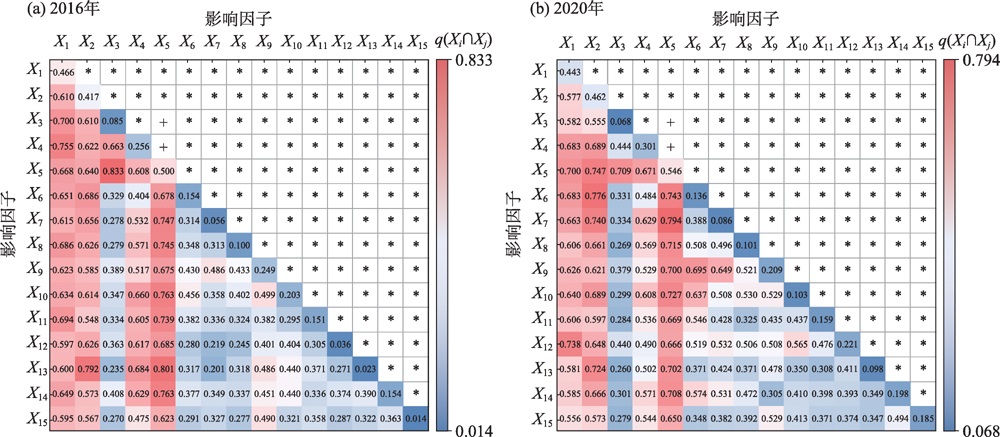

图6
2016、2020年黄河流域5大城市群PM2.5影响因子回归系数分布 注:GWR为地理加权回归。"
| [1] | 王利伟. 共绘黄河流域高质量发展画卷[N]. 光明日报, 2021-10-16( 5). |
| [Wang Liwei. Co drawing a high-quality development picture of the Yellow River Basin[N]. Guangming Daily, 2021-10-16(5). ] | |
| [2] | 黄承梁. 推动黄河流域生态保护和高质量发展[J]. 红旗文稿, 2022(8): 15-17. |
| [Huang Chengliang. Promoting ecological protection and high quality development of the Yellow River Basin[J]. Red Flag Manuscript, 2022(8): 15-17. ] | |
| [3] | 中华人民共和国生态环境部. 生态环境部通报2021年12月和1—12月全国地表水、环境空气质量状况[EB/OL].[2022-08-19]. https://www.mee.gov.cn/ywdt/xwfb/202201/t20220131_968703.shtml. |
| [ Ministry of Ecology and Environment of the People’s Republic of China. Ministry of Ecology and Environment reported the state of surface water and ambient air quality in December and from January to December 2021[EB/OL].[2022-08-19]. https://www.mee.gov.cn/ywdt/xwfb/202201/t20220131_968703.shtml. ] | |
| [4] |
王振波, 梁龙武, 王旭静. 中国城市群地区PM2.5时空演变格局及其影响因素[J]. 地理学报, 2019, 74(12): 2614-2630.
doi: 10.11821/dlxb201912014 |
|
[Wang Zhenbo, Liang Longwu, Wang Xujing. Spatio-temporal evolution patterns and influencing factors of PM2.5 in Chinese urban agglomerations[J]. Acta Geographica Sinica, 2019, 74(12): 2614-2630. ]
doi: 10.11821/dlxb201912014 |
|
| [5] | 杨新兴, 冯丽华, 尉鹏. 大气颗粒物PM2.5及其危害[J]. 前沿科学, 2012, 6(1): 22-31. |
| [Yang Xinxing, Feng Lihua, Wei Peng. Air particulate matter PM2.5 and its harm[J]. Frontier Science, 2012, 6(1): 22-31. ] | |
| [6] | 杨洪斌, 邹旭东, 汪宏宇, 等. 大气环境中PM2.5的研究进展与展望[J]. 气象与环境学报, 2012, 28(3): 77-82. |
| [Yang Hongbin, Zou Xudong, Wang Hongyu, et al. Study progress on PM2.5 in atmospheric environment[J]. Journal of Meteorology and Environment, 2012, 28(3): 77-82. ] | |
| [7] | 郝吉明, 尹伟伦, 岑可法. 中国大气PM2.5污染防治策略与技术途径[M]. 北京: 科学出版社, 2016. |
| [Hao Jiming, Yin Weilun, Cen Kefa. Strategies and technical approaches for the prevention and control of atmospheric PM2.5 pollution in China[M]. Beijing: Science Press, 2016. ] | |
| [8] | 生态环境部. 关于发布国家环境质量标准《环境空气质量标准》的公告[EB/OL].[2022-08-20]. https://www.mee.gov.cn/gkml/hbb/bgg/201203/t20120302_224145.htm. |
| [ Ministry of Ecology and Environment. Announcement on the issuance of the national environmental quality standard ambient air quality standard[EB/OL].[2022-08-20]. https://www.mee.gov.cn/gkml/hbb/bgg/201203/t20120302_224145.htm. ] | |
| [9] | 祝玉敏. 新《环境空气质量标准》与PM2.5——访环境保护部科技标准司司长赵英民[J]. 世界环境, 2012(1): 14-15. |
| [Zhu Yumin. New “Air Quality Standard” & PM2.5[J]. World Environment, 2012(1): 14-15. ] | |
| [10] | Sun Y L, Zhuang G S, Tang A H, et al. Chemical characteristics of PM2.5 and PM10 in haze-fog episodes in Beijing[J]. Environmental Science & Technology, 2006, 40(10): 3148-3155. |
| [11] |
熊欢欢, 梁龙武, 曾赠, 等. 中国城市PM2.5时空分布的动态比较分析[J]. 资源科学, 2017, 39(1): 136-146.
doi: 10.18402/resci.2017.01.14 |
| [Xiong Huanhuan, Liang Longwu, Zeng Zeng, et al. Dynamic analysis of PM2.5 spatial-temporal characteristics in China[J]. Resource Science, 2017, 39(1): 136-146. ] | |
| [12] | Pinto J P, Lefohn A S, Shadwick D S. Spatial variability of PM2.5 in urban areas in the United States[J]. Journal of the Air & Waste Management Association, 2004, 54(4): 440-449. |
| [13] | Khan M M, Zaman K, Irfan D, et al. Triangular relationship among energy consumption, air pollution and water resources in Pakistan[J]. Journal of Cleaner Production, 2015, 112: 1375-1385. |
| [14] | 汪克亮, 孟祥瑞, 杨宝臣, 等. 技术异质下中国大气污染排放效率的区域差异与影响因素[J]. 中国人口·资源与环境, 2017, 27(1): 101-110. |
| [Wang Keliang, Meng Xiangrui, Yang Baochen, et al. Regional differences and influencing factors of China’s air pollution emission efficiency considering technological heterogeneity[J]. China Population, Resources and Environment, 2017, 27(1): 101-110. ] | |
| [15] | Stern D I, Common M S, Barbier E B. Economic growth and environmental degradation: The environmental Kuznets curve and sustainable development[J]. World Development, 1996, 24(7): 1151-1160. |
| [16] | 马丽梅, 张晓. 中国雾霾污染的空间效应及经济、能源结构影响[J]. 中国工业经济, 2014(4): 19-31. |
| [Ma Limei, Zhang Xiao. The spatial effect of China’s haze pollution and the impact from economic change and energy structure[J]. China Industrial Economics, 2014(4): 19-31. ] | |
| [17] | Cardelino C A, Chameides W L. Natural hydrocarbons, urbanization, and urban ozone[J]. Journal of Geophysical Research Atmospheres, 1990, 95(D9): 13971-13979. |
| [18] | 彭迪云, 刘畅, 周依仿. 长江经济带城镇化发展对雾霾污染影响的门槛效应研究——基于居民消费水平的视角[J]. 金融与经济, 2015(8): 36-42. |
| [Peng Diyun, Liu Chang, Zhou Yifan. Threshold effect of urbanization development on haze pollution in the Yangtze River Economic Belt: From the perspective of residents’consumption level[J]. Finance and Economy, 2015(8): 36-42. ] | |
| [19] | Brimblecombe P. Air pollution in industrializing England[J]. Journal of the Air Pollution Control Association, 1978, 28(2): 115-118. |
| [20] | 何枫, 马栋栋. 雾霾与工业化发展的关联研究——中国74个城市的实证研究[J]. 软科学, 2015, 29(6): 110-114. |
| [He Feng, Ma Dongdong. Association study between haze pollution and industrialization: An empirical study based on 74 cities in China[J]. Soft Science, 2015, 29(6): 110-114. ] | |
| [21] | Walsh M P. PM2.5: Global progress in controlling the motor vehicle contribution[J]. Frontiers of Environmental Science & Engineering, 2014, 8(1): 1-17. |
| [22] | 魏巍贤, 马喜立. 能源结构调整与雾霾治理的最优政策选择[J]. 中国人口·资源与环境, 2015, 25(7): 6-14. |
| [Wei Weixian, Ma Xili. Optimal policy for energy structure adjustment and haze governance in China[J]. China Population, Resources and Environment, 2015, 25(7): 6-14. ] | |
| [23] | Guan D B, Su X, Zhang Q, et al. The socioeconomic drivers of China’s primary PM2.5 emissions[J]. Environmental Research Letters, 2014, 9(2): 024010, doi: 10.1088/1748-9326/9/2/024010. |
| [24] | 康雨. 贸易开放程度对雾霾的影响分析——基于中国省级面板数据的空间计量研究[J]. 经济科学, 2016(1): 114-125. |
| [Kang Yu. The impact of trade openness on haze: A spatial econometric study based on China’s provincial panel data[J]. Economic Science, 2016(1): 114-125. ] | |
| [25] | 冷艳丽, 冼国明, 杜思正. 外商直接投资与雾霾污染——基于中国省际面板数据的实证分析[J]. 国际贸易问题, 2015(12): 74-84. |
| [Leng Yanli, Xian Guoming, Du Sizheng. Foreign direct investment and haze pollution: An empirical analysis based on provincial panel data[J]. Journal of International Trade, 2015(12): 74-84. ] | |
| [26] | Small K A, Kazimi C. On the costs of air pollution from motor vehicles[J]. University of California Transportation Center, Working Papers, 1995(6): 7-32. |
| [27] | 周峤. 雾霾天气的成因[J]. 中国人口·资源与环境, 2015, 25(增刊1): 211-212. |
| [Zhou Qiao. Cause of the haze weather[J]. China Population, Resources and Environment, 2015, 25(Suppl. 1): 211-212. ] | |
| [28] | 张军, 金梓函, 王玥, 等. 关中平原城市群PM2.5时空演变格局及其影响因素[J]. 环境科学, 2022, 43(12): 5333-5343. |
| [Zhang Jun, Jin Zihan, Wang Yue, et al. Temporal and spatial evolution pattern of PM2.5 and its influencing factors in Guanzhong Plain urban agglomeration[J]. Environmental Science, 2022, 43(12): 5333-5343. ] | |
| [29] | 刘笑杰, 王丽丽, 何博汶, 等. 长江经济带PM2.5时空演变及影响因素分析[J]. 长江流域资源与环境, 2022, 31(3): 647-658. |
| [Liu Xiaojie, Wang Lili, He Bowen, et al. Spatiotemporal evolution and drivers of PM2.5 in the Yangtze River Economic Belt[J]. Resources and Environment in the Yangtze Basin, 2022, 31(3): 647-658. ] | |
| [30] | 贺斌, 袁晓玲, 张跃胜. 中国城市PM2.5驱动因素的时空异质性研究[J]. 统计与决策, 2020, 36(22): 53-56. |
| [He Bin, Yuan Xiaoling, Zhang Yuesheng. Spatio temporal heterogeneity of driving factors of PM2.5 in Chinese cities[J]. Statistics & Decision, 2020, 36(22): 53-56. ] | |
| [31] |
耿佳辰, 沈石, 程昌秀. “十三五”时期黄河流域PM2.5时空分布规律及多尺度社会经济影响机制分析[J]. 地球信息科学学报, 2022, 24(6): 1163-1175.
doi: 10.12082/dqxxkx.2022.210534 |
| [Geng Jiachen, Shen Shi, Cheng Changxiu. Spatio-temporal evolution and the multi-scale socio-economic influencing mechanism of PM2.5 in the Yellow River Basin during the China’s 13th Five-Year Plan[J]. Journal of Geo-information Science, 2022, 24(6): 1163-1175. ] | |
| [32] |
尹承美, 何建军, 于丽娟, 等. 多尺度气象条件对济南PM2.5污染的影响[J]. 高原气象, 2019, 38(5): 1120-1128.
doi: 10.7522/j.issn.1000-0534.2019.00018 |
|
[Yin Chengmei, He Jianjun, Yu Lijuan, et al. The impact of multi-scale meteorological conditions on PM2.5 pollution over Ji’nan[J]. Plateau Meteorology, 2019, 38(5): 1120-1128. ]
doi: 10.7522/j.issn.1000-0534.2019.00018 |
|
| [33] | 孟昭阳, 张怀德, 蒋晓明, 等. 太原地区冬春季PM2.5污染特征及影响因素[J]. 中国科学院研究生院学报, 2007, 24(5): 648-656. |
|
[Meng Zhaoyang, Zhang Huaide, Jiang Xiaoming, et al. The characteristics of PM2.5 and its influencing factors during winter and spring in Taiyuan[J]. Journal of University of Chinese Academy of Sciences, 2007, 24(5): 648-656. ]
doi: 10.7523/j.issn.2095-6134.2007.5.016 |
|
| [34] | 王新, 聂燕, 陈红, 等. 兰州城区大气PM2.5污染特征及来源解析[J]. 环境科学, 2016, 37(5): 1619-1628. |
| [Wang Xin, Nie Yan, Chen Hong, et al. Pollution characteristics and source apportionment of PM2.5 in Lanzhou City[J]. Environmental Science, 2016, 37(5): 1619-1628. ] | |
| [35] | 王昭, 严小兵. 长江三角洲城市群PM2.5时空演变及影响因素[J]. 长江流域资源与环境, 2020, 29(7): 1497-1506. |
| [Wang Zhao, Yan Xiaobing. Temporal-spatial evolution of PM2.5 and driving factors in Yangtze River Delta urban agglomeration[J]. Resources and Environment in the Yangtze Basin, 2020, 29(7): 1497-1506. ] | |
| [36] | 周侗, 张帅倩, 闫金伟, 等. 长江经济带三大城市群PM2.5时空分布特征及影响因素研究[J]. 长江流域资源与环境, 2022, 31(4): 878-889. |
| [Zhou Dong, Zhang Shuaiqian, Yan Jinwei, et al. Spatiotemporal distribution characteristics of PM2.5and its influencing factors of the three urban agglomerations in the Yangtze River Economic Belt[J]. Resources and Environment in the Yangtze Basin, 2022, 31(4): 878-889. ] | |
| [37] | 贾卓, 强文丽, 王月菊, 等. 兰州-西宁城市群工业污染集聚格局及其空间效应[J]. 经济地理, 2020, 40(1): 68-75, 84. |
| [Jia Zhuo, Qiang Wenli, Wang Yueju, et al. The spatial characteristics and spatial effect of industrial pollution agglomeration in Lanzhou-Xining Urban Agglomeration[J]. Economic Geography, 2020, 40(1): 68-75, 84. ] | |
| [38] |
李衡, 韩燕. 黄河流域PM2.5时空演变特征及其影响因素分析[J]. 世界地理研究, 2022, 31(1): 130-141.
doi: 10.3969/j.issn.1004-9479.2022.01.2020212 |
|
[Li Heng, Han Yan. Analysis on the spatial-temporal evolution characteristics of PM2.5 and its influencing factors in the Yellow River Basin[J]. World Regional Studies, 2022, 31(1): 130-141. ]
doi: 10.3969/j.issn.1004-9479.2022.01.2020212 |
|
| [39] | 杨小林, 陈艺晏, 李义玲, 等. 黄河流域城市PM2.5时空异质及空间溢出效应研究[J]. 资源开发与市场, 2022, 38(10): 1208-1215, 1223. |
| [Yang Xiaolin, Chen Yiyan, Li Yiling, et al. Research on the spatial-temporal heterogeneity and spatial spillover effects of urban PM2.5 in the Yellow River Basin[J]. Resource Development & Market, 2022, 38(10): 1208-1215, 1223. ] | |
| [40] | 王晶晶, 程钰. 黄河流域技术创新对PM2.5的影响及其空间溢出效应[J]. 中国人口·资源与环境, 2022, 32(9): 108-118. |
| [Wang Jingjing, Cheng Yu. Impact of technological innovation on PM2.5 and its spatial spillover effect in the Yellow River Basin[J]. China Population, Resources and Environment, 2022, 32(9): 108-118. ] | |
| [41] | 内蒙古自治区统计局. 黄河“几”字弯都市圈比较分析[EB/OL].[2023-05-13]. http://tj.nmg.gov.cn/tjdt/fbyjd_ 11654/202204/t20220422_2043235.html. |
| [ Inner Mongolia Autonomous Region Statistics Bureau. Comparative analysis in the Yellow River Jiziwan Metropolitan Area[EB/OL].[2023-05-13]. http://tj.nmg.gov.cn/tjdt/fbyjd_ 11654/202204/t20220422_2043235.html. ] | |
| [42] | 崔木花. 中原城市群9市城镇化与生态环境耦合协调关系[J]. 经济地理, 2015, 35(7): 72-78. |
| [Cui Muhua. The relationship of coupling coordination between urbanization and ecological environment: A case of urban cluster in the Central Plains[J]. Economic Geography, 2015, 35(7): 72-78. ] | |
| [43] |
王富喜. 山东半岛城市群人口-土地城镇化质量测度与协调发展研究[J]. 地理科学, 2020, 40(8): 1345-1354.
doi: 10.13249/j.cnki.sgs.2020.08.014 |
|
[Wang Fuxi. Study on the quality measurement and coordinated development of population-land urbanization in Shandong Peninsula urban agglomeration[J]. Scientia Geographica Sinica, 2020, 40(8): 1345-1354. ]
doi: 10.13249/j.cnki.sgs.2020.08.014 |
|
| [44] | 江娟丽, 杨庆媛, 张忠训, 等. 重庆市非物质文化遗产的空间格局及旅游开发模式[J]. 经济地理, 2019, 39(6): 205-213. |
| [Jiang Juanli, Yang Qingyuan, Zhang Zhongxun, et al. Spatial distribution pattern of intangible cultural heritage and tourism development in Chongqing[J]. Economic Geography, 2019, 39(6): 205-213. ] | |
| [45] |
王劲峰, 徐成东. 地理探测器: 原理与展望[J]. 地理学报, 2017, 72(1): 116-134.
doi: 10.11821/dlxb201701010 |
|
[Wang Jinfeng, Xu Chengdong. Geodetector: Principle and prospective[J]. Acta Geographica Sinica, 2017, 72(1): 116-134. ]
doi: 10.11821/dlxb201701010 |
|
| [46] | 卢宾宾, 葛咏, 秦昆, 等. 地理加权回归分析技术综述[J]. 武汉大学学报(信息科学版), 2020, 45(9): 1356-1366. |
| [Lu Binbin, Ge Yong, Qin Kun, et al. A review on geographically weighted regression[J]. Geomatics and Information Science of Wuhan University, 2020, 45(9): 1356-1366. ] | |
| [47] | 张碧辉, 王若嘉. “雾霾灰”持续减少, 原因几何[N]. 中国气象报, 2020-04-30(3). |
| [Zhang Bihui, Wang Ruojia. “Haze ash” continues to decrease, and the reason is geometric[N]. China Meteorological News, 2020-04-30(3). ] | |
| [48] | 王丽丽, 刘笑杰, 李丁, 等. 黄河流域PM2.5时空特征及驱动因素[J]. 兰州大学学报(自然科学版), 2022, 58(4): 427-435, 442. |
| [Wang Lili, Liu Xiaojie, Li Ding, et al. Spatial-temporal characteristics and drivers of PM2.5 in the Yellow River Basin[J]. Journal of Lanzhou University (Natural Sciences Edition), 2022, 58(4): 427-435, 442. ] | |
| [49] | 刘威杰, 胡天鹏, 毛瑶, 等. 汾渭平原临汾市2019年春节期间大气污染特征与来源解析[J]. 环境科学, 2021, 42(11): 5122-5130. |
| [Liu Weijie, Hu Tianpeng, Mao Yao, et al. Characteristics and origin analysis of air pollution during the spring festival in Linfen, Fenwei Plain[J]. Environmental Science, 2021, 42(11): 5122-5130. ] | |
| [50] | 陈小平, 焦奕雯, 裴婷婷, 等. 园林植物吸附细颗粒物PM2.5效应研究进展[J]. 生态学杂志, 2014, 33(9): 2558-2566. |
| [Chen Xiaoping, Jiao Yiwen, Pei Tingting, et al. The effect of adsorbing fine particulate matter (PM2.5) by garden plants: A review[J]. Chinese Journal of Ecology, 2014, 33(9): 2558-2566. ] | |
| [51] |
滕堂伟, 谌丹华, 胡森林. 黄河流域空气污染的空间格局演化及影响因素[J]. 地理科学, 2021, 41(10): 1852-1861.
doi: 10.13249/j.cnki.sgs.2021.10.017 |
|
[Teng Tangwei, Chen Danhua, Hu Senlin. Spatial evolution and influencing factors of spatial agglomeration pattern of air pollution in the Yellow River Basin[J]. Scientia Geographica Sinica, 2021, 41(10): 1852-1861. ]
doi: 10.13249/j.cnki.sgs.2021.10.017 |
|
| [52] | 胡淑兰, 胡琳, 程路, 等. 陕西关中重污染天气低空流场的分型研究[J]. 干旱区地理, 2022, 45(1): 122-130. |
| [Hu Shulan, Hu Lin, Cheng Lu, et al. Low-level streamline field typing of heavy pollution weather of Guanzhong region in Shaanxi Province[J]. Arid Land Geography, 2022, 45(1): 122-130. ] | |
| [53] | 黄小刚, 邵天杰, 赵景波, 等. 汾渭平原PM2.5浓度的影响因素及空间溢出效应[J]. 中国环境科学, 2019, 39(8): 3539-3548. |
| [Huang Xiaogang, Shao Tianjie, Zhao Jingbo, et al. Influence factors and spillover effect of PM2.5 concentration on Fen-wei Plain[J]. China Environmental Science, 2019, 39(8): 3539-3548. ] | |
| [54] | 中国气象学会. 森林使北京年“增蓝”半月减PM2.5上百吨[EB/OL].[2023-08-05]. http://www.cms1924.org/WebPage/WebPageDetail_76_123_2324.aspx. |
| [ Chinese Meteorological Society. Forests reduce PM2.5 by hundreds of tons in half a month of Beijing’s annual “blue increase”[EB/OL].[2023-08-05]. http://www.cms1924.org/WebPage/WebPageDetail_76_123_2324.aspx. ] | |
| [55] |
刘海猛, 方创琳, 黄解军, 等. 京津冀城市群大气污染的时空特征与影响因素解析[J]. 地理学报, 2018, 73(1): 177-191.
doi: 10.11821/dlxb201801015 |
|
[Liu Haimeng, Fang Chuanglin, Huang Jiejun, et al. The spatial-temporal characteristics and influencing factors of air pollution in Beijing-Tianjin-Hebei urban agglomeration[J]. Acta Geographica Sinica, 2018, 73(1): 177-191. ]
doi: 10.11821/dlxb201801015 |
|
| [56] | 吴力波, 杨眉敏, 孙可哿. 公众环境关注度对企业和政府环境治理的影响[J]. 中国人口·资源与环境, 2022, 32(2): 1-14. |
| [Wu Libo, Yang Meimin, Sun Kege. Impact of public environmental attention on environmental governance of enterprises and local governments[J]. China Population, Resources and Environment, 2022, 32(2): 1-14. ] | |
| [57] | 季静, 王罡, 杜希龙, 等. 京津冀地区植物对灰霾空气中PM2.5等细颗粒物吸附能力分析[J]. 中国科学: 生命科学, 2013, 43(8): 694-699. |
| [Ji Jing, Wang Gang, Du Xilong, et al. Evaluation of adsorbing haze PM2.5 fine particulate matters with plants in Beijing-Tianjin-Hebei region in China[J]. Scientia Sinica (Vitae), 2013, 43(8): 694-699. ] | |
| [58] | 杨春雪, 阚海东, 陈仁杰. 我国大气细颗粒物水平、成分、来源及污染特征[J]. 环境与健康杂志, 2011, 28(8): 735-738, 753. |
| [Yang Chunxue, Kan Haidong, Chen Renjie. Research on level, composition, source and pollution characteristics of ambient fine particles in China[J]. Journal of Environment and Health, 2011, 28(8): 735-738, 753. ] |
| [1] | 柴明辰, 徐国杰, 甄钟秀, 银燕, 郑博华, 陈魁, 李斌, 李圆圆. 中天山PM2.5中重金属和多环芳烃污染特征、来源及健康风险评价[J]. 干旱区地理, 2025, 48(3): 391-404. |
| [2] | 闫劲烨, 马正权, 孙萱萱, 阿力木·阿巴斯, 帕丽达·牙合甫. 2015—2023年“乌-昌-石”城市群PM2.5与PM10时空变化及潜在源分析[J]. 干旱区地理, 2025, 48(3): 405-420. |
| [3] | 刘园园, 马彩虹, 马丽娅. 黄河流域典型绿洲城市扩张模拟及其生态韧性响应研究[J]. 干旱区地理, 2025, 48(3): 506-516. |
| [4] | 付晓, 黄颖敏. 主体功能视角下中国革命老区高质量发展空间格局及影响因素[J]. 干旱区地理, 2025, 48(3): 517-527. |
| [5] | 张傲翔, 苗成林, 陈峥妍. 黄河流域城市生态韧性、社会网络及其影响因素分析[J]. 干旱区地理, 2025, 48(1): 130-142. |
| [6] | 李刚. 高质量发展的新疆实践:评估体系构建及测度研究[J]. 干旱区地理, 2025, 48(1): 143-152. |
| [7] | 杨燕燕, 王永瑜, 徐绮阳. 黄河流域水资源利用驱动因素及脱钩效应研究[J]. 干旱区地理, 2025, 48(1): 20-30. |
| [8] | 张鑫, 张丹, 张广森, 宋玫. 关中平原城市群生态系统服务时空特征及生态功能区划分[J]. 干旱区地理, 2024, 47(9): 1587-1595. |
| [9] | 徐晓亮, 刘旭义, 关靖云, 杨晶晶, 王明辰, 暴龙飞. 中国西部边疆民族地区文旅融合高质量发展时空演化及驱动因素分析[J]. 干旱区地理, 2024, 47(9): 1596-1605. |
| [10] | 夏子龙, 杜培军, 郭山川, 方宏, 张伟, 潘小全. 呼包鄂榆城市群遥感土地覆被产品评估分析与集成学习[J]. 干旱区地理, 2024, 47(8): 1367-1379. |
| [11] | 陈聪, 唐英, 史承勇, 杜怡帆, 赵丽娜, 姜旭妍. 黄河流域遗产资源空间分布与区域协同保护[J]. 干旱区地理, 2024, 47(7): 1220-1232. |
| [12] | 王超, 雷婷, 孟晓莎, 樊建强. “交旅”融合下旅游经济与高速交通协调发展分析——以关中平原城市群为例[J]. 干旱区地理, 2024, 47(6): 1015-1025. |
| [13] | 侯晋星, 潘换换, 杜自强, 武志涛, 张红. 山西黄河流域水生态系统服务时空分析[J]. 干旱区地理, 2024, 47(6): 1047-1060. |
| [14] | 袁庆雯, 刘艳芳, 赵金梅, 安睿, 刘耀林. 宁夏开发区土地集约利用时空分布特征与驱动因素分析[J]. 干旱区地理, 2024, 47(5): 861-871. |
| [15] | 曹佳琳, 刘艳芳, 赵金梅, 安睿, 胡艺川, 孙文杰, 辛格格. 宁夏城市建设用地节约集约利用与高质量发展耦合协调研究[J]. 干旱区地理, 2024, 47(5): 872-884. |
|
||