Arid Land Geography ›› 2026, Vol. 49 ›› Issue (1): 1-12.doi: 10.12118/j.issn.1000-6060.2025.083
• Climatology and Hydrology • Previous Articles Next Articles
CHENG Xi’an1( ), NIU Quanfu1,2,3(), WANG Gang1, SHAO Donghu1, ZHU Dengfeng1, WANG Zhenyu1
Received:2025-02-21
Revised:2025-03-23
Online:2026-01-25
Published:2026-01-18
Contact:
NIU Quanfu
E-mail:17795734293@163.com;Niuqf@lut.edu.cn
CHENG Xi’an, NIU Quanfu, WANG Gang, SHAO Donghu, ZHU Dengfeng, WANG Zhenyu. Monitoring and influencing factors of vegetation drought resistance on the Loess Plateau[J].Arid Land Geography, 2026, 49(1): 1-12.
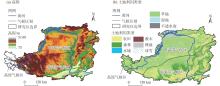
Fig. 1
Overview of the study area"
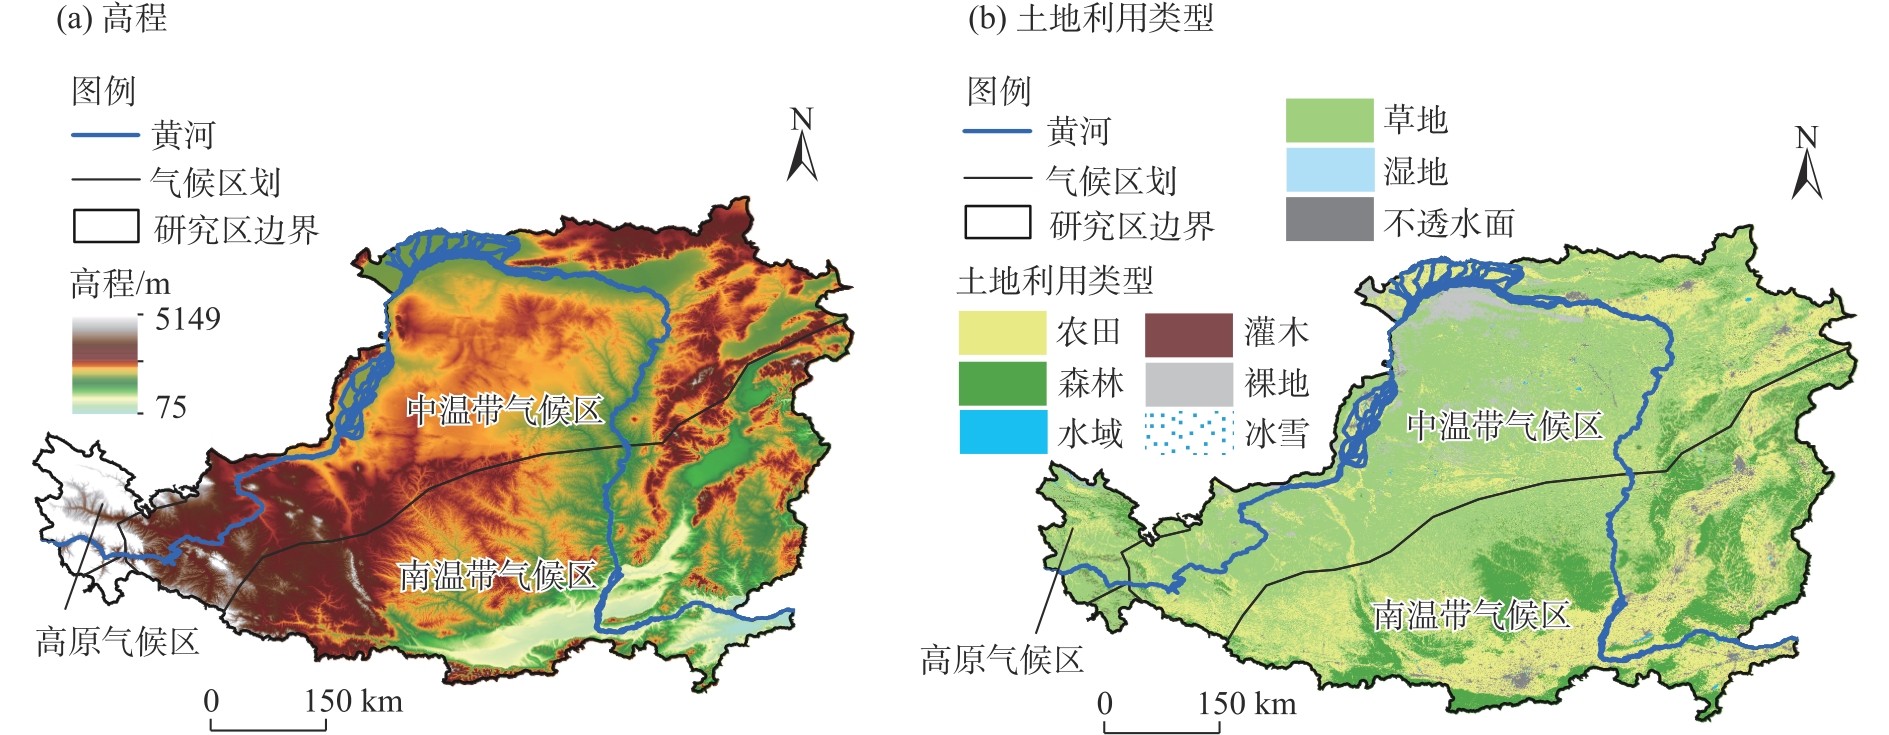
Fig. 2
Correlation analysis between remote sensing data and SPEI of existing sites"
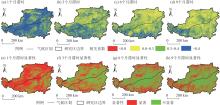
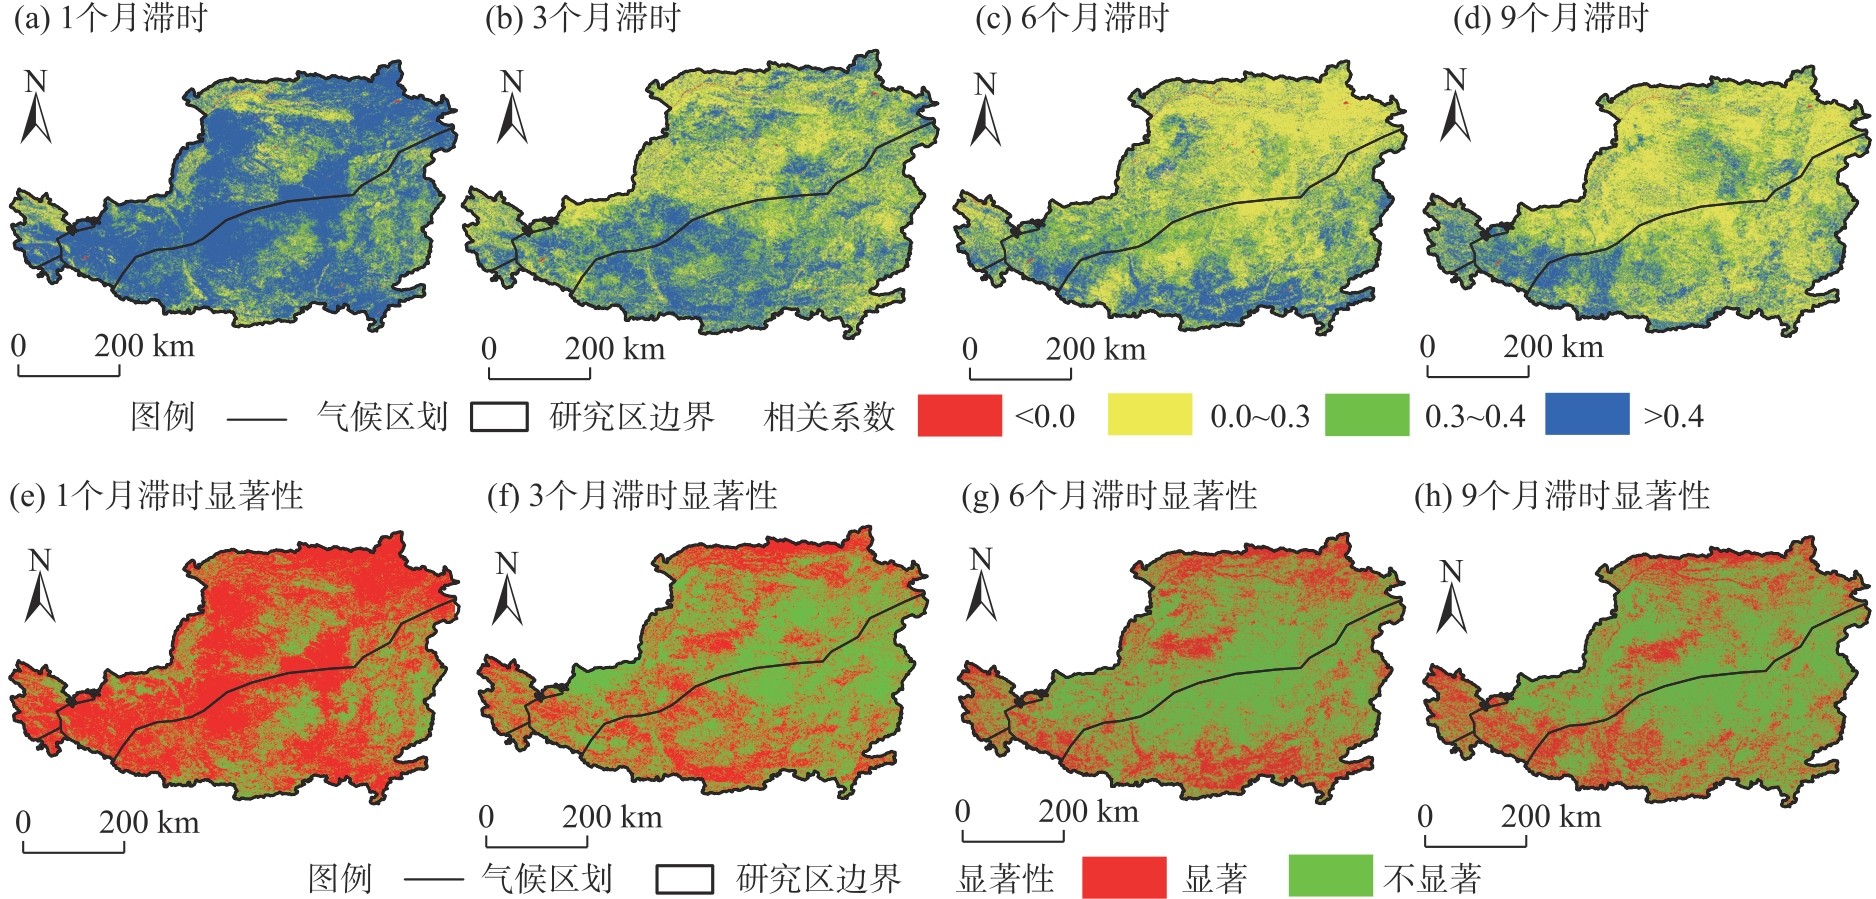
Fig. 3
Lag time distributions of maximum correlation coefficient between NDVI and SPEI in different regions"
Tab. 1
Relationship between different vegetation lag times and maximum correlation coefficients in different climate zones"
| 滞时/月 | 高原气候区 | 南温带气候区 | 中温带气候区 | |||||||||||
|---|---|---|---|---|---|---|---|---|---|---|---|---|---|---|
| 农田 | 森林 | 灌木 | 草地 | 农田 | 森林 | 灌木 | 草地 | 农田 | 森林 | 灌木 | 草地 | |||
| 1 | 0.461 | 0.345 | 0.377 | 0.439 | 0.454 | 0.352 | 0.321 | 0.472 | 0.456 | 0.402 | 0.380 | 0.479 | ||
| 3 | 0.332 | 0.348 | 0.336 | 0.348 | 0.384 | 0.374 | 0.339 | 0.372 | 0.334 | 0.331 | 0.345 | 0.345 | ||
| 6 | 0.358 | 0.349 | 0.339 | 0.339 | 0.369 | 0.361 | 0.353 | 0.322 | 0.286 | 0.292 | 0.332 | 0.296 | ||
| 9 | 0.411 | 0.366 | 0.374 | 0.381 | 0.325 | 0.336 | 0.317 | 0.327 | 0.295 | 0.323 | 0.353 | 0.295 | ||
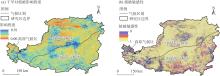
Fig. 4
Impact degree and vegetation sensitivity of drought on vegetation in the Loess Plateau"
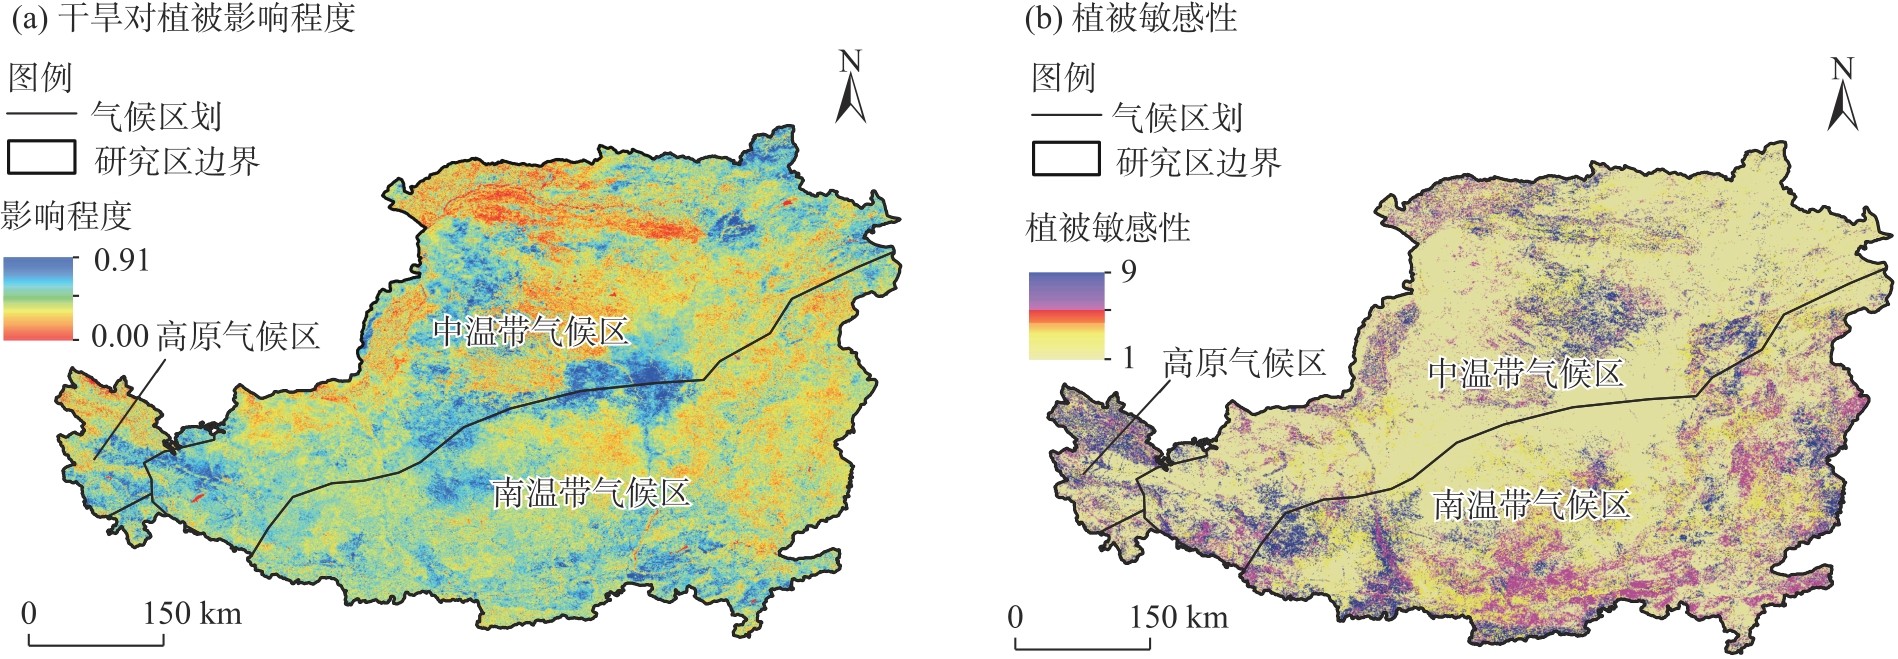
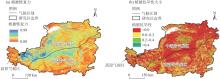
Fig. 5
Distributions of vegetation resilience and vegetation drought resistance"
Tab. 2
Magnitude of drought resistance of different vegetation in different climatic zones"
| 气候区 | 农田 | 森林 | 灌木 | 草地 |
|---|---|---|---|---|
| 高原气候区 | -0.014 | 0.051 | 0.037 | 0.001 |
| 南温带气候区 | -0.016 | 0.011 | 0.023 | -0.024 |
| 中温带气候区 | -0.026 | 0.004 | 0.034 | -0.036 |
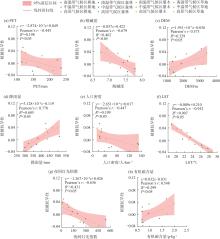
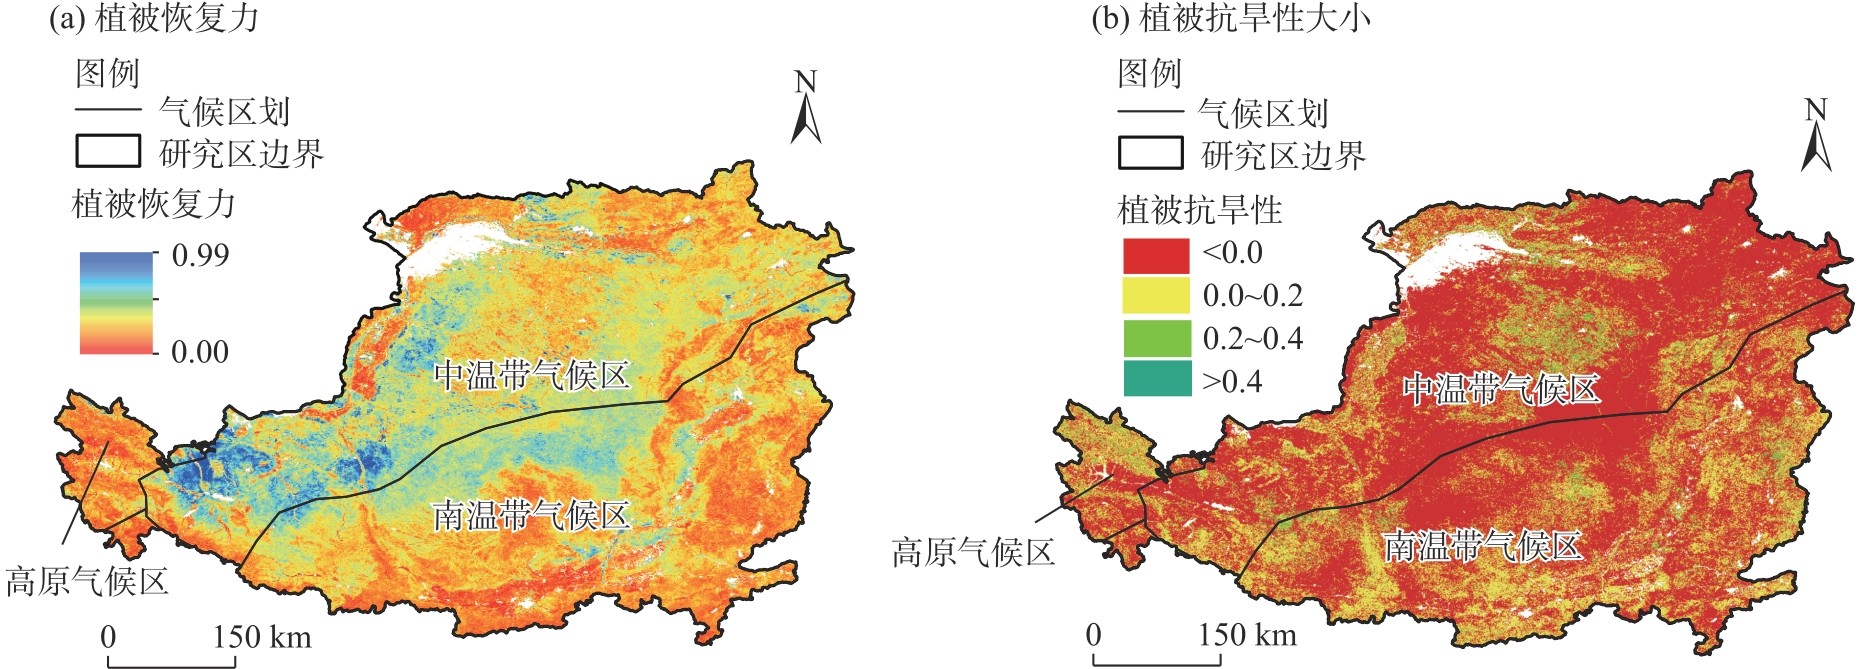
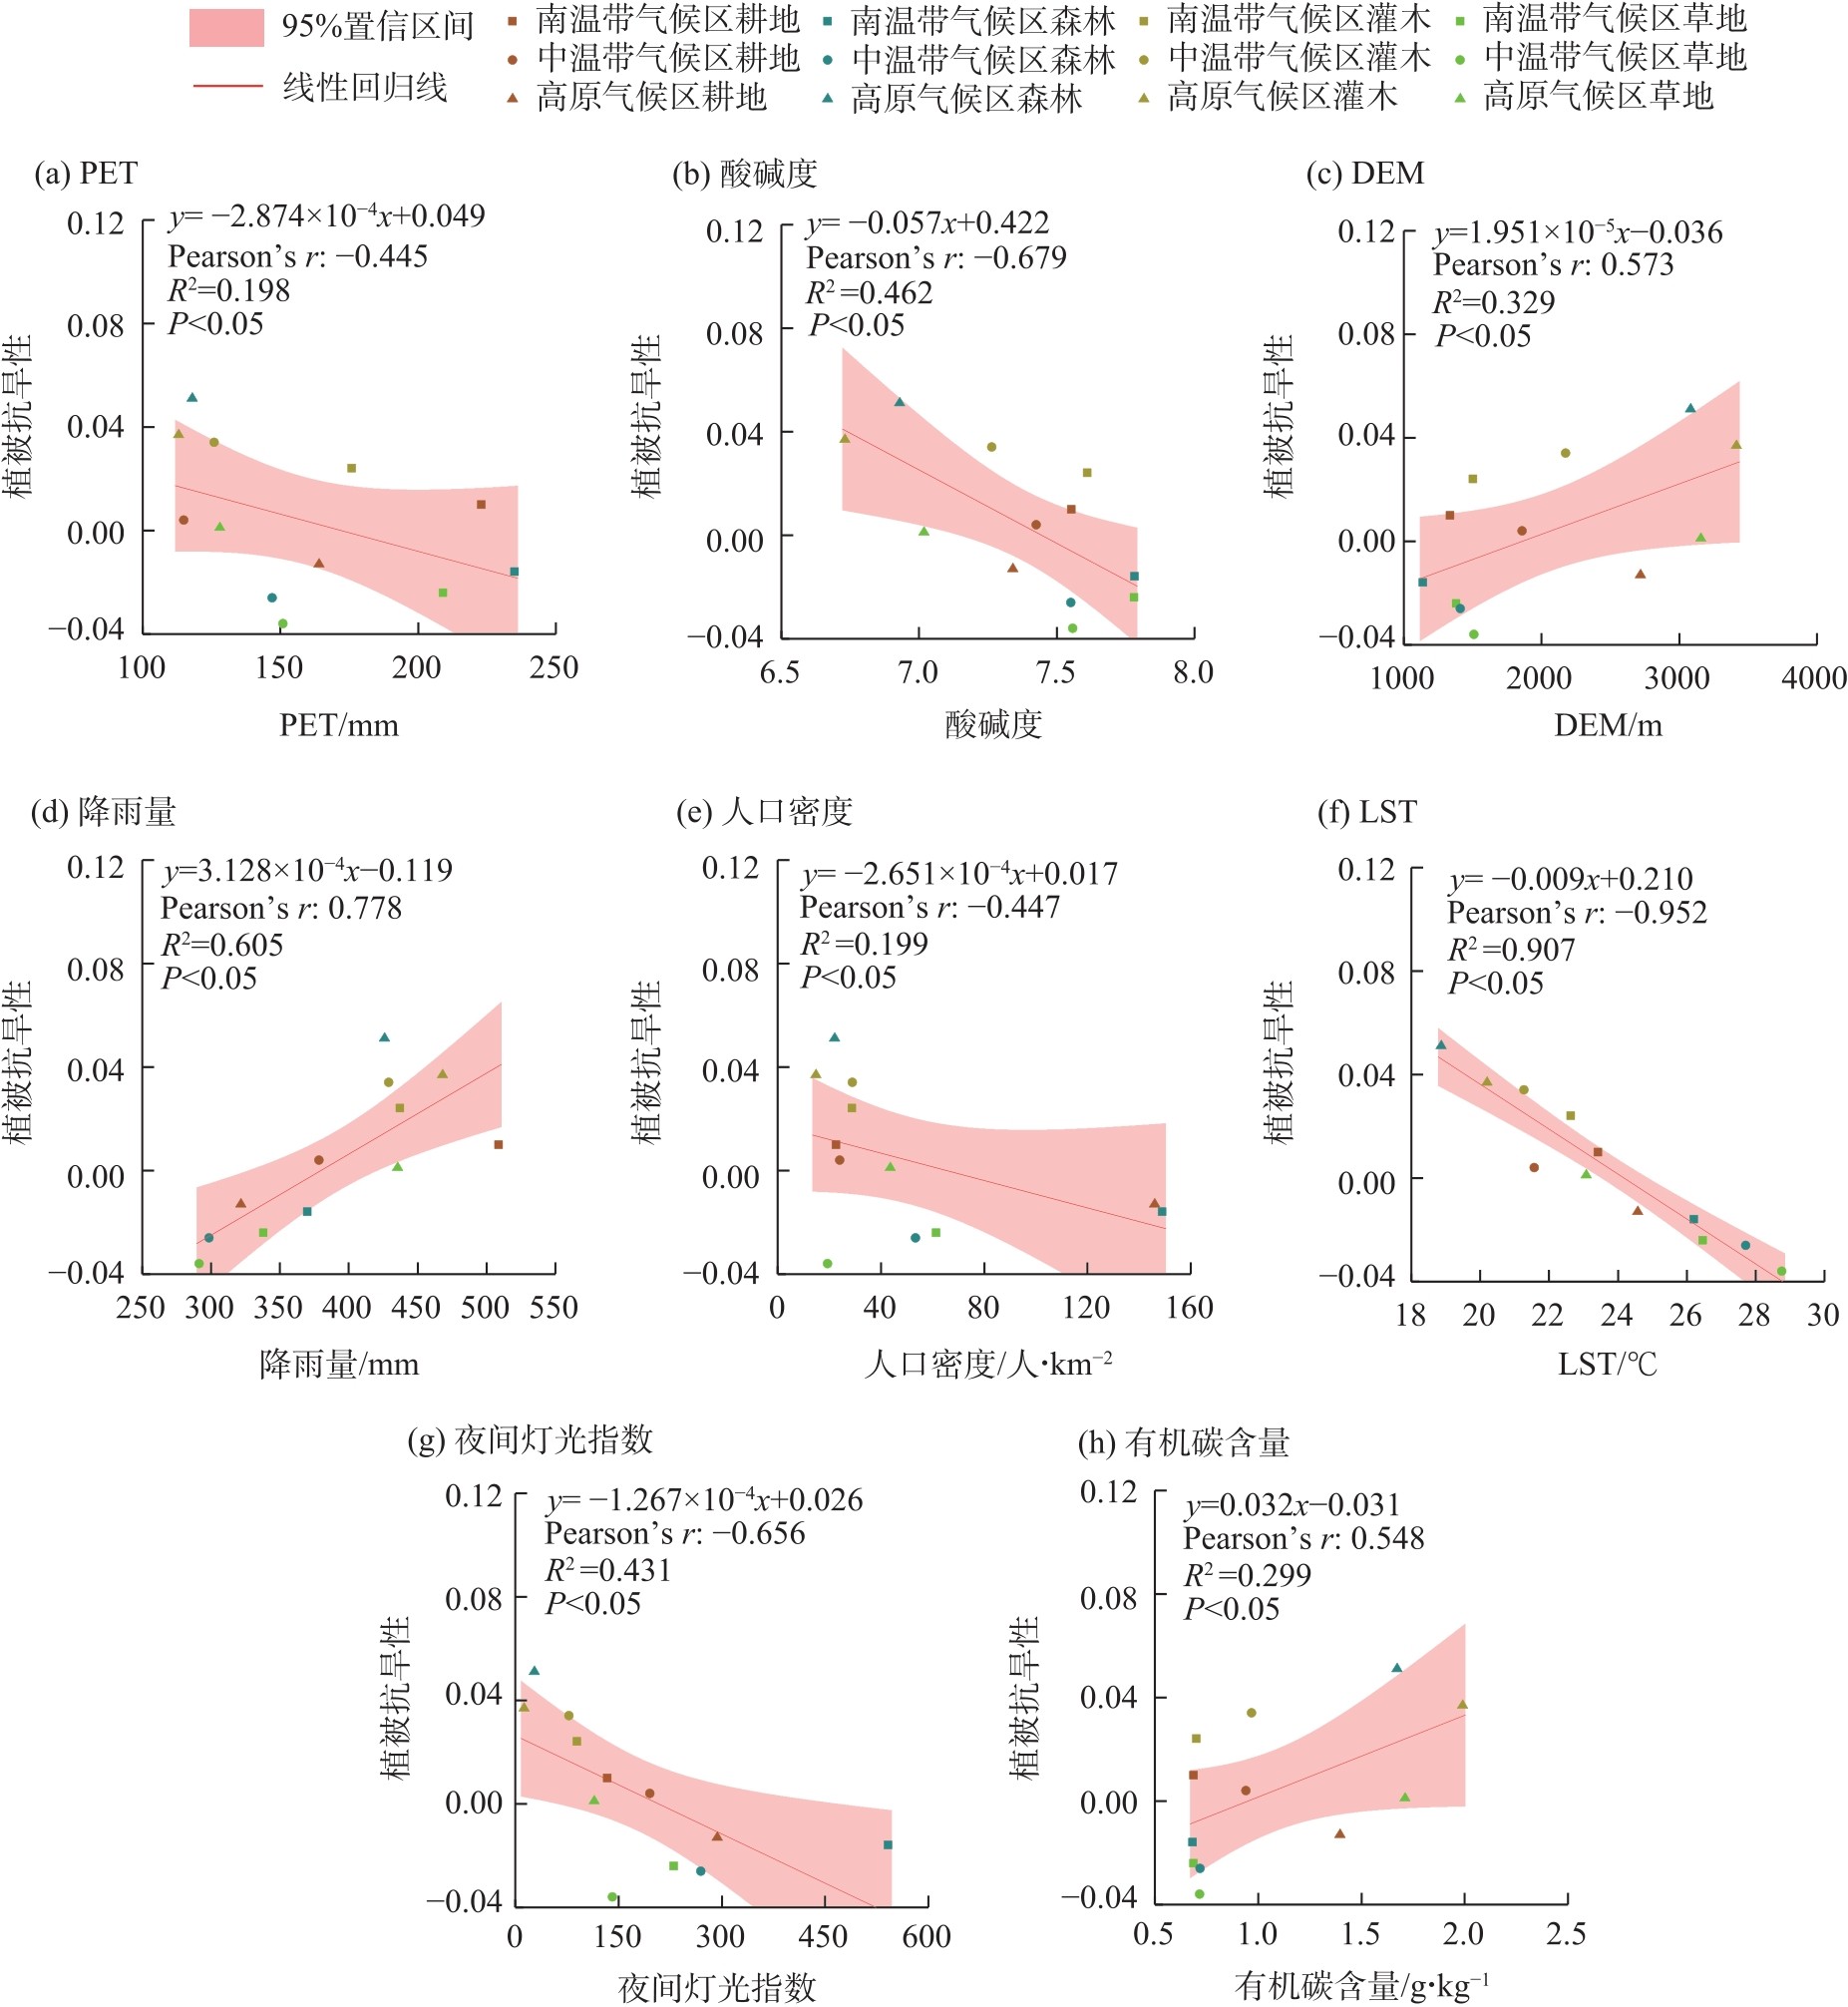
Fig. 6
Relationship between vegetation drought resistance and influencing factors in different climate zones"
Tab. 3
Optimal classification method and classification level of detection factors"
| 探测因子 | 高原气候区 | 南温带气候区 | 中温带气候区 | |||||
|---|---|---|---|---|---|---|---|---|
| 方法 | 分类级别 | 方法 | 分类级别 | 方法 | 分类级别 | |||
| 有效水含量 | 等间距法 | 3 | 几何间隔法 | 4 | 几何间隔法 | 4 | ||
| 土壤类型 | 自然断点法 | 5 | 自然断点法 | 5 | 几何间隔法 | 5 | ||
| 有机碳含量 | 分位数法 | 5 | 分位数法 | 5 | 分位数法 | 5 | ||
| 酸碱度 | 分位数法 | 5 | 等间距法 | 5 | 等间距法 | 4 | ||
| LST | 分位数法 | 5 | 自然断点法 | 5 | 自然断点法 | 5 | ||
| 降雨量 | 标准差法 | 5 | 分位数法 | 5 | 等间距法 | 5 | ||
| PET | 分位数法 | 5 | 分位数法 | 4 | 等间距法 | 5 | ||
| 夜间灯光指数 | 几何间隔法 | 4 | 标准差法 | 5 | 标准差法 | 5 | ||
| 人口密度 | 分位数法 | 5 | 等间距法 | 5 | 自然断点法 | 5 | ||
| DEM | 几何间隔法 | 4 | 标准差法 | 5 | 等间距法 | 5 | ||
| 坡度 | 几何间隔法 | 5 | 等间距法 | 5 | 分位数法 | 5 | ||
| 坡向 | 标准差法 | 5 | 几何间隔法 | 4 | 等间距法 | 5 | ||
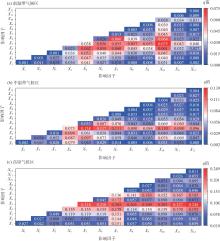
Fig. 7
Two-factor detection results of vegetation drought resistance"

| [1] |
Dai A, Trenberth K E, Qian T. A global dataset of palmer drought severity index for 1870—2002: Relationship with soil moisture and effects of surface warming[J]. Journal of Hydrometeorology, 2004, 5(6): 1117-1130.
doi: 10.1175/JHM-386.1 |
| [2] |
史培军, 李宁, 叶谦, 等. 全球环境变化与综合灾害风险防范研究[J]. 地球科学进展, 2009, 24(4): 428-435.
doi: 10.11867/j.issn.1001-8166.2009.04.0428 |
|
[Shi Peijun, Li Ning, Ye Qian, et al. Research on global environmental change and integrated disaster risk governance[J]. Advances in Earth Science, 2009, 24(4): 428-435.]
doi: 10.11867/j.issn.1001-8166.2009.04.0428 |
|
| [3] | 何翠荣, 窦彩霞, 刘金付. 干旱灾害对粮食安全的影响及应对措施[J]. 现代农业科技, 2010(15): 332-333. |
| [He Cuirong, Dou Caixia, Liu Jinfu. Impact of drought disaster on food security and countermeasures[J]. Modern Agricultural Science and Technology, 2010(15): 332-333.] | |
| [4] | Duca M. Physiology of plant resistance to unfavorable environmental factors[M]. Cham: Springer International Publishing, 2015: 271-308. |
| [5] | 刘斌, 孙艳玲, 王中良, 等. 华北地区植被覆盖变化及其影响因子的相对作用分析[J]. 自然资源学报, 2015, 30(1): 12-23. |
|
[Liu Bin, Sun Yanling, Wang Zhongliang, et al. Analysis of the vegetation cover change and the relative role of its influencing factors in north China[J]. Journal of Natural Resources, 2015, 30(1): 12-23.]
doi: 10.11849/zrzyxb.2015.01.002 |
|
| [6] | 杨舒畅, 杨恒山. 1982—2013年内蒙古地区干旱变化及植被响应[J]. 自然灾害学报, 2019, 28(1): 175-183. |
| [Yang Shuchang, Yang Hengshan. Drought evolution and vegetation response in Inner Mongolia from 1982 to 2013[J]. Journal of Natural Disasters, 2019, 28(1): 175-183.] | |
| [7] |
王凯悦, 陈芳泉, 黄五星. 植物干旱胁迫响应机制研究进展[J]. 中国农业科技导报, 2019, 21(2): 19-25.
doi: 10.13304/j.nykjdb.2018.0115 |
|
[Wang Kaiyue, Chen Fangquan, Huang Wuxing. Research advance on drought stress response mechanism in plants[J]. Journal of Agricultural Science and Technology, 2019, 21(2): 19-25.]
doi: 10.13304/j.nykjdb.2018.0115 |
|
| [8] | 拉本, 胡娟, 张旭萍. 干旱胁迫对植物生理的影响以及分子机制的响应研究进展[J]. 青海草业, 2022, 31(4): 31-35. |
| [La Ben, Hu Juan, Zhang Xuping. Research progress on the effect of drought on plant physiology and the response of molecular mechanism[J]. Qinghai Prataculture, 2022, 31(4): 31-35.] | |
| [9] |
Doughty C E, Metcalfe D B, Girardin C A J, et al. Drought impact on forest carbon dynamics and fluxes in Amazonia[J]. Nature, 2015, 519: 78-82.
doi: 10.1038/nature14213 |
| [10] | Mckee T B, Doesken N J, Kleist J R. The relationship of drought frequency and duration to time scales[R]. Boston: Massachusetts, American Meteorological Society, 1993. |
| [11] |
Wu P T, Jin J M, Zhao X N. Impact of climate change and irrigation technology advancement on agricultural water use in China[J]. Climatic Change, 2010, 100: 797-805.
doi: 10.1007/s10584-010-9860-3 |
| [12] |
Vicente-Serrano S M, Beguería S, López-Moreno J I. A multiscalar drought index sensitive to global warming: The standardized precipitation evapotranspiration index[J]. Journal of Climate, 2010, 23(7): 1696-1718.
doi: 10.1175/2009JCLI2909.1 |
| [13] |
王林, 陈文. 标准化降水蒸散指数在中国干旱监测的适用性分析[J]. 高原气象, 2014, 33(2): 423-431.
doi: 10.7522/j.issn.1000-0534.2013.00048 |
|
[Wang Lin, Chen Wen. Applicability analysis of standardized precipitation evapotranspiration index in drought monitoring in China[J]. Plateau Meteorology, 2014, 33(2): 423-431.]
doi: 10.7522/j.issn.1000-0534.2013.00048 |
|
| [14] | 汪士为, 吴伟. 气候因素与黄土高原植被的时间滞后关系分析[J]. 草业科学, 2025, 42(2): 329-339. |
| [Wang Shiwei, Wu Wei. Analysis of time lag relationships between climate factors and vegetation on the Loess Plateau[J]. Pratacultural Science, 2025, 42(2): 329-339.] | |
| [15] | 韩东, 王鹏新, 张悦, 等. 农业干旱卫星遥感监测与预测研究进展[J]. 智慧农业, 2021, 3(2): 1-14. |
|
[Han Dong, Wang Pengxin, Zhang Yue, et al. Progress of agricultural drought monitoring and forecasting using satellite remote sensing[J]. Smart Agriculture, 2021, 3(2): 1-14.]
doi: 10.12133/j.smartag.2021.3.2.202104-SA002 |
|
| [16] | 李家誉, 佘敦先, 张利平, 等. 黄土高原植被变化对气象干旱多尺度响应特征与机制[J]. 水土保持学报, 2022, 36(6): 280-289. |
| [Li Jiayu, She Dunxian, Zhang Liping, et al. Multi-scale response characteristics and mechanism of vegetation to meteorological drought on the Loess Plateau[J]. Journal of Soil and Water Conservation, 2022, 36(6): 280-289.] | |
| [17] | 姚远, 陈曦, 钱静. 遥感数据在农业旱情监测中的应用研究进展[J]. 光谱学与光谱分析, 2019, 39(4): 1005-1012. |
|
[Yao Yuan, Chen Xi, Qian Jing. Advance in agricultural drought monitoring using remote sensing data[J]. Spectroscopy and Spectral Analysis, 2019, 39(4): 1005-1012.]
doi: 10.3964/j.issn.1000-0593(2019)04-1005-08 |
|
| [18] | 谢宝妮. 黄土高原近30年植被覆盖变化及其对气候变化的响应[D]. 咸阳: 西北农林科技大学, 2016. |
| [Xie Baoni. Changes in vegetation cover and its response to climate change in the Loess Plateau in the last 30 years[D]. Xianyang: Northwest Agriculture and Forestry University, 2016.] | |
| [19] | 王宗明, 张柏. 西北黄土高原区生态恢复重建与农业可持续发展[J]. 农业系统科学与综合研究, 2003(2): 112-115. |
| [Wang Zongming, Zhang Bai. Ecological restoration and reconstruction and agriculture sustainable development in Loess Plateau of northwest China[J]. System Sciences and Comprehensive Studies in Agriculture, 2003(2): 112-115.] | |
| [20] | 胡春宏, 张治昊. 论黄河河道平衡输沙量临界阈值与黄土高原水土流失治理度[J]. 水利学报, 2020, 51(9): 1015-1025. |
| [Hu Chunhong, Zhang Zhihao. Discussing of the critical threshold of equilibrium sediment transport in the Yellow River and the degree of soil erosion control in the Loess Plateau[J]. Journal of Hydraulic Engineering, 2020, 51(9): 1015-1025.] | |
| [21] |
Yang J, Huang X. The 30 m annual land cover datasets and its dynamics in China from 1990 to 2019[J]. Earth System Science Data, 2021, 13(8): 3907-3925.
doi: 10.5194/essd-13-3907-2021 |
| [22] |
山建安, 朱睿, 尹振良, 等. 基于CMIP6模式的中国西北地区干旱时空变化[J]. 干旱区研究, 2024, 41(5): 717-729.
doi: 10.13866/j.azr.2024.05.01 |
|
[Shan Jian’an, Zhu Rui, Yin Zhenliang, et al. Spatial and temporal variation of drought in northwest China based on CMIP6 model[J]. Arid Zone Research, 2024, 41(5): 717-729.]
doi: 10.13866/j.azr.2024.05.01 |
|
| [23] | 夏浩铭, 赵晓阳, 焦文哲, 等. 2001—2020年中国1 km分辨率多时间尺度SPEI数据集[DB/OL]. [2023-07-23]. https://cstr.cn/15732.11.sciencedb.ecodb.00090. |
| [Xia Haoming, Zhao Xiaoyang, Jiao Wenzhe, et al. SPEI dataset with 1 km resolution and multiple time scales in China from 2001 to 2020[DB/OL]. [2023-07-23]. https://cstr.cn/15732.11.sciencedb.ecodb.00090. ] | |
| [24] | 王东. 黄土高原干旱时空特征及对植被生长潜在风险评估[D]. 兰州: 兰州大学, 2023. |
| [Wang Dong. Spatiotemporal characteristics of drought on the Loess Plateau and potential risk assessment for vegetation growth[D]. Lanzhou: Lanzhou University, 2023.] | |
| [25] | 张更喜, 粟晓玲, 郝丽娜, 等. 基于NDVI和scPDSI研究1982—2015年中国植被对干旱的响应[J]. 农业工程学报, 2019, 35(20): 145-151. |
| [Zhang Gengxi, Su Xiaoling, Hao Lina, et al. Response of vegetation to drought based on NDVI and scPDSI data sets from 1982 to 2015 across China[J]. Transactions of the Chinese Society of Agricultural Engineering, 2019, 35(20): 145-151.] | |
| [26] |
林艺真, 邱炳文, 陈芳鑫, 等. 干旱胁迫下植物抗逆性大尺度遥感监测方法[J]. 地球信息科学学报, 2022, 24(11): 2225-2233.
doi: 10.12082/dqxxkx.2022.220152 |
| [Lin Yizhen, Qiu Bingwen, Chen Fangxin, et al. Remote sensing monitoring method for plant stress resistance under drought stress on large scale[J]. Journal of Geo-information Science, 2022, 24(11): 2225-2233.] | |
| [27] | Song Y Z, Wang J F, Ge Y, et al. An optimal parameters-based geographical detector model enhances geographic characteristics of explanatory variables for spatial heterogeneity analysis: Cases with different types of spatial data[J]. GIScience & Remote Sensing, 2020, 57(5): 593-610. |
| [28] |
周孝明, 张喆, 张越, 等. 基于TVDI的近20 a吐鲁番市干旱及影响因素分析[J]. 干旱区地理, 2024, 47(12): 2104-2114.
doi: 10.12118/j.issn.1000-6060.2024.234 |
|
[Zhou Xiaoming, Zhang Zhe, Zhang Yue, et al. TVDI-based analysis of drought and influencing factors in Turpan City in the last 20 years[J]. Arid Land Geography, 2024, 47(12): 2104-2114.]
doi: 10.12118/j.issn.1000-6060.2024.234 |
|
| [29] | 杨蔓红, 尹宁玲, 左金友, 等. 基于植被指数的生态恢复力评价及影响因素研究——以武陵山片区为例[J]. 江西农业学报, 2024, 36(3): 93-101. |
| [Yang Manhong, Yin Ningling, Zuo Jinyou, et al. Evaluation and influencing factors of ecological resilience evaluation and influencing factors of ecological resilience[J]. Acta Agriculturae Jiangxi, 2024, 36(3): 93-101.] | |
| [30] | 焦盼盼. 水分变化对黄土高原典型土壤有机碳矿化影响的微生物作用机制[D]. 北京: 中国科学院大学, 2023. |
| [Jiao Panpan. Mechanisms of microbial effects of water change on organic carbon mineralization of typical soil on the Loess Plateau[D]. Beijing: University of Chinese Academy of Sciences, 2023.] | |
| [31] |
Ocheltree T W, Nippert J B, Prasad P V. A safety vs efficiency trade-off identified in the hydraulic pathway of grass leaves is decoupled from photosynthesis, stomatal conductance and precipitation[J]. New Phytologist, 2016, 210(1): 97-107.
doi: 10.1111/nph.13781 pmid: 26680276 |
| [32] | 孙明伟. 不同光合类型植物对干旱-复水的光合生理响应及生长适应策略[D]. 长春: 东北师范大学, 2021. |
| [Sun Mingwei. Photosynthetic physiology and growth adaptation strategies of plants with different photosynthetic types to drought rewatering[D]. Changchun: Northeast Normal University, 2021.] | |
| [33] | 史尚渝, 王飞, 金凯, 等. 黄土高原地区植被指数对干旱变化的响应[J]. 干旱气象, 2020, 38(1): 1-13. |
| [Shi Shangyu, Wang Fei, Jin Kai, et al. Response of vegetation index to meteorological drought over Loess Plateau[J]. Journal of Arid Meteorology, 2020, 38(1): 1-13.] | |
| [34] | Camps-Valls G, Campos-Taberner M, Moreno-Martínez A, et al. A unified vegetation index for quantifying the terrestrial biosp-here[J]. Science Advances, 2021, 7(9): eabc7447, doi: 10.1126/sciadv.abc7447. |
| [35] | 张更喜, 王慧敏, 粟晓玲, 等. 复合干热胁迫下黄土高原夏季植被脆弱性评估[J]. 农业工程学报, 2024, 40(6): 339-346. |
| [Zhang Gengxi, Wang Huimin, Su Xiaoling, et al. Assessing the vegetation vulnerability of Loess Plateau under compound dry and hot climates[J]. Transactions of the Chinese Society of Agricultural Engineering, 2024, 40(6): 339-346.] |
|
||