Arid Land Geography ›› 2025, Vol. 48 ›› Issue (11): 1903-1912.doi: 10.12118/j.issn.1000-6060.2024.729
• Climate Change • Previous Articles Next Articles
CHEN Xianlin1( ), YAN Zhiyuan1(), LIU Quanming1,2, LI Ruiping1, ZHANG Shengwei1,2,3
Received:2024-12-05
Revised:2025-01-03
Online:2025-11-25
Published:2025-11-26
Contact:
YAN Zhiyuan
E-mail:chenxl@emails.imau.edu.cn;yanzy@imau.edu.cn
CHEN Xianlin, YAN Zhiyuan, LIU Quanming, LI Ruiping, ZHANG Shengwei. Spatiotemporal characteristics of drought in Inner Mongolia based on GEE and optimal remote sensing drought index[J].Arid Land Geography, 2025, 48(11): 1903-1912.
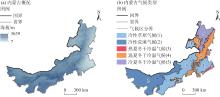
Fig. 1
Schematic diagram of the study area and Köppen climate zone types"

Tab. 1
Basic information of data sources"
| 数据 | 来源 | 年份 | 空间分辨率 | 时间分辨率 |
|---|---|---|---|---|
| 归一化植被指数(NDVI) | 美国国家海洋与大气管理局AVHRR NDVI数据集 ( | 1982—2021 | 0.05° | 1 d |
| 土壤水分(SM)、蒸散发(ET) 和潜在蒸散发(PET) | TerraClimate数据集( | 1982—2021 | 4.6 km | 逐月 |
| 地表温度(LST) | ERA5-Land再分析数据集( | 1982—2021 | 0.1° | 逐月 |
| 标准化降水蒸散指数(SPEI) | 全球标准化降水蒸散指数格网数据集2.9版本( | 1982—2021 | 0.5° | 逐月 |
Tab. 2
Calculation methods of remote sensing drought indices"
| 遥感干旱指数 | 计算方法 | 参数说明 |
|---|---|---|
| 归一化植被供水指数(NVSWI) | NDVI为归一化植被指数;LST为地表温度(℃);VSWI为植被供水指数; | |
| 作物缺水指数(CWSI) | ET为实际蒸散发(mm);PET为潜在蒸散发(mm) | |
| 温度植被旱情指数(TVDI) | ||
| 植被状况指数(VCI) | ||
| 温度状况指数(TCI) |
Tab. 3
Classification of the optimal drought index’s change trend"
| Sen斜率值(S) | P值 | 变化趋势分级 |
|---|---|---|
| S>0 | P<0.01 | 极显著升高 |
| S>0 | 0.01≤P<0.05 | 显著升高 |
| S=0 | P>0.05 | 无显著变化 |
| S<0 | 0.01≤P<0.05 | 显著降低 |
| S<0 | P<0.01 | 极显著降低 |
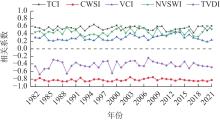
Fig. 2
Annual changes of the correlation coefficients of the drought indices and soil moisture in Inner Mongolia from 1982 to 2021"
Tab. 4
Spatial correlation between drought index and SPEI in different climate zones"
| 气候类型 | TCI | CWSI | VCI | NVSWI | TVDI |
|---|---|---|---|---|---|
| 冷性草原气候 | 0.328 | -0.663 | 0.183 | 0.272 | -0.301 |
| 冷性荒漠气候 | 0.386 | -0.649 | 0.213 | 0.279 | -0.326 |
| 热夏冬干冷温气候 | 0.575 | -0.601 | 0.311 | 0.304 | -0.233 |
| 温夏冬干冷温气候 | 0.461 | -0.630 | 0.252 | 0.289 | -0.289 |
| 冷夏冬干冷温气候 | 0.502 | -0.620 | 0.274 | 0.295 | -0.269 |
| 全区 | 0.401 | -0.653 | 0.221 | 0.284 | -0.304 |
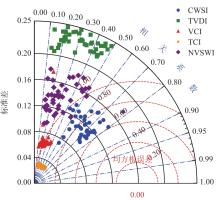
Fig. 3
Taylor diagram of different drought indices in Inner Mongolia from 1982 to 2021"

Tab. 5
Drought classification criteria"
| 等级 | CWSI | 干旱类型 |
|---|---|---|
| 1 | 0.0~0.6 | 无旱 |
| 2 | 0.6~0.7 | 轻旱 |
| 3 | 0.7~0.8 | 中旱 |
| 4 | 0.8~0.9 | 重旱 |
| 5 | 0.9~1.0 | 特旱 |

Fig. 4
Agricultural drought classification of Inner Mongolia based on CWSI from 1982 to 2021"
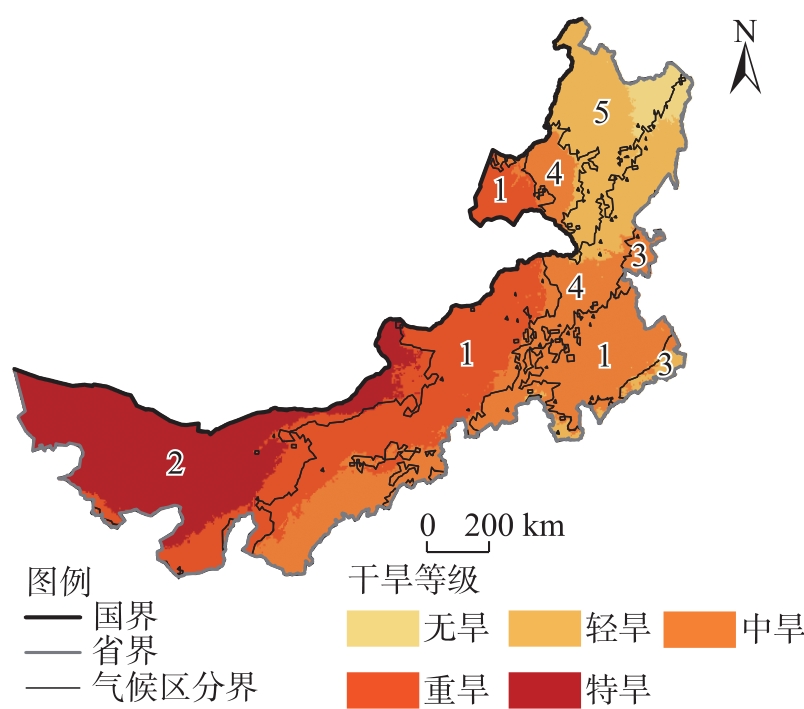
Tab. 6
Area proportion of drought grades in different climate zones from 1982 to 2021 /%"
| 干旱 等级 | 冷性草 原气候 | 冷性荒 漠气候 | 热夏冬干冷温气候 | 温夏冬干 冷温气候 | 冷夏冬干 冷温气候 | 全区 |
|---|---|---|---|---|---|---|
| 无旱 | 0.00 | 0.00 | 0.00 | 4.50 | 15.71 | 2.95 |
| 轻旱 | 0.20 | 0.00 | 36.64 | 35.49 | 82.48 | 18.35 |
| 中旱 | 46.55 | 0.01 | 63.36 | 58.60 | 1.81 | 29.25 |
| 重旱 | 52.96 | 22.44 | 0.00 | 1.41 | 0.00 | 26.38 |
| 特旱 | 0.29 | 77.55 | 0.00 | 0.00 | 0.00 | 23.07 |
Fig. 5
Annual time series of the mean CWSI in different climate zones in Inner Mongolia from 1982 to 2021"
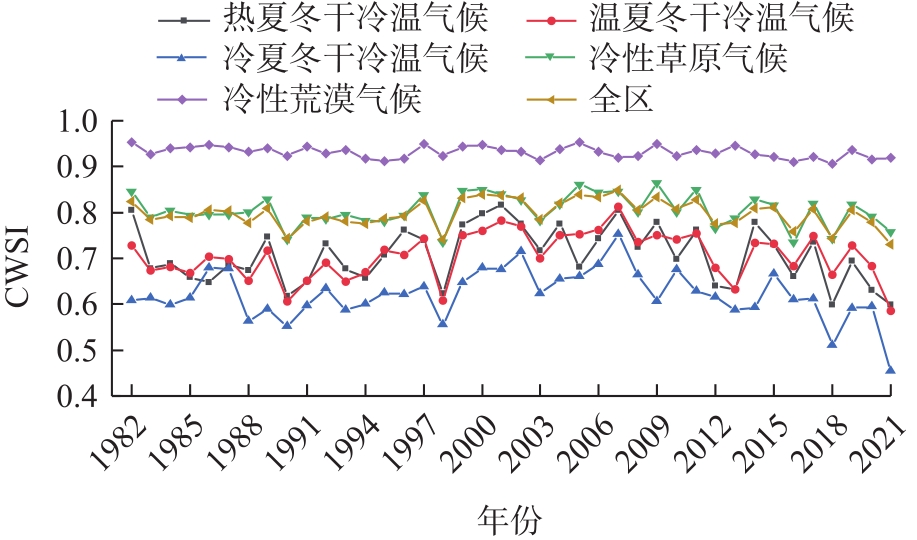
Fig. 6
Spatial patterns of the change trends of annual CWSI in Inner Mongolia from 1982 to 2021"
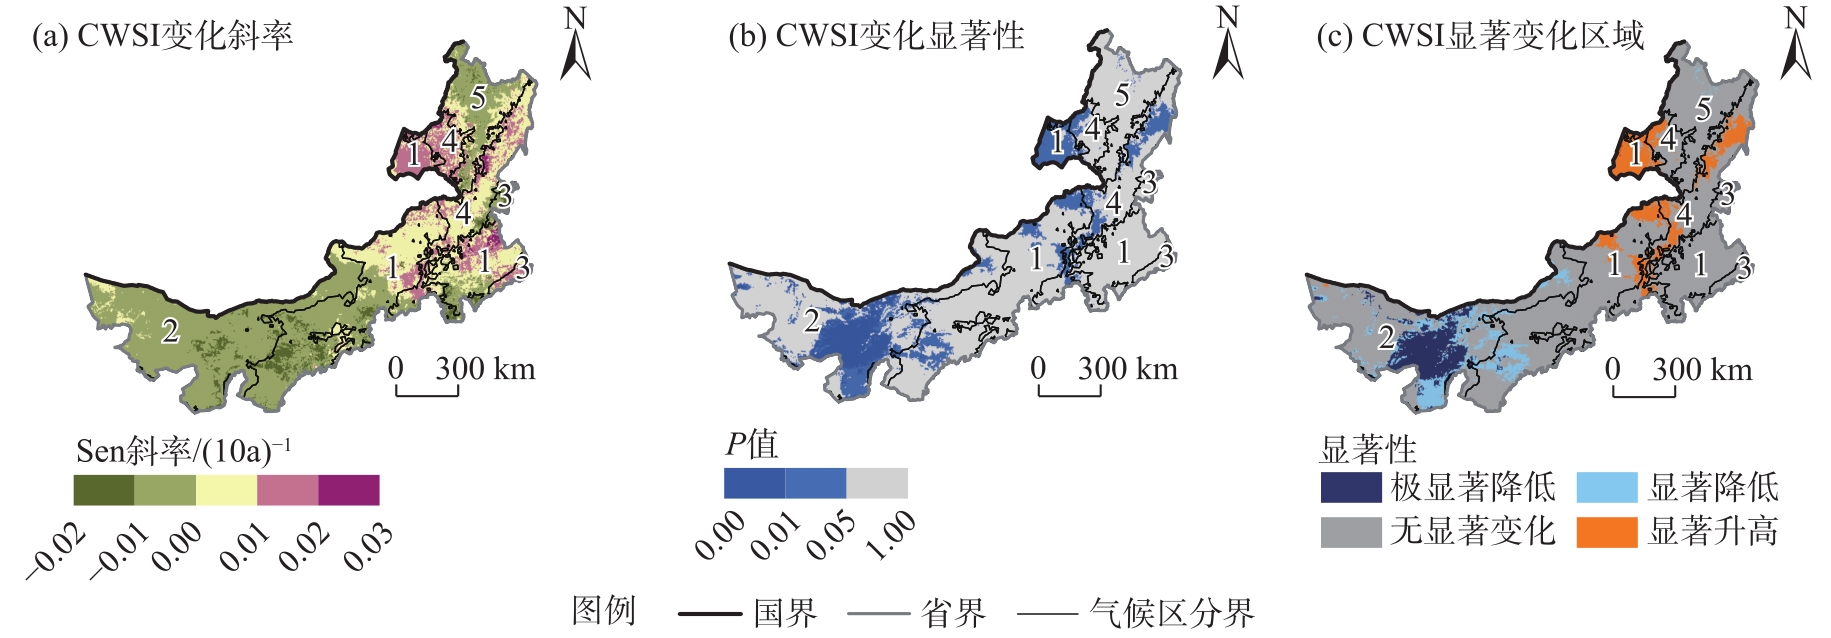

Fig. 7
Average SPEI from 1982 to 2021"
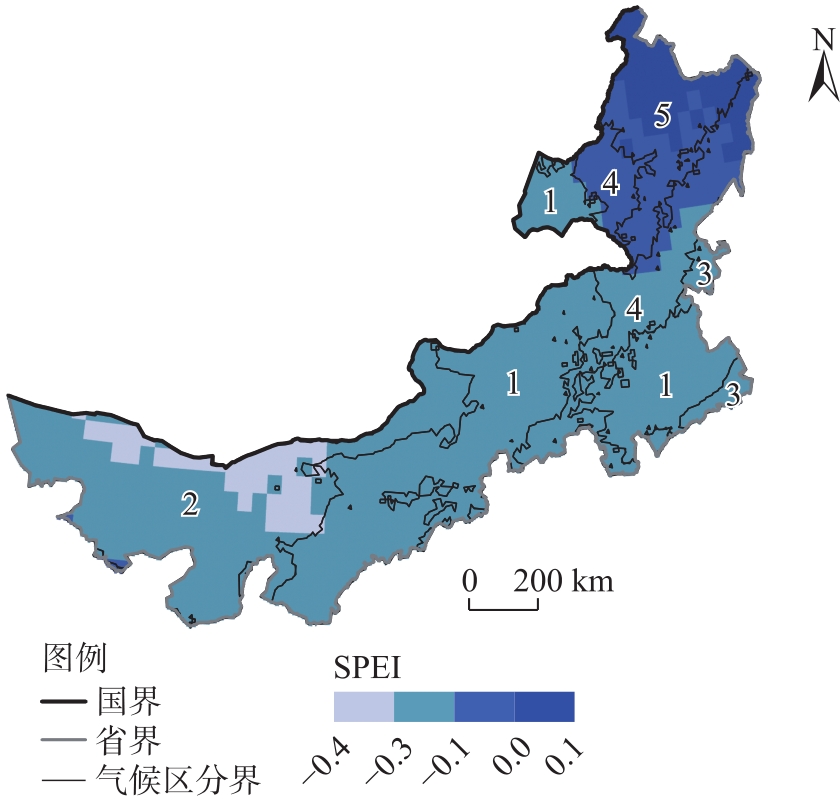
Fig. 8
Correlation between CWSI and SPEI in Inner Mongolia from 1982 to 2021"

| [1] | 汤连盟, 吕伟才, 蒲涛, 等. 西北地区干旱时空动态分布及成因分析[J]. 遥感信息, 2023, 38(5): 66-72. |
| [Tang Lianmeng, Lü Weicai, Pu Tao, et al. Spatio-temporal dynamic distribution and cause analysis of drought in northwest China[J]. Remote Sensing Information, 2023, 38(5): 66-72. ] | |
| [2] |
Mukherjee S, Mishra A, Trenberth K E. Climate change and drought: A perspective on drought indices[J]. Current Climate Change Reports, 2018, 4(2): 145-163.
doi: 10.1007/s40641-018-0098-x |
| [3] | 吴天晓, 李宝富, 郭浩, 等. 基于优选遥感干旱指数的华北平原干旱时空变化特征分析[J]. 生态学报, 2023, 43(4): 1621-1634. |
| [Wu Tianxiao, Li Baofu, Guo Hao, et al. Analysis of drought variation characteristics in North China Plain based on optimized remote sensing drought index[J]. Acta Ecologica Sinica, 2023, 43(4): 1621-1634. ] | |
| [4] |
刘宪锋, 朱秀芳, 潘耀忠, 等. 农业干旱监测研究进展与展望[J]. 地理学报, 2015, 70(11): 1835-1848.
doi: 10.11821/dlxb201511012 |
| [Liu Xianfeng, Zhu Xiufang, Pan Yaozhong, et al. Agricultural drought monitor: Progress, challenges and prospect[J]. Journal of Geographical Sciences, 2015, 70(11): 1835-1848. ] | |
| [5] |
Liang L, Zhao S H, Qin Z H, et al. Drought change trend using MODIS TVDI and its relationship with climate factors in China from 1982 to 2010[J]. Journal of Integrative Agriculture, 2014, 13(7): 1501-1508.
doi: 10.1016/S2095-3119(14)60813-3 |
| [6] |
蒙继华, 何荣鹏, 林圳鑫. Google Earth Engine在农业管理中的研究现状与展望[J]. 地球信息科学学报, 2024, 26(4): 1002-1018.
doi: 10.12082/dqxxkx.2024.230760 |
| [Meng Jihua, He Rongpeng, Lin Zhenxin. Status and prospects of Google Earth Engine in agricultural management research[J]. Journal of Geo-information Science, 2024, 26(4): 1002-1018. ] | |
| [7] | 张伟, 杜培军, 郭山川, 等. 改进型遥感生态指数及干旱区生态环境评价[J]. 遥感学报, 2023, 27(2): 299-317. |
|
[Zhang Wei, Du Peijun, Guo Shanchuan, et al. Enhanced remote sensing ecological index and ecological environment evaluation in arid area[J]. National Remote Sensing Bulletin, 2023, 27(2): 299-317. ]
doi: 10.11834/jrs.20221527 |
|
| [8] | 张宏民, 赵书河, 陈诚, 等. 苏丹遥感干旱指数及其适用性[J]. 遥感信息, 2016, 31(4): 48-55. |
| [Zhang Hongmin, Zhao Shuhe, Chen Cheng, et al. Adaptability of remote sensing drought index in Sudan[J]. Remote Sensing Information, 2016, 31(4): 48-55. ] | |
| [9] | 马梓策, 孙鹏, 姚蕊, 等. 内蒙古地区干旱时空变化特征及其对植被的影响[J]. 水土保持学报, 2022, 36(6): 231-240. |
|
[Ma Zice, Sun Peng, Yao Rui, et al. Temporal and spatial variation of drought and its impact on vegetation in Inner Mongolia[J]. Journal of Soil and Water Conservation, 2022, 36(6): 231-240. ]
doi: 10.1080/00224561.1981.12436113 |
|
| [10] | 程小强, 周兆叶, 李旺平, 等. 基于MODIS数据的中亚地区旱情监测及影响因素分析[J]. 农业工程学报, 2022, 38(10): 128-137. |
| [Cheng Xiaoqiang, Zhou Zhaoye, Li Wangping, et al. Monitoring drought situation and analyzing influencing factors in Central Asia using MODIS data[J]. Transactions of the Chinese Society of Agricultural Engineering, 2022, 38(10): 128-137. ] | |
| [11] |
Kukunuri A N J, Murugan D, Singh D. Variance based fusion of VCI and TCI for efficient classification of agriculture drought using MODIS data[J]. Geocarto International, 2020, 37(10): 2871-2892.
doi: 10.1080/10106049.2020.1837256 |
| [12] | Vermote E, Justice C, Csiszar I, et al. NOAA climate data record (CDR) of normalized difference vegetation index (NDVI), Version 4[J/OL]. NOAA National Centers for Environmental Information. [2024-11-20]. https://climatedataguide.ucar.edu/climate-data/ndvi-normalized-difference-vegetation-index-noaa-avhrr. |
| [13] | Abatzoglou J T, Dobrowski S Z, Parks S A, et al. Terraclimate, a high-resolution global dataset of monthly climate and climatic water balance from 1958—2015[J]. Scientific Data, 2018, 5: 170-191. |
| [14] |
Bell B, Hans H, Adrian S, et al. The ERA5 global reanalysis: Preliminary extension to 1950[J]. Quarterly Journal of the Royal Meteorological Society, 2021, 147(741): 4186-4227.
doi: 10.1002/qj.v147.741 |
| [15] | Vicente-Serrano S M, Beguería S, López-Moreno J I, et al. A multiscalar drought index sensitive to global warming: The standardized precipitation evapotranspiration index[J]. Climate, 2010, 23: 1696-1718. |
| [16] |
Chen D, Chen H W. Using the Köppen classification to quantify climate variation and change: An example for 1901—2010[J]. Environmental Development, 2013, 6: 69-79.
doi: 10.1016/j.envdev.2013.03.007 |
| [17] | 张璐, 朱仲元, 张圣微, 等. 半干旱草原型流域土壤水分变异及其影响因素分析[J]. 农业工程学报, 2020, 36(13): 124-132. |
| [Zhang Lu, Zhu Zhongyuan, Zhang Shengwei, et al. Analysis of soil moisture variation and its influencing factors in semi-arid steppe watershed[J]. Transactions of the Chinese Society of Agricultural Engineering, 2020, 36(13): 124-132. ] | |
| [18] |
金令, 王永芳, 郭恩亮, 等. 基于SPEIbase v. 2.6数据集的内蒙古旱灾危险性评价[J]. 干旱区地理, 2022, 45(3): 695-705.
doi: 10.12118/j.issn.1000-6060.2021.335 |
|
[Jin Ling, Wang Yongfang, Guo Enliang, et al. Evaluation of drought hazards in Inner Mongolia based on SPEIbase v.2.6 dataset[J]. Arid Land Geography, 2022, 45(3): 695-705. ]
doi: 10.12118/j.issn.1000-6060.2021.335 |
|
| [19] | Wang X Z, Li B F, Chen Y N, et al. Applicability evaluation of multisource satellite precipitation data for hydrological research in arid mountainous areas[J]. Remote Sensing, 2020, 12: 2886, doi: 10.3390/rs12182886. |
| [20] | 闫志远, 张圣微, 王怡璇. 基于GEE的1982—2021年内蒙古地区植被覆盖度时空动态及气候响应特征[J]. 农业工程学报, 2023, 39(15): 94-102. |
| [Yan Zhiyuan, Zhang Shengwei, Wang Yixuan. Spatiotemporal dynamics of fractional vegetation cover and climate response in Inner Mongolia during 1982—2021 based on GEE[J]. Transactions of the Chinese Society of Agricultural Engineering, 2023, 39(15): 94-102. ] | |
| [21] | GB/T20481-2017. 气象干旱等级[S]. 全国气候与气候变化标准化技术委员会(SAC/TC 540), 2017. |
| [GB/T20481-2017. Grades of meteorological drought[S]. National Technical Committee for Climate and Climate Change Standardization (SAC/TC 540), 2017. ] | |
| [22] | 张煦庭, 潘学标, 徐琳, 等. 基于降水蒸发指数的1960—2015年内蒙古干旱时空特征[J]. 农业工程学报, 2017, 33(15): 190-199. |
| [Zhang Xuting, Pan Xuebiao, Xu Lin, et al. Analysis of spatio-temporal distribution of drought characteristics based on SPEI in Inner Mongolia during 1960—2015[J]. Transactions of the Chinese Society of Agricultural Engineering, 2017, 33(15): 190-199. ] | |
| [23] |
牛怡莹, 李春兰, 王军, 等. 内蒙古ERA5再分析降水数据性能评估与极端降水时空特征分析[J]. 干旱区地理, 2023, 46(9): 1418-1431.
doi: 10.12118/j.issn.1000-6060.2022.607 |
|
[Niu Yiying, Li Chunlan, Wang Jun, et al. Performance evaluation of ERA5 reanalysis precipitation data and spatiotemporal characteristics of extreme precipitation in Inner Mongolia[J]. Arid Land Geography, 2023, 46(9): 1418-1431. ]
doi: 10.12118/j.issn.1000-6060.2022.607 |
|
| [24] | Xu Y, Fang J, Wang P Y, et al. Effect of soil moisture on future heatwaves over eastern China: Convection-permitting regional climate simulations[J]. Journal of Geophysical Research: Atmospheres, 2024, 129(19): e2024JD041654, doi: 10.1029/2024jd041654. |
| [25] |
Wang Q, Zhai P M. CMIP6 Projections of the “warming-wetting” trend in northwest China and related extreme events based on observational constraints[J]. Journal of Meteorological Research, 2022, 36(2): 239-250.
doi: 10.1007/s13351-022-1157-8 |
| [26] | 赵水霞, 王文君, 吴英杰, 等. 综合干旱指数构建及其在不同草原类型中的应用[J]. 农业工程学报, 2021, 37(16): 99-107. |
| [Zhao Shuixia, Wang Wenjun, Wu Yingjie, et al. Construction and application of comprehensive drought index in different steppe types[J]. Transactions of the Chinese Society of Agricultural Engineering, 2021, 37(16): 99-107. ] | |
| [27] | 邹艺, 朱丽蓉, 林尤文, 等. 考虑下垫面影响的海南岛干旱区昌化江流域旱涝时空分布规律[J]. 生态科学, 2024, 43(4): 149-158. |
| [Zou Yi, Zhu Lirong, Lin Youwen, et al. Temporal and spatial distribution of drought and flood in Changhua River Basin in arid region of Hainan Island considering the influence of underlying surface[J]. Ecological Science, 2024, 43(4): 149-158. ] | |
| [28] | 王椰, 史海静, 姜艳敏, 等. 基于TVDI的黄土高原干旱时空变化与其影响因素[J]. 农业机械学报, 2023, 54(7): 184-195. |
| [Wang Ye, Shi Haijing, Jiang Yanmin, et al. Spatio-temporal variation of drought characteristics and its influencing factors in Loess Plateau based on TVDI[J]. Transactions of the Chinese Society for Agricultural Machinery, 2023, 54(7): 184-195. ] | |
| [29] | 宋廷强, 鲁雪丽, 卢梦瑶, 等. 基于作物缺水指数的农业干旱监测模型构建[J]. 农业工程学报, 2021, 37(24): 65-72. |
| [Song Tingqiang, Lu Xueli, Lu Mengyao, et al. Construction of agricultural drought monitoring model based on crop water stress index[J]. Transactions of the Chinese Society of Agricultural Engineering, 2021, 37(24): 65-72. ] | |
| [30] | 邹睿, 尹义星, 王小军, 等. 鄱阳湖流域气象干旱向水文干旱传递的时间特征研究[J]. 水文, 2024, 44(4): 69-76, 88. |
| [Zou Rui, Yin Yixing, Wang Xiaojun, et al. Study on the temporal characteristics of meteorological drought to hydrological drought propagation in the Poyang Lake Basin[J]. Journal of China Hydrology, 2024, 44(4): 69-76, 88. ] |
|
||