干旱区地理 ›› 2023, Vol. 46 ›› Issue (2): 264-273.doi: 10.12118/j.issn.1000-6060.2022.046
窦睿音1( ),张文洁1,2(),陈晨1
收稿日期:2022-01-27
修回日期:2022-06-09
出版日期:2023-02-25
发布日期:2023-03-14
通讯作者:
张文洁(1999-),女,硕士研究生,主要从事土地利用与可持续发展等方面的研究. E-mail: 作者简介:窦睿音(1989-),男,副教授,主要从事区域可持续发展等方面的研究. E-mail: 基金资助:
DOU Ruiyin1(),ZHANG Wenjie1,2(),CHEN Chen1
Received:2022-01-27
Revised:2022-06-09
Online:2023-02-25
Published:2023-03-14
摘要:
陕西省作为我国承东启西的重要省份,其土地利用的合理规划对于促进区域高质量发展意义重大。以土地功能为视角,运用土地利用转移矩阵等模型,探究2000—2020年陕西省“三生”空间的数量及分布特征和变化趋势,最终分析不同尺度分布变化的内在原因。结果表明:(1) “三生”空间综合土地利用动态度在0.2%波动,期间有2次速率增长,首次是生活空间扩张导致,其次与生态空间增长相关。单一动态度中,生活空间的数值最大,多为正值;生产空间速率次之,多为负值;生态空间多为正值,稳定在0.1%。(2) 2000—2020年生产空间变化最大,总面积减小2913 km2,其余类型增加,生态空间增长更多;二级分类中,生产生态空间减少4036 km2,变化最大,其余类型除潜在生态空间外均为增加,绿色生态空间扩大2025 km2,增加最多。(3) “三生”空间分布与地形地貌相关,其整体以生态空间为主,多分布于省域南部,生产空间主要位于省域中部,生活空间多分布于西安都市圈一带,面积最小,但逐年向外扩张。(4) 因子探测中,人口要素对陕西省“三生”空间演化起主导作用;交互探测后,多因子交互后的结果强于单一因子的简单解释。
窦睿音, 张文洁, 陈晨. 陕西省“三生”空间格局演变与驱动机制研究[J]. 干旱区地理, 2023, 46(2): 264-273.
DOU Ruiyin, ZHANG Wenjie, CHEN Chen. Land use change based on production-living-ecology spaces and its driving forces in Shaanxi Province[J]. Arid Land Geography, 2023, 46(2): 264-273.

图1
研究区范围 注:该图基于国家测绘地理信息局标准地图服务网站下载的审图号为GS(2019)3333号的标准地图制作,底图边界无修改。"
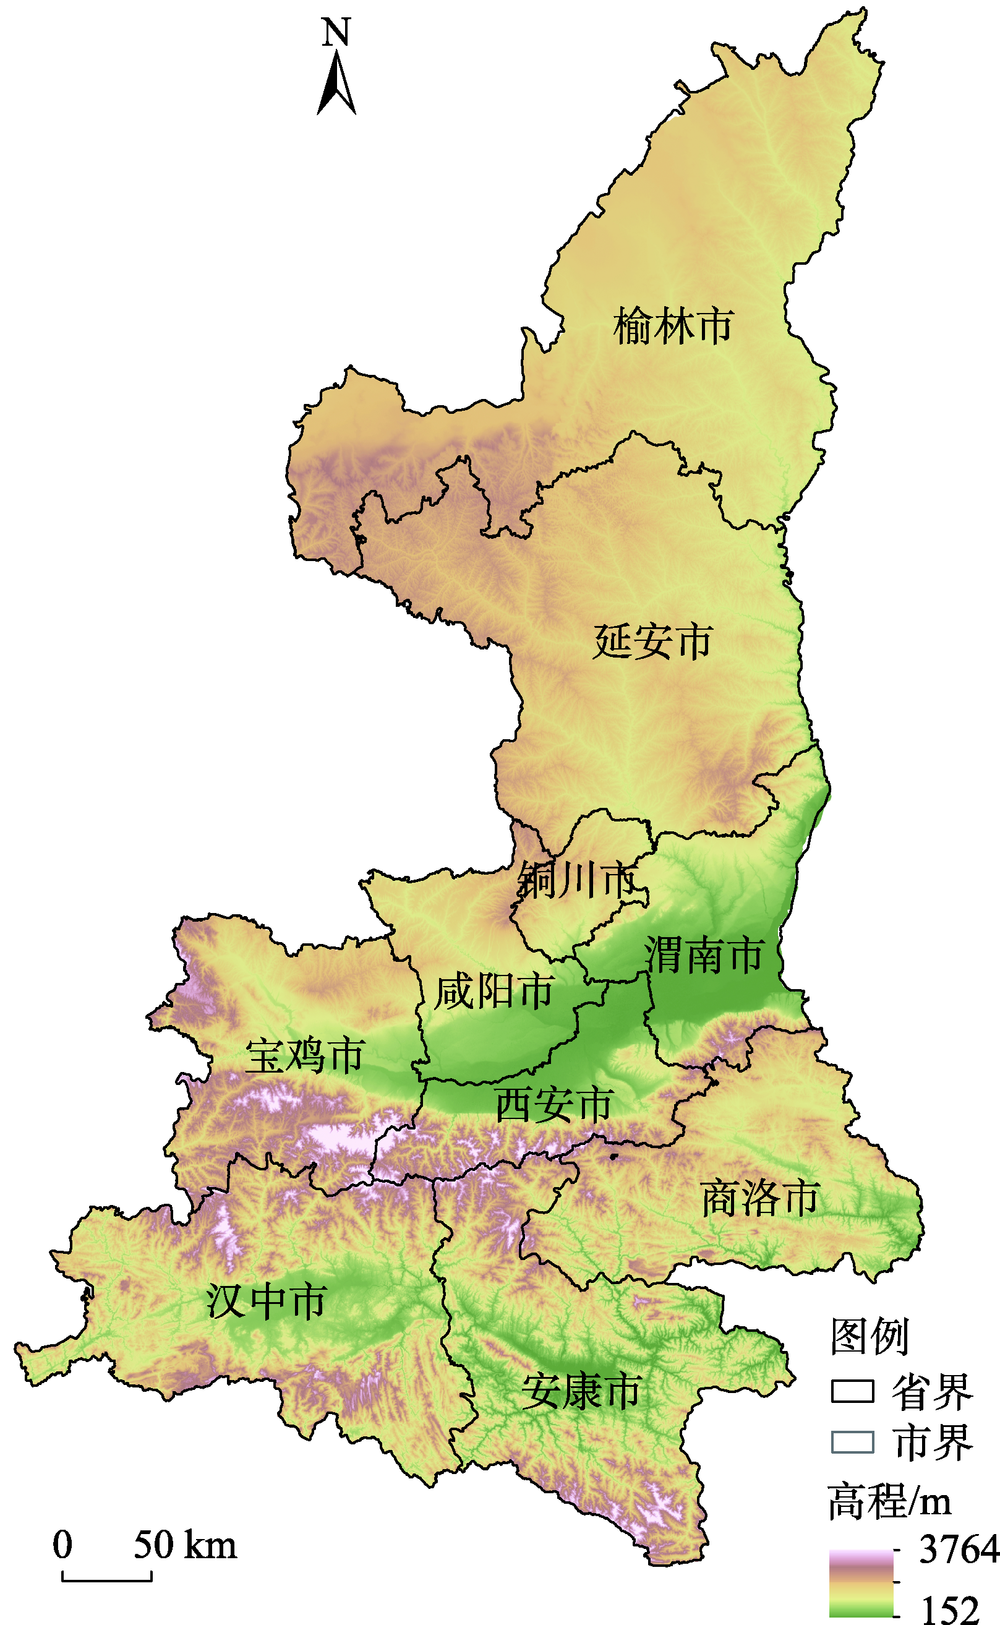
表1
“三生”空间分类体系"
| 一级地类 | 二级地类 | 中国土地利用遥感监测数据二级分类 |
|---|---|---|
| 生态空间 | 绿色生态空间 | 有林地、灌木林、疏林地、高覆盖度草地、中覆盖度草地、低覆盖度草地 |
| 蓝色生态空间 | 河渠、湖泊、水库坑塘、永久性冰川雪地、滩涂、滩地、海洋 | |
| 潜在生态空间 | 沙地、戈壁、盐碱地、沼泽地、裸土地、裸岩石质地、其他 | |
| 生产空间 | 生产生态空间 | 水田、旱地、其他林地 |
| 工矿生产空间 | 其他建设用地 | |
| 生活空间 | 生活生产空间 | 城镇用地 |
| 农村生活空间 | 农村居民点 |
表2
陕西省“三生”空间土地利用动态度变化"
| 年份 | 生产空间 | 生活空间 | 生态空间 |
|---|---|---|---|
| 2000—2005 | -0.3 | 2.2 | 0.1 |
| 2005—2010 | -0.4 | 3.3 | 0.1 |
| 2010—2015 | 0.1 | 1.4 | -0.1 |
| 2015—2020 | -0.2 | -0.7 | 0.1 |
表3
2000—2020年陕西省“三生”空间土地利用转移矩阵"
| 类别 | 2000—2005年 | 2005—2010年 | 2010—2015年 | 2015—2020年 | |||||||||||
|---|---|---|---|---|---|---|---|---|---|---|---|---|---|---|---|
| 生产 空间 | 生活 空间 | 生态 空间 | 生产 空间 | 生活 空间 | 生态 空间 | 生产 空间 | 生活 空间 | 生态 空间 | 生产 空间 | 生活 空间 | 生态 空间 | ||||
| 生产空间 | 70745.3 | 323.2 | 1547.5 | 67727.5 | 612.2 | 3344.3 | 69842.5 | 265.9 | 131.1 | 66821.6 | 264.8 | 3384.7 | |||
| 生活空间 | 9.4 | 3005.7 | 3.8 | 127.9 | 3191.3 | 35.3 | 6.6 | 3895.4 | 1.0 | 340.3 | 3741.2 | 90.1 | |||
| 生态空间 | 928.9 | 25.7 | 129064.0 | 2384.2 | 99.6 | 128132.0 | 625.6 | 10.4 | 130876.0 | 2540.8 | 25.9 | 128418.0 | |||
表4
2000—2020年陕西省“三生”空间二级分类土地利用转移矩阵"
| 类别 | 2000—2005年 | ||||||
|---|---|---|---|---|---|---|---|
| 工矿生产空间 | 蓝色生态空间 | 绿色生态空间 | 农村生活空间 | 潜在生态空间 | 生产生态空间 | 生活生产空间 | |
| 工矿生产空间 | / | 0.0 | 0.4 | 0.1 | 0.0 | 0.2 | 0.0 |
| 蓝色生态空间 | 0.0 | / | 8.8 | 0.4 | 0.3 | 40.4 | 0.2 |
| 绿色生态空间 | 8.0 | 30.6 | / | 14.7 | 67.9 | 849.0 | 9.9 |
| 农村生活空间 | 0.3 | 0.6 | 2.9 | / | 0.0 | 8.6 | 24.3 |
| 潜在生态空间 | 4.0 | 3.1 | 68.2 | 0.3 | / | 27.5 | 0.2 |
| 生产生态空间 | 17.0 | 73.1 | 1467.5 | 245.3 | 6.5 | / | 77.8 |
| 生活生产空间 | 0.0 | 0.0 | 0.3 | 0.5 | - | 0.5 | / |
| 类别 | 2005—2010年 | ||||||
| 工矿生产空间 | 蓝色生态空间 | 绿色生态空间 | 农村生活空间 | 潜在生态空间 | 生产生态空间 | 生活生产空间 | |
| 工矿生产空间 | / | 4.9 | 3.7 | 0.9 | 0.0 | 1.9 | 8.8 |
| 蓝色生态空间 | 2.5 | / | 88.5 | 5.1 | 4.0 | 144.1 | 1.3 |
| 绿色生态空间 | 85.7 | 58.1 | / | 62.8 | 58.1 | 2040.4 | 20.4 |
| 农村生活空间 | 3.2 | 2.3 | 22.8 | / | 0.0 | 118.8 | 14.7 |
| 潜在生态空间 | 46.8 | 11.8 | 157.5 | 7.6 | / | 64.6 | 2.3 |
| 生产生态空间 | 118.2 | 103.3 | 3214.3 | 416.2 | 18.1 | / | 186.2 |
| 生活生产空间 | 0.4 | 0.5 | 9.8 | 7.7 | 0.0 | 5.5 | / |
| 类别 | 2010—2015年 | ||||||
| 工矿生产空间 | 蓝色生态空间 | 绿色生态空间 | 农村生活空间 | 潜在生态空间 | 生产生态空间 | 生活生产空间 | |
| 工矿生产空间 | / | - | 0.7 | 0.6 | 0.4 | 3.2 | 0.2 |
| 蓝色生态空间 | 5.8 | / | 17.6 | 0.4 | 0.6 | 5.5 | 0.1 |
| 绿色生态空间 | 262.2 | 29.9 | / | 6.4 | 110.6 | 180.4 | 3.3 |
| 农村生活空间 | 5.0 | 0.6 | 0.0 | / | 0.1 | 0.1 | 12.4 |
| 潜在生态空间 | 91.8 | 4.1 | 2.6 | 0.2 | / | 79.8 | - |
| 生产生态空间 | 281.9 | 53.0 | 50.7 | 115.1 | 26.4 | / | 150.1 |
| 生活生产空间 | 1.6 | 0.1 | 0.0 | 0.6 | 0.3 | 0.0 | / |
| 类别 | 2015—2020年 | ||||||
| 工矿生产空间 | 蓝色生态空间 | 绿色生态空间 | 农村生活空间 | 潜在生态空间 | 生产生态空间 | 生活生产空间 | |
| 工矿生产空间 | / | 2.9 | 49.9 | 2.4 | 14.8 | 38.4 | 0.7 |
| 蓝色生态空间 | 3.8 | / | 62.1 | 2.8 | 10.9 | 71.1 | 1.0 |
| 绿色生态空间 | 125.5 | 86.5 | / | 18.0 | 128.6 | 2223.1 | 3.7 |
| 农村生活空间 | 4.3 | 4.1 | 61.4 | / | 7.2 | 284.6 | 8.2 |
| 潜在生态空间 | 74.6 | 5.7 | 83.4 | 0.4 | / | 42.6 | 0.0 |
| 生产生态空间 | 105.1 | 128.4 | 3138.6 | 231.5 | 50.1 | / | 30.2 |
| 生活生产空间 | 9.5 | 1.1 | 14.6 | 3.8 | 1.6 | 41.9 | / |
表5
“三生”空间驱动因子"
| 驱动因子 | 衡量内容 | 驱动因子 | 衡量内容 |
|---|---|---|---|
| 年平均气温(X1) | 自然环境 | 第一产业增加值(X8) | 经济发展 |
| 年平均降水量(X2) | 自然环境 | 第二产业增加值(X9) | 经济发展 |
| NDVI(X3) | 自然环境 | 第三产业增加值(X10) | 经济发展 |
| 人口总数(X4) | 城市规模 | 人均GDP(X11) | 经济发展 |
| 人口密度(X5) | 城市规模 | 全社会固定资产投资(X12) | 经济发展 |
| 财政收入(X6) | 城市规模 | 城镇居民可支配收入(X13) | 经济发展 |
| 社会消费品零售总额(X7) | 城市规模 |
图2
因子探测结果 注:X1为年平均气温;X2为年平均降水量;X3为NDVI;X4为人口总数;X5为人口密度;X6为财政收入;X7为社会消费品零售总额;X8为第一产业增加值;X9为第二产业增加值;X10为第三产业增加值;X11为人均GDP;X12为全社会固定资产投资;X13为城镇居民可支配收入。下同。"
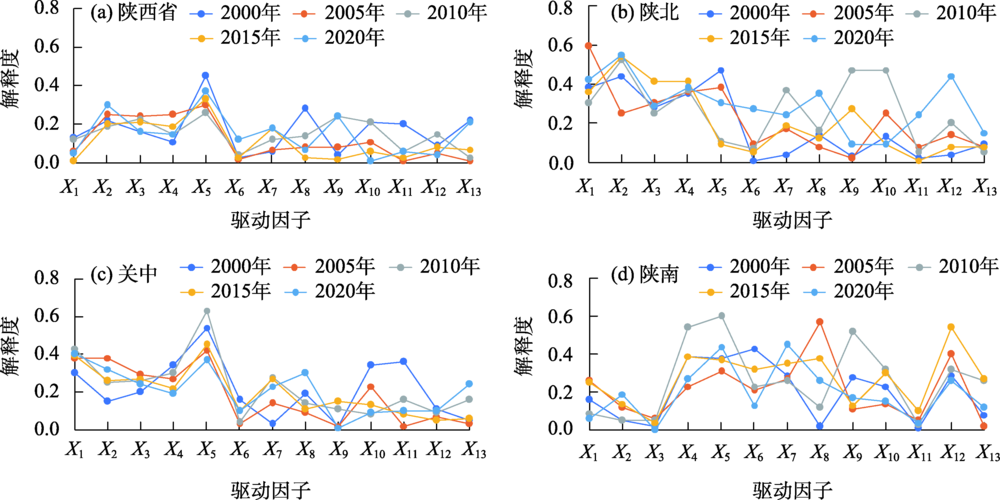
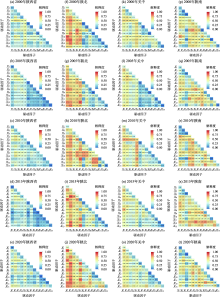
图3
交互探测结果"

| [1] | 陕西省统计局, 国家统计局陕西调查总队. 陕西统计年鉴—2021[J]. 北京: 中国统计出版社, 2021. |
| [Statistics Bureau of Shaanxi Provice, National Bureau of Statistics Survey Office in Shaanxi Province. Shaanxi statistical yearbook: 2021[J]. Beijing: China Statistics Press, 2021.] | |
| [2] | 李涛, 廖和平, 杨伟, 等. 重庆市“土地、人口、产业”城镇化质量的时空分异及耦合协调性[J]. 经济地理, 2015, 35(5): 65-71. |
| [Li Tao, Liao Heping, Yang Wei, et al. Urbanization quality over time and space as well as coupling coordination of land, population and industrialization in Chongqing[J]. Economic Geography, 2015, 35(5): 65-71.] | |
| [3] | 尹宏玲, 徐腾. 我国城市人口城镇化与土地城镇化失调特征及差异研究[J]. 城市规划学刊, 2013(2): 10-15. |
| [Yin Hongling, Xu Teng. The mismatch between population urbanization and land urbanization in China[J]. Urban Planning Forum, 2013(2): 10-15.] | |
| [4] | 黄征学, 覃成林, 李正图, 等. “十四五”时期的区域发展[J]. 区域经济评论, 2019(6): 1-12, 165. |
| [Huang Zhengxue, Qin Chenglin, Li Zhengtu, et al. Regional development during the 14th five-year plan period[J]. Regional Economic Review, 2019(6): 1-12, 165.] | |
| [5] | 范树平, 程从坤, 刘友兆, 等. 中国土地利用/土地覆盖研究综述与展望[J]. 地域研究与开发, 2017, 36(2): 94-101. |
| [Fan Shuping, Cheng Congkun, Liu Youzhao, et al. Review and prospect on land use/cover research in China[J]. Areal Research and Development, 2017, 36(2): 94-101.] | |
| [6] |
周艳, 黄贤金, 徐国良, 等. 长三角城市土地扩张与人口增长耦合态势及其驱动机制[J]. 地理研究, 2016, 35(2): 313-324.
doi: 10.11821/dlyj201602009 |
|
[Zhou Yan, Huang Xianjin, Xu Guoliang, et al. The coupling and driving forces between urban land expansion and population growth in Yangtze River Delta[J]. Geographical Research, 2016, 35(2): 313-324.]
doi: 10.11821/dlyj201602009 |
|
| [7] | 陈婧, 史培军. 土地利用功能分类探讨[J]. 北京师范大学学报(自然科学版), 2005, 41(5): 536-540. |
| [Chen Jing, Shi Peijun. Discussion on functional land use classification system[J]. Journal of Beijing Normal University (Natural Science Editon), 2005, 41(5): 536-540.] | |
| [8] |
李广东, 方创琳. 城市生态-生产-生活空间功能定量识别与分析[J]. 地理学报, 2016, 71(1): 49-65.
doi: 10.11821/dlxb201601004 |
|
[Li Guangdong, Fang Chuanglin. Quantitative function identification and analysis of urban ecological-production-living spaces[J]. Acta Geographica Sinica, 2016, 71(1): 49-65.]
doi: 10.11821/dlxb201601004 |
|
| [9] | 李明薇, 郧雨旱, 陈伟强, 等. 河南省“三生空间”分类与时空格局分析[J]. 中国农业资源与区划, 2018, 39(9): 13-20. |
| [Li Mingwei, Yun Yuhan, Chen Weiqiang, et al. Quantitative function identification and analysis of urban ecological-production-living spaces[J]. Acta Geographica Sinica, 2018, 39(9): 13-20.] | |
| [10] | 陈龙, 周生路, 周兵兵, 等. 基于主导功能的江苏省土地利用转型特征与驱动力[J]. 经济地理, 2015, 35(2): 155-162. |
| [Chen Long, Zhou Shenglu, Zhou Bingbing, et al. Characteristics and driving forces of regional land use transition based on the leading function classification: A case study of Jiangsu Province[J]. Economic Geography, 2015, 35(2): 155-162.] | |
| [11] | 窦睿音, 张生玲, 刘学敏. 中国资源型城市“三生系统”耦合协调时空分异演变及其影响因素分析[J]. 北京师范大学学报(自然科学版), 2021, 57(3): 363-371. |
| [Dou Ruiyin, Zhang Shengling, Liu Xuemin. Spatial and temporal diversity patterns and influencing factors in “production system-life system-ecosystem” coupled coordination in resource-based cities in China[J]. Journal of Beijing Normal University (Natural Science Edition), 2021, 57(3): 363-371.] | |
| [12] | 马彩虹, 安斯文, 文琦, 等. 基于土地利用转移流的国土空间格局演变及其驱动机制研究——以宁夏原州区为例[J]. 干旱区地理, 2022, 45(3): 925-934. |
| [Ma Caihong, An Siwen, Wen Qi, et al. Spatial pattern evolution and its driving mechanism based on land use transfer flow: A case study in Yuanzhou District in Ningxia[J]. Arid Land Geography, 2022, 45(3): 925-934.] | |
| [13] |
孔雪松, 谢世姣, 朱思阳, 等. 湖北省人口-土地-产业城镇化的时空分异与动态耦合分析[J]. 经济地理, 2019, 39(4): 93-100.
doi: 10.2307/142501 |
|
[Kong Xuesong, Xie Shijiao, Zhu Siyang, et al. Spatiotemporal differentiation and dynamic coupling of urbanization of population, land and industry in Hubei Province[J]. Economic Geography, 2019, 39(4): 93-100.]
doi: 10.2307/142501 |
|
| [14] | 刘顺鑫, 黄云. “三生空间”视角下万州区景观生态安全评价及其耦合特征分析[J]. 水土保持研究, 2020, 27(6): 308-316. |
| [Liu Shunxin, Huang Yun. Evaluation and coupling coordination analysis of landscape ecological security of Wanzhou District from the perspective of production-life-ecological space[J]. Research of Soil and Water Conservation, 2020, 27(6): 308-316.] | |
| [15] |
王成, 唐宁. 重庆市乡村三生空间功能耦合协调的时空特征与格局演化[J]. 地理研究, 2018, 37(6): 1100-1114.
doi: 10.11821/dlyj201806004 |
|
[Wang Cheng, Tang Ning. Spatio-temporal characteristics and evolution of rural production-living-ecological space function coupling coordination in Chongqing Municipality[J]. Geographical Research, 2018, 37(6): 1100-1114.]
doi: 10.11821/dlyj201806004 |
|
| [16] |
黄安, 许月卿, 卢龙辉, 等. “生产-生活-生态”空间识别与优化研究进展[J]. 地理科学进展, 2020, 39(3): 503-518.
doi: 10.18306/dlkxjz.2020.03.014 |
|
[Huang An, Xu Yueqin, Lu Longhui, et al. Research progress of the identification and optimization of production-living-ecological spaces[J]. Progress in Geography, 2020, 39(3): 503-518.]
doi: 10.18306/dlkxjz.2020.03.014 |
|
| [17] | 张军涛, 翟婧彤. 我国沿海中心城市“三生空间”耦合-协调度评价及优化策略[J]. 现代城市研究, 2020(7): 2-8. |
| [Zhang Juntao, Zhai Jingtong. Study on the coupling coordination degree of production-living-ecological space in the coastal central cities of China[J]. Modern Urban Research, 2020(7): 2-8.] | |
| [18] |
戴文远, 江方奇, 黄万里, 等. 基于“三生空间”的土地利用功能转型及生态服务价值研究——以福州新区为例[J]. 自然资源学报, 2018, 33(12): 2098-2109.
doi: 10.31497/zrzyxb.20171197 |
|
[Dai Wenyuan, Jiang Fangqi, Huang Wanli, et al. Study on transition of land use function and ecosystem service value based on the conception of production, living and ecological space: A case study of the Fuzhou New Area[J]. Journal of Natural Resources, 2018, 33(12): 2098-2109.]
doi: 10.31497/zrzyxb.20171197 |
|
| [19] | 龚亚男, 韩书成, 时晓标, 等. 广东省“三生空间”用地转型的时空演变及其生态环境效应[J]. 水土保持研究, 2020, 27(3): 203-209. |
| [Gong Ya’nan, Han Shucheng, Shi Xiaobiao, et al. Temporal and spatial evolution and associated eco-environment effects of the land use transformation of ecological-production-living spaces in Guangdong Province[J]. Research of Soil and Water Conservation, 2020, 27(3): 203-209.] | |
| [20] |
杨清可, 段学军, 王磊, 等. 基于“三生空间”的土地利用转型与生态环境效应——以长江三角洲核心区为例[J]. 地理科学, 2018, 38(1): 97-106.
doi: 10.13249/j.cnki.sgs.2018.01.011 |
|
[Yang Qingke, Duan Xuejun, Wang Lei, et al. Land use transformation based on ecological-production-living spaces and associated eco-environment effects: A case study in the Yangtze River Delta[J]. Scientia Geographica Sinica, 2018, 38(1): 97-106.]
doi: 10.13249/j.cnki.sgs.2018.01.011 |
|
| [21] | 程波, 赵阿宁, 张新社. 西安城市地质与可持续发展研究[J]. 西北地质, 2021, 54(4): 259-265. |
| [Cheng Bo, Zhao Aning, Zhang Xinshe. Study on Xi’an City geology and sustainable development[J]. Northwestern Geology, 2021, 54(4): 259-265.] | |
| [22] |
杨晓俊, 方传珊, 侯叶子. 基于生态足迹的西安城市生态游憩空间优化研究[J]. 地理研究, 2018, 37(2): 281-291.
doi: 10.11821/dlyj201802004 |
|
[Yang Xiaojun, Fang Chuanshan, Hou Yezi. Optimization of ecological recreation area in Xi’an City based on ecological footprint[J]. Geographical Research, 2018, 37(2): 281-291.]
doi: 10.11821/dlyj201802004 |
|
| [23] | 贺晓晖. 陕西省“三生空间”土地利用结构分析[J]. 遥感信息, 2021, 36(6): 120-124. |
| [He Xiaohui. Analysis on land use structure of ecological-production-living space in Shaanxi Province[J]. Remote Sensing Information, 2021, 36(6): 120-124.] | |
| [24] | 马琪, 王梓柔, 赵永宏. 西安市“三生空间”时空格局演化与功能测度[J]. 山地学报, 2021, 39(5): 722-733. |
| [Ma Qi, Wang Zirou, Zhao Yonghong. Evolution of spatial-temporal pattern and functional measurement of “production-living-ecologial” space in Xi’an, China[J]. Mountain Reserch, 2021, 39(5): 722-733.] | |
| [25] | 王思雨, 林高瑞. 商洛市中心城区“三生空间”识别及格局分析[C]// 中国城市规划学会. 面向高质量发展的空间治理——2020中国城市规划年会论文集 (20总体规划). 北京: 中国建筑工业出版社, 2021: 527-538. |
| [Wang Siyu, Lin Gaorui. Identification and pattern analysis of “ecological-production-living space” in Shangluo downtown area[C]// Urban Planning Society of China. Space Governance for High-quality Development:2020 Proceedings of China Urban Planning Annual Conference (20 Overall Plan). Beijing: China Architecture & Building Press, 2021: 527-538.] | |
| [26] |
王劲峰, 徐成东. 地理探测器: 原理与展望[J]. 地理学报, 2017, 72(1): 116-134.
doi: 10.11821/dlxb201701010 |
|
[Wang Jinfeng, Xu Chengdong. Geodetector: Principle and prospective[J]. Acta Geographica Sinica, 2017, 72(1): 116-134.]
doi: 10.11821/dlxb201701010 |
|
| [27] | 李晓华, 封建民, 文琦. 陕西省土地利用与景观格局变化特征及驱动力分析[J]. 国土资源科技管理, 2021, 38(1): 107-117. |
| [Li Xiaohua, Feng Jianmin, Wen Qi. On characteristics of land use and landscape pattern change and its driving forces in Shaanxi Province[J]. Scientific and Technological Management of Land and Resources, 2021, 38(1): 107-117.] | |
| [28] |
韩美, 孔祥伦, 李云龙, 等. 黄河三角洲“三生”用地转型的生态环境效应及其空间分异机制[J]. 地理科学, 2021, 41(6): 1009-1018.
doi: 10.13249/j.cnki.sgs.2021.06.010 |
|
[Han Mei, Kong Xianglun, Li Yunlong, et al. Eco-environmental effects and its spatial heterogeneity of “ecological-production-living” land use transformation in the Yellow River Delta[J]. Scientia Geographica Sinica, 2021, 41(6): 1009-1018.]
doi: 10.13249/j.cnki.sgs.2021.06.010 |
|
| [29] |
宋永永, 薛东前, 夏四友, 等. 近40 a黄河流域国土空间格局变化特征与形成机理[J]. 地理研究, 2021, 40(5): 1445-1463.
doi: 10.11821/dlyj020191065 |
|
[Song Yongyong, Xue Dongqian, Xia Siyou, et al. Change characteristics and formation mechanism of the territorial spatial pattern in the Yellow River Basin from 1980 to 2018, China[J]. Geographical Research, 2021, 40(5): 1445-1463.]
doi: 10.11821/dlyj020191065 |
|
| [30] | 王柱莲, 王平, 支林蛟. 环滇池地区2000—2020年“三生”空间格局演变及其驱动力[J]. 水土保持通报, 2021, 41(6): 265-273, 281. |
| [Wang Zhulian, Wang Ping, Zhi Linjiao. Evolution and driving forces of ecological-productive-living space pattern in Dianchi Lake area during 2000—2020[J]. Bulletin of Soil and Water Conservation, 2021, 41(6): 265-273, 281.] |
| [1] | 史维良, 车璐阳, 李涛. 陕西省汛期极端降水概率分布及综合危险性评估[J]. 干旱区地理, 2023, 46(9): 1407-1417. |
| [2] | 张梦圆, 荣丽华, 李伊彤, 党慧. 基于“三生”空间的农牧交错区城市土地利用转型及生态环境效应分析——以包头市为例[J]. 干旱区地理, 2023, 46(6): 958-967. |
| [3] | 丁华,廖文强,段丰浩,杨望暾. 陕西省丹霞地貌景观特征、空间分布与形成机理初探[J]. 干旱区地理, 2023, 46(4): 527-538. |
| [4] | 白洋,谭李娜,陈春燕,李卓远. 城际列车对新疆旅游经济高质量发展的影响效应及驱动机制[J]. 干旱区地理, 2023, 46(4): 658-666. |
| [5] | 马丽娜, 张飞云, 翟玉鑫, 滕伦, 康建国. 1980—2020年新疆土地利用变化下生态系统服务价值时空演变分析[J]. 干旱区地理, 2023, 46(2): 253-263. |
| [6] | 余焕, 雷敏, 马金晶, 李睿. 基于绿色GDP和生态效率的区域可持续发展研究——以陕西省为例[J]. 干旱区地理, 2023, 46(2): 284-293. |
| [7] | 倪红红, 马强, 卜元坤, 杨小轩, 李卫忠. 陕西省林业企业时空格局演变及影响因素分析[J]. 干旱区地理, 2023, 46(12): 2098-2110. |
| [8] | 翟玉鑫, 张飞云, 马丽娜. 基于三生空间的博斯腾湖流域生境质量时空演变及预估[J]. 干旱区地理, 2023, 46(11): 1792-1802. |
| [9] | 陈谢扬, 李同昇, 朱小青, 徐博, 朱炳臣, 李炬霖. 基于实际调查与观测解译对比验证的土地沙漠化敏感性评价——以陕西省为例[J]. 干旱区地理, 2023, 46(11): 1813-1825. |
| [10] | 姜萍, 胡列群, 许婷婷. 近60 a新疆大气水分亏缺的时空变化特征[J]. 干旱区地理, 2023, 46(1): 1-10. |
| [11] | 程静,王鹏,陈红翔,韩永贵. 半干旱区生态风险时空演变及其影响因素的地理探测——以宁夏盐池县为例[J]. 干旱区地理, 2022, 45(5): 1637-1648. |
| [12] | 谷昊鑫,秦伟山,赵明明,孙海燕,王富喜. 黄河流域旅游经济与生态环境协调发展时空演变及影响因素探究[J]. 干旱区地理, 2022, 45(2): 628-638. |
| [13] | 杨振民,刘新平. 新疆阿克苏河流域生态承载力监测及安全格局构建[J]. 干旱区地理, 2021, 44(5): 1489-1499. |
| [14] | 黄越,程静,王鹏. 中国北方农牧交错区生态脆弱性时空演变格局与驱动因素——以盐池县为例[J]. 干旱区地理, 2021, 44(4): 1175-1185. |
| [15] | 同丽嘎,宁小莉,张靖,张雪峰. 近30 a 浑善达克沙地沙漠化时空演变特征及驱动机制研究[J]. 干旱区地理, 2021, 44(4): 992-1002. |
|
||