- 2025年5月13日 星期二
干旱区地理 ›› 2023, Vol. 46 ›› Issue (7): 1039-1051.doi: 10.12118/j.issn.1000-6060.2022.511 cstr: 32274.14.ALG2022511
黄鑫1( ),焦黎1,马晓飞2,王勇辉1(),阿尔曼·阿布拉1
收稿日期:2022-10-09
修回日期:2022-12-29
出版日期:2023-07-25
发布日期:2023-08-03
作者简介:黄鑫(1999-),女,硕士研究生,主要从事干旱区资源利用方面研究. E-mail: 基金资助:
HUANG Xin1(),JIAO Li1,MA Xiaofei2,WANG Yonghui1(),Aerman ABULA1
Received:2022-10-09
Revised:2022-12-29
Published:2023-07-25
Online:2023-08-03
摘要:
选取1960—2020年中亚126个气象站点逐日降水数据,基于RClimDex模型计算中亚8种极端降水指数,利用线性回归分析、Mann-Kendall法分析、相关性分析、小波变换和重标极差(R/S)分析,探究中亚极端降水事件特征。结果表明:(1)近60 a中亚极端降水事件频率和强度均明显增加,表征降水强度(SDII)变化倾向率为0.02 mm·d-1·(10a)-1。极端降水量指数中,强降水量(R95p)、单日最大降水量(Rx1day)、连续5 d最大降水量(Rx5day)、年总降水量(PRCPTOT)的变化倾向率分别为1.93 mm·(10a)-1、0.24 mm·(10a)-1、0.66 mm·(10a)-1和0.73 mm·(10a)-1。在极端降水日指数中,中雨日数(R10)、持续干燥日数(CDD)、持续湿润日数(CWD)变化倾向率分别为0.02 d·(10a)-1、-0.65 d·(10a)-1和0.08 d·(10a)-1。极端降水存在明显的空间差异性和高海拔依赖性,高原和山区附近极端降水事件频发。中亚极端降水周期特征为多峰谱型,具有准5 a短周期振荡、6~9 a中周期振荡和10~15 a长周期振荡。(2)极端降水指数与年总降水量具有良好的相关性,CWD对年总降水的贡献最大;太平洋年代际振荡(PDO)和北大西洋年代际振荡(AMO)对极端降水事件具有明显正相关性。R/S分析表明该地区极端降水特征未来持续可能性较大。研究结果可为中亚极端气候预测、自然环境保护、防灾减灾工作等提供科学依据。
黄鑫, 焦黎, 马晓飞, 王勇辉, 阿尔曼·阿布拉. 基于RClimDex模型的近60 a中亚极端降水事件变化特征[J]. 干旱区地理, 2023, 46(7): 1039-1051.
HUANG Xin, JIAO Li, MA Xiaofei, WANG Yonghui, Aerman ABULA. Change characteristics of extreme precipitation events in Central Asia in recent 60 years based on RClimDex model[J]. Arid Land Geography, 2023, 46(7): 1039-1051.

图1
中亚研究区及气象站点分布示意图 注:该图基于国家测绘地理信息局标准地图服务网站下载的审图号为GS(2019)3333号的标准地图制作,底图边界无修改。下同。"
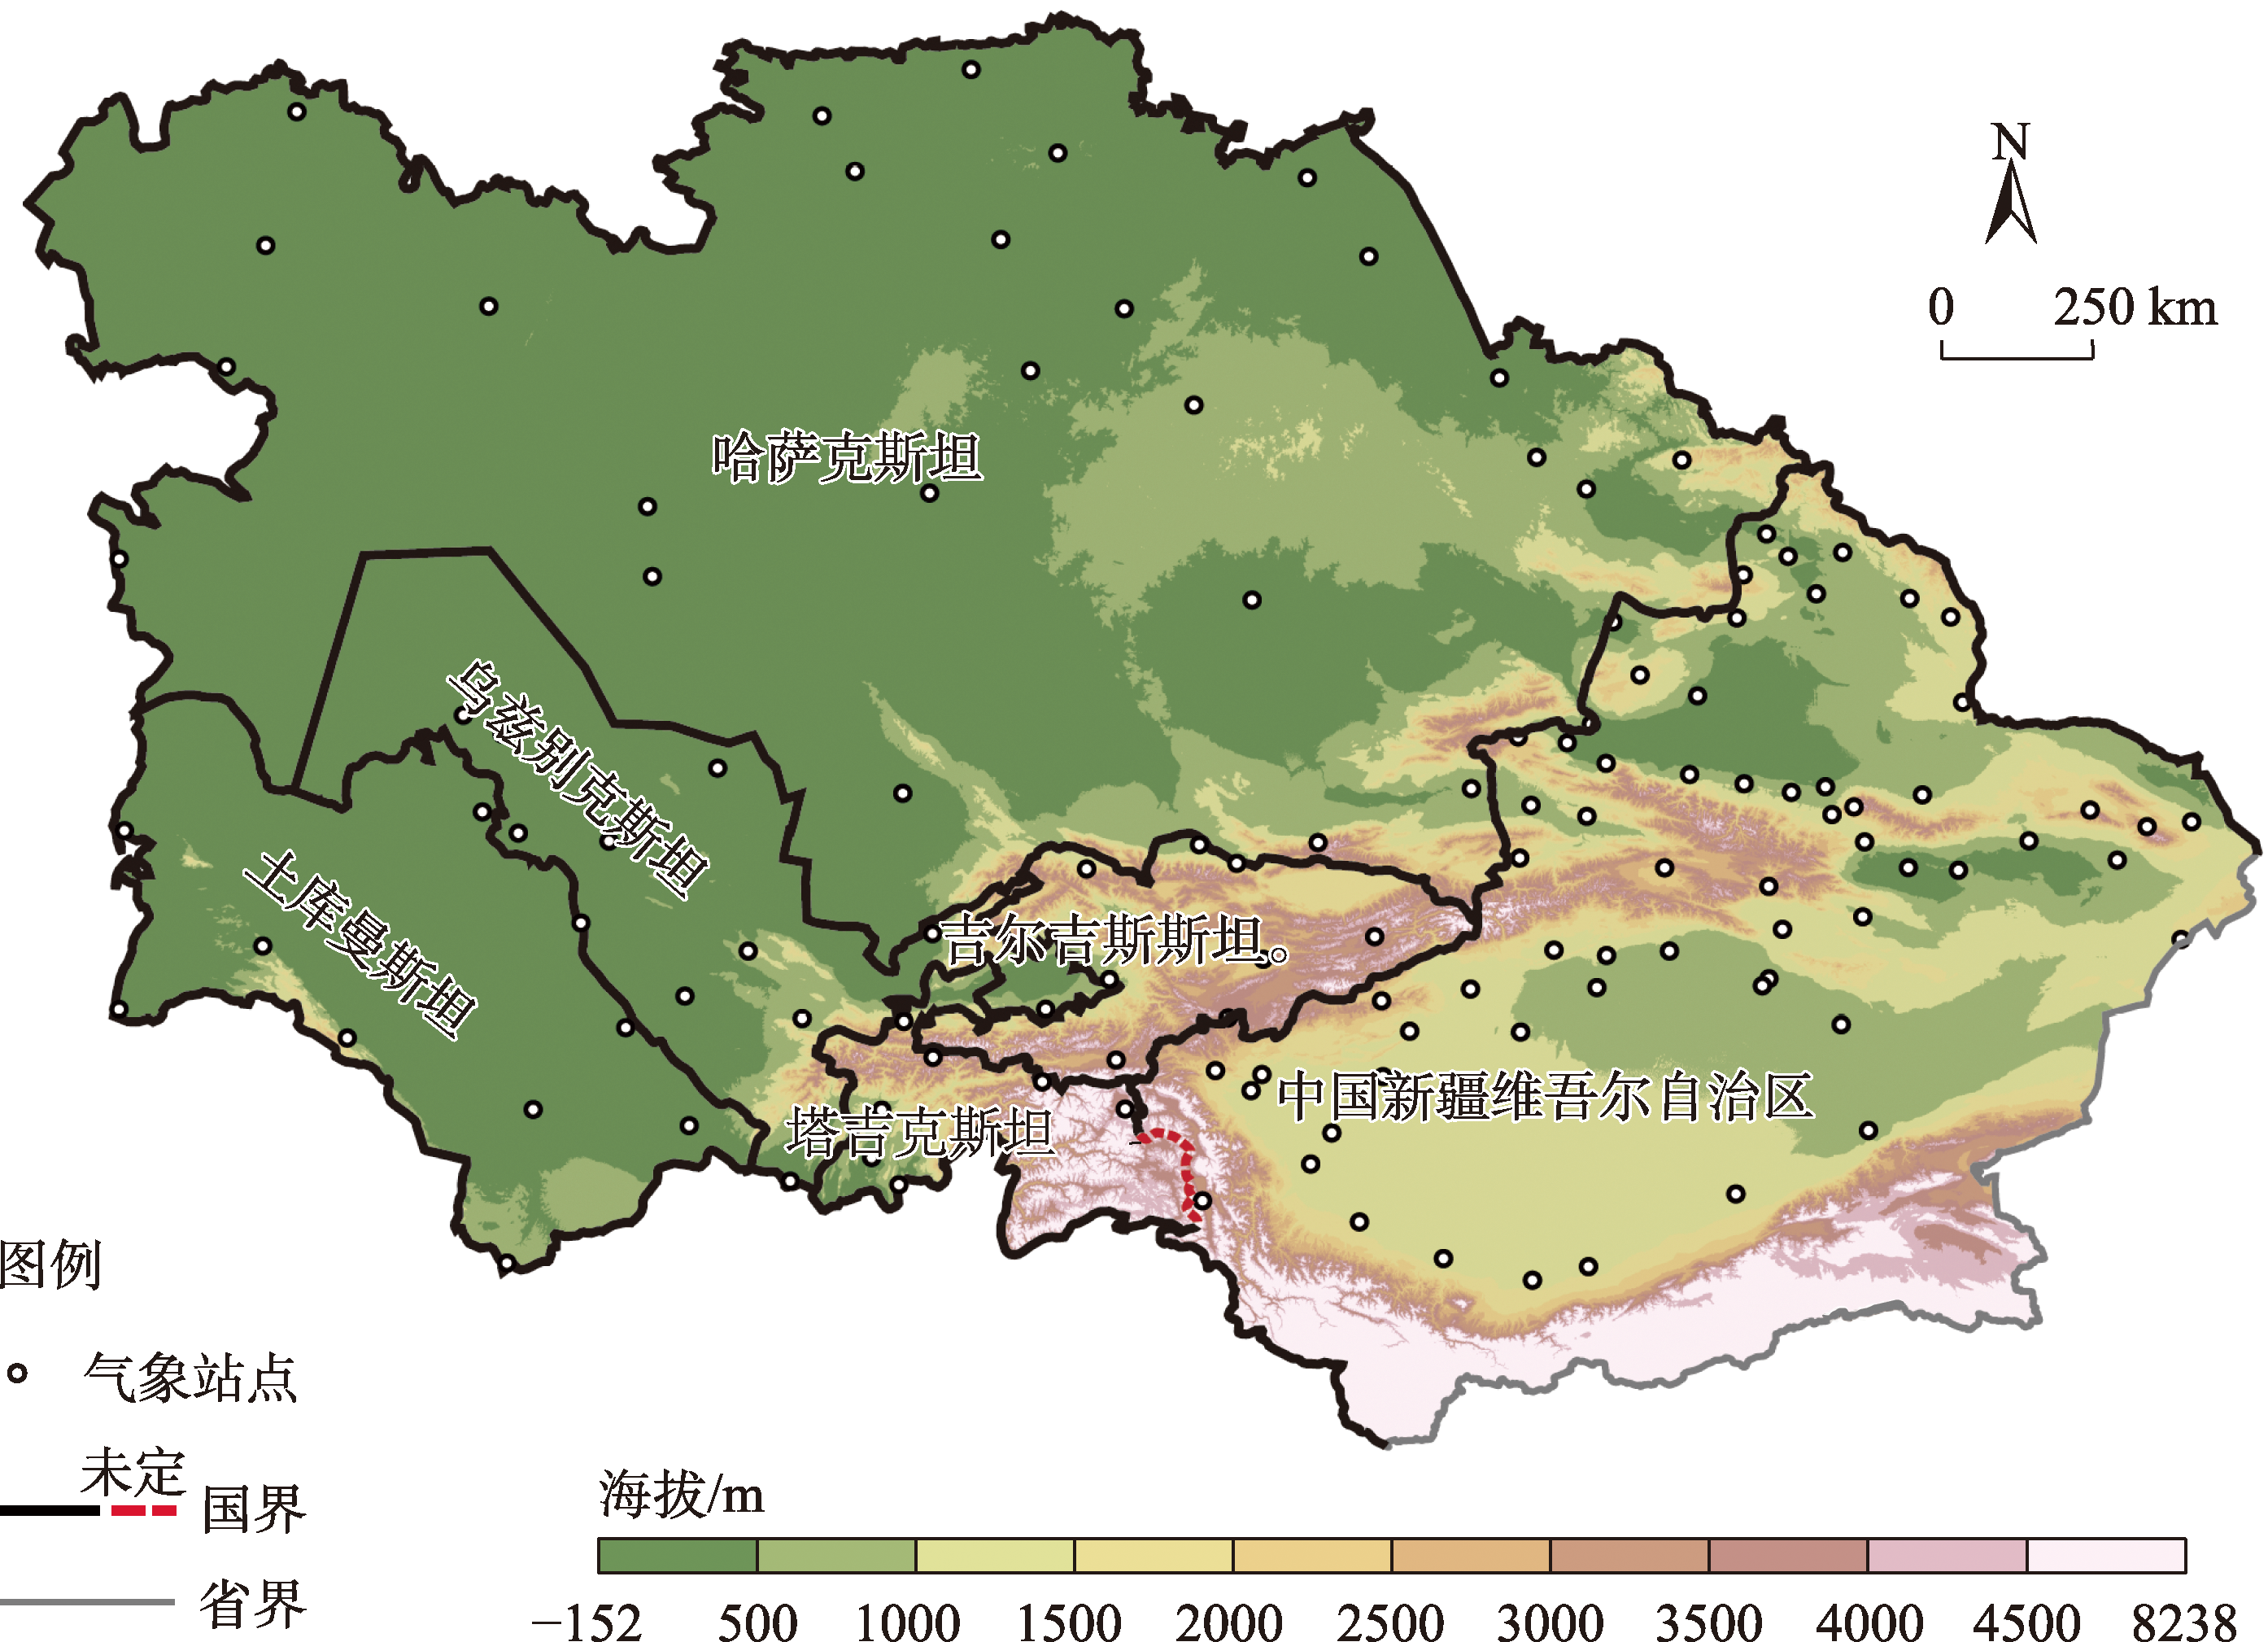
表1
极端降水指数定义"
| 类别 | 分类 | 名称 | 定义 | 代码 |
|---|---|---|---|---|
| 极端降水指数 | 降水量指数 | 年总降水量/mm | 日降水量≥1 mm的降水总量 | PRCPTOT |
| 连续5 d最大降水量/mm | 连续5 d最大降水量 | Rx5day | ||
| 强降水量/mm | 日降水量>95%分位值的累积降水量 | R95p | ||
| 降水强度/mm·d-1 | 单日降水量≥1 mm的总量与总天数之比 | SDII | ||
| 单日最大降水量/mm | 每月最大单日降水量 | Rx1day | ||
| 降水日指数 | 持续干燥日数/d | 日降水量<1 mm的最长连续天数 | CDD | |
| 持续湿润日数/d | 日降水量≥1 mm的最长连续天数 | CWD | ||
| 中雨日数/d | 每年日降水量≥10 mm的总天数 | R10 |
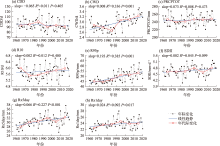
图2
1960—2020年中亚极端降水指数线性趋势 注:slope为各极端降水指数线性倾向率;R2为决定系数;CDD、CWD、PRCPTOT、R10、R95p、SDII、Rx5day、Rx1day分别为持续干燥日数、持续湿润日数、年总降水量、中雨日数、强降水量、降水强度、连续5 d最大降水量、单日最大降水量。下同。"

表2
中亚极端降水指数年代际变化"
| 年代 | PRCPTOT/mm | SDII/mm·d-1 | Rx5day/mm | Rx1day/mm | R95p/mm | R10/d | CWD/d | CDD/d |
|---|---|---|---|---|---|---|---|---|
| 20世纪60年代 | 246.631 | 4.620 | 28.043 | 22.541 | 45.020 | 6.004 | 2.874 | 93.503 |
| 20世纪70年代 | 239.754 | 4.621 | 30.115 | 23.531 | 44.682 | 5.521 | 2.802 | 95.370 |
| 20世纪80年代 | 319.963 | 4.642 | 30.464 | 23.692 | 46.821 | 5.552 | 2.661 | 100.741 |
| 20世纪90年代 | 246.882 | 4.802 | 32.046 | 24.581 | 51.216 | 5.730 | 3.080 | 90.642 |
| 21世纪初 | 269.637 | 4.583 | 30.353 | 23.870 | 51.656 | 5.854 | 3.101 | 93.623 |
| 21世纪10年代 | 248.254 | 4.810 | 32.350 | 24.000 | 53.817 | 5.973 | 3.243 | 91.131 |
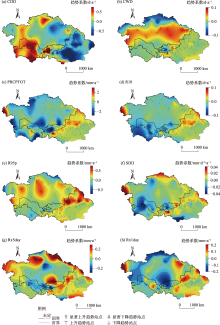
图3
中亚极端降水趋势系数空间特征"

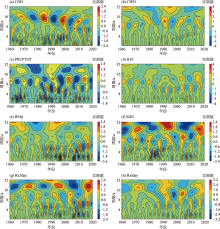
图4
1960—2020年中亚极端降水事件的小波分析"

表3
1960—2020年极端降水指数与大气指数和年总降水量的相关性分析"
| 指数 | 相关系数(r) | |||||||
|---|---|---|---|---|---|---|---|---|
| CDD | CWD | PRCPTOT | R10 | R95p | SDII | Rx5day | Rx1day | |
| AO | 0.117 | 0.141 | -0.094 | -0.269* | 0.016 | -0.033 | 0.068 | 0.019 |
| AMO | -0.294* | 0.607** | 0.032 | 0.432** | 0.528** | 0.212 | 0.219 | 0.065 |
| NAO | 0.072 | 0.061 | 0.004 | -0.129 | 0.031 | 0.142 | 0.194 | 0.171 |
| PDO | -0.100 | 0.102 | 0.297* | 0.235 | 0.329** | 0.426** | 0.520** | 0.511** |
| SOI | 0.089 | -0.098 | -0.132 | -0.203 | -0.122 | -0.199 | -0.244 | -0.330** |
| EA | 0.156 | -0.408** | -0.112 | -0.186 | -0.434** | -0.195 | -0.308* | -0.117 |
| ONI | -0.113 | 0.097 | 0.108 | 0.297* | 0.089 | 0.166 | 0.183 | 0.238 |
| PRCPTOT | -0.131 | 0.601** | - | 0.192 | 0.265* | 0.357** | 0.313* | 0.331** |
表4
极端降水事件变化的Hurst指数和分形维数(D)"
| 指数 | CDD | CWD | PRCPTOT | R10 | R95p | SDII | Rx5day | Rx1day |
|---|---|---|---|---|---|---|---|---|
| Hurst | 0.564 | 0.993 | 0.707 | 0.772 | 0.989 | 0.679 | 0.843 | 0.763 |
| D | 1.436 | 1.007 | 1.293 | 1.228 | 1.011 | 1.321 | 1.157 | 1.237 |
| [1] | 田亚林. 中亚地区极端降水时空分布及重现期分析[D]. 兰州: 兰州交通大学, 2020. |
| [Tian Yalin. Research on temporal-spatial variations of extreme precipitation in Central Asia and its return period[D]. Lanzhou: Lanzhou Jiaotong University, 2020.] | |
| [2] |
Alexander L V, Zhang X, Peterson T C, et al. Global observed changes in daily climate extremes of temperature and precipitation[J]. Journal of Geophysical Research Atmospheres, 2006, 111(D5): D05109, doi: 10.1029/2005JD006290.
doi: 10.1029/2005JD006290 |
| [3] |
Zhang Q, Li J, Singh V P, et al. Spatio-temporal relations between temperature and precipitation regimes: Implications for temperature-induced changes in the hydrological cycle[J]. Global and Planetary Change, 2013, 111: 57-76.
doi: 10.1016/j.gloplacha.2013.08.012 |
| [4] | 韩振宇, 陆波, 石英, 等. IPCC AR6报告关于气候变化影响和风险主要结论的解读[J]. 气候变化研究(自然科学版), 2022, 18(4): 389-394. |
| [Han Zhenyu, Lu Bo, Shi Ying, et al. Interpretation of the IPCC AR6 on the impacts and risks of climate change[J]. Climate Change Research (Natural Science Edition), 2022, 18(4): 389-394.] | |
| [5] |
Zhou T. New physical science behind climate change: What does IPCC AR6 tell us?[J]. Innovation (Camb), 2021, 2(4): 100173, doi: 10.1016/j.xinn.2021.100173.
doi: 10.1016/j.xinn.2021.100173 |
| [6] |
Zarekarizi M, Rana A, Moradkhani H. Precipitation extremes and their relation to climatic indices in the Pacific northwest USA[J]. Climate Dynamics, 2018, 50(11-12), doi: 10.1007/s00382-017-3888-2.
doi: 10.1007/s00382-017-3888-2 |
| [7] |
顾西辉, 张强, 张生. 1961—2010年中国农业洪旱灾害时空特征成因及影响[J]. 地理科学, 2016, 36(3): 439-447.
doi: 10.13249/j.cnki.sgs.2016.03.016 |
|
[Gu Xihui, Zhang Qiang, Zhang Sheng. Spatio-temporal properties of flood/drought hazards and possible causes and impacts in 1961—2010[J]. Earth Science, 2016, 36(3): 439-447.]
doi: 10.13249/j.cnki.sgs.2016.03.016 |
|
| [8] |
Katz R W, Brown B G. Extreme events in a changing climate: Variability is more important than averages[J]. Climatic Change, 1992, 21(3): 289-302.
doi: 10.1007/BF00139728 |
| [9] |
Stone D A, Weaver A J, Zwiers F W. Trends in Canadian precipitation intensity[J]. Atmosphere-Ocean, 2000, 38(2): 321-347.
doi: 10.1080/07055900.2000.9649651 |
| [10] |
Aguilar E, Peterson T C, Obando P R, et al. Changes in precipitation and temperature extremes in Central America and northern South America, 1961—2003[J]. Journal of Geophysical Research Atmospheres: JGR, 2005, 110(D23): D23107, doi: 10.1029/2005JD006119.
doi: 10.1029/2005JD006119 |
| [11] | 戴声佩, 罗红霞, 李茂芬, 等. 1959—2016年华南地区极端降水事件变化特征[J]. 中国农业资源与区划, 2022, 43(3): 128-142. |
| [Dai Shengpei, Luo Hongxia, Li Maofen, et al. Extreme precipitation events variations in southern China from 1959 to 2016[J]. Chinese Journal of Agricultural Resources and Regional Planning, 2022, 43(3): 128-142.] | |
| [12] | 何慧, 陆虹, 陈思蓉. 1961—2010年华南极端降水日数的时空变化特征[J]. 安徽农业科学, 2012, 40(12): 7256-7259, 7276. |
| [He Hui, Lu Hong, Chen Sirong. Temporal-spatial variation characteristics of the extreme precipitation days over south China from 1961 to 2010[J]. Journal of Anhui Agricultural Sciences, 2012, 40(12): 7256-7259, 7276.] | |
| [13] |
李志, 郑粉莉, 刘文兆. 1961—2007年黄土高原极端降水事件的时空变化分析[J]. 自然资源学报, 2010, 25(2): 291-299.
doi: 10.11849/zrzyxb.2010.02.013 |
|
[Li Zhi, Zheng Fenli, Liu Wenzhao. Analyzing the spatial-temporal changes of extreme precipitation events in the Loess Plateau from 1961 to 2007[J]. Journal of Natural Resources, 2010, 25(2): 291-299.]
doi: 10.11849/zrzyxb.2010.02.013 |
|
| [14] | 王少平, 姜逢清, 吴小波, 等. 1961—2010年西北干旱区极端降水指数的时空变化分析[J]. 冰川冻土, 2014, 36(2): 318-326. |
| [Wang Shaoping, Jiang Fengqing, Wu Xiaobo, et al. Temporal and spatial variability of the extreme precipitation indices over the arid regions in northwest China from 1961 to 2010[J]. Journal of Glaciology and Geocryology, 2014, 36(2): 318-326.] | |
| [15] |
马伟东, 刘峰贵, 周强, 等. 1961—2017年青藏高原极端降水特征分析[J]. 自然资源学报, 2020, 35(12): 3039-3050.
doi: 10.31497/zrzyxb.20201218 |
|
[Ma Weidong, Liu Fenggui, Zhou Qiang, et al. Characteristics of extreme precipitation over the Qinghai-Tibet Plateau from 1961 to 2017[J]. Journal of Natural Resources, 2020, 35(12): 3039-3050.]
doi: 10.31497/zrzyxb.20201218 |
|
| [16] |
Lioubimtseva E, Henebry C M. Climate and environmental change in arid Central Asia: Impacts, vulnerability, and adaptations[J]. Journal of Arid Environments, 2009, 73(11): 963-977.
doi: 10.1016/j.jaridenv.2009.04.022 |
| [17] |
Li Z, Chen Y N, Fang G H, et al. Multivariate assessment and attribution of droughts in Central Asia[J]. Scientific Reports, 2017, 7(1): 1316, doi: 10.1038/s41598-017-01473-1.
doi: 10.1038/s41598-017-01473-1 pmid: 28465559 |
| [18] |
Schiemann R, Lüthi D, Vidale P L, et al. The precipitation climate of Central Asia[J]. International Journal of Climatology, 2008, 28(3): 295-314.
doi: 10.1002/(ISSN)1097-0088 |
| [19] |
Aizen E M, Aizen V B, Melack J M, et al. Precipitation and atmospheric circulation patterns at mid-latitudes of Asia[J]. International Journal of Climatology, 2001, 21(5): 535-556.
doi: 10.1002/(ISSN)1097-0088 |
| [20] |
Bothe O, Fraedrich K, Zhu X H. Precipitation climate of Central Asia and the large-scale atmospheric circulation[J]. Theoretical and Applied Climatology, 2012, 108(3-4): 345-354.
doi: 10.1007/s00704-011-0537-2 |
| [21] |
Dong W H, Lin Y L, Wright J S, et al. Summer rainfall over the southwestern Tibetan Plateau controlled by deep convection over the Indian subcontinent[J]. Science Foundation in China, 2016, 7: 10925, doi: 10.1038/ncomms10925.
doi: 10.1038/ncomms10925 |
| [22] | 韩云环, 马柱国, 杨庆, 等. 增暖背景下新疆昼夜降水的变化特征[J]. 气候与环境研究, 2014(6): 763-772. |
| [Han Yunhuan, Ma Zhuguo, Yang Qing, et al. Characteristics of diurnal precipitation in Xinjiang under warming background[J]. Climatic and Environmental Research, 2014(6): 763-772.] | |
| [23] | 刘晶, 周玉淑, 杨莲梅, 等. 伊犁河谷一次极端强降水事件水汽特征分析[J]. 大气科学, 2019, 43(5): 959-974. |
| [Liu Jing, Zhou Yushu, Yang Lianmei, et al. A diagnostic study of water vapor during an extreme precipitation event in the Yili River valley[J]. Atmospheric Sciences, 2019, 43(5): 959-974.] | |
| [24] | 谢泽明, 周玉淑, 杨莲梅. 新疆降水研究进展综述[J]. 暴雨灾害, 2018, 37(3): 204-212. |
| [Xie Zeming, Zhou Yushu, Yang Lianmei. Review of study on precipitation in Xinjiang[J]. Rainstorm Disaster, 2018, 37(3): 204-212.] | |
| [25] |
Hu Z Y, Zhou Q M, Chen X, et al. Variations and changes of annual precipitation in Central Asia over the last century[J]. International Journal of Climatology, 2017, 37: 157-170.
doi: 10.1002/joc.2017.37.issue-S1 |
| [26] |
Zhang M, Chen Y N, Shen Y J, et al. Changes of precipitation extremes in arid Central Asia[J]. Quaternary International, 2017, 436: 16-27.
doi: 10.1016/j.quaint.2016.12.024 |
| [27] |
Wang H J, Chen Y N, Chen Z S, et al. Spatial distribution and temporal trends of mean precipitation and extremes in the arid region, northwest of China, during 1960—2010[J]. Hydrological Processes, 2013, 27(12): 1807-1818.
doi: 10.1002/hyp.v27.12 |
| [28] | 常石巧. 中亚干旱区极端降水事件的水汽来源及物理机制初探[D]. 兰州: 兰州大学, 2019. |
| [Chang Shiqiao. Preliminary study on moisture sources and physical mechanism of extreme precipitation events in the arid Central Asia[D]. Lanzhou: Lanzhou University, 2019.] | |
| [29] | 张曼. 中亚地区气候极值时空变化特征及影响因素研究[D]. 北京: 中国科学院大学, 2018. |
| [Zhang Man. Analysis of the characteristics on spatial-temporal variabilities and influence factors of climate extremes in Central Asia[D]. Beijing: University of Chinese Academy of Sciences, 2018.] | |
| [30] | 陆晴, 刘根林, 闫冰, 等. 气候变暖背景下中亚地区极端降水事件变化及其对植被覆盖的影响[J]. 水土保持研究, 2021, 28(4): 226-235, 243. |
| [Lu Qing, Liu Genlin, Yan Bing, et al. Variation of extreme precipitation events and their impacts on vegetation coverage in Central Asia under climate warming[J]. Research of Soil and Water Conservation, 2021, 28(4): 226-235, 243.] | |
| [31] | 江洁. 中亚降水长期变化分析和归因研究[D]. 北京: 中国科学院大学, 2021. |
| [Jiang Jie. Analysis and attribution of long-term precipitation change in Central Asia[D]. Beijing: University of Chinese Academy of Sciences, 2021.] | |
| [32] | 姚俊强, 曾勇, 李建刚, 等. 中亚区域干湿及极端降水研究综述[J]. 气象科技进展, 2020, 10(4): 7-14. |
| [Yao Junqiang, Zeng Yong, Li Jiangang, et al. A review of dry-wet climate change and extreme precipitation in Central Asia[J]. Advances in Meteorological Science and Technology, 2020, 10(4): 7-14.] | |
| [33] | 陈昌春, 张余庆, 王腊春, 等. 基于RClimDex模型的江西省极端降水时空变化研究[J]. 中国农村水利水电, 2013(11): 41-45. |
| [Chen Changchun, Zhang Yuqing, Wang Lachun, et al. Research on the change of extreme precipitation in Jiangxi Province based on RClimDex model[J]. China Rural Water and Hydropower, 2013(11): 41-45.] | |
| [34] | 高丹阳, 游如玥, 朱虹, 等. 基于RClimDex模型的四川省极端降水时空变化特征分析[J]. 水电能源科学, 2021, 39(8): 10-13. |
| [Gao Danyang, You Ruyue, Zhu Hong, et al. Spatiotemporal variation characteristics of extreme precipitation in Sichuan Province based on RClimDex model[J]. Water Resources and Power, 2021, 39(8): 10-13.] | |
| [35] | 黎晓东, 王永强, 刘万, 等. 三江源典型地区1967—2019年降水时空演变特征[J]. 长江科学院院报, 2022, 39(1): 16-22. |
| [Li Xiaodong, Wang Yongqiang, Liu Wan, et al. Temporal and spatial evolution characteristics of precipitation in typical areas at the source of three rivers from 1967 to 2019[J]. Journal of Yangtze River Scientific Research Institute, 2022, 39(1): 16-22.] | |
| [36] |
魏军, 李婷, 胡会芳, 等. 基于RClimDex模型的石家庄市极端降水时空变化特征[J]. 干旱气象, 2016, 34(4): 623-630.
doi: 10.11755/j.issn.1006-7639(2016)-04-0623 |
|
[Wei Jun, Li Ting, Hu Huifang, et al. Temporal and spatial variation characteristics of extreme precipitation based on RClimDex model in Shijiazhuang during 1972—2014[J]. Journal of Arid Meteorology, 2016, 34(4): 623-630.]
doi: 10.11755/j.issn.1006-7639(2016)-04-0623 |
|
| [37] | 王兴梅, 张勃, 戴声佩, 等. 甘肃省黄土高原区夏季极端降水的时空特征[J]. 中国沙漠, 2011, 31(1): 223-229. |
| [Wang Xingmei, Zhang Bo, Dai Shengpei, et al. Spatial and temporal characteristics of summer extreme precipitation in Loess Plateau of Gansu Province China[J]. Journal of Desert Research, 2011, 31(1): 223-229.] | |
| [38] | 张秀娟, 李传浩, 卜庆雷, 等. 1961年—2016年鲁中地区极端降水时空变化特征及与ENSO关系研究[J]. 环境科学与管理, 2022, 47(3): 67-72. |
| [Zhang Xiujuan, Li Chuanhao, Bu Qinglei, et al. Spatial-temporal variation characteristics of extreme precipitation and its relationship with ENSO in central Shandong from 1961 to 2016[J]. Environmental Science and Management, 2022, 47(3): 67-72.] | |
| [39] | 白宇轩, 杜军, 王挺, 等. 1971—2020年藏东南极端降水指数的时空变化特征[J]. 高原山地气象研究, 2022, 42(3): 31-40. |
| [Bai Yuxuan, Du Jun, Wang Ting, et al. Spatio-temporal change of extreme precipitation index of southeastern Tibet from 1971 to 2020[J]. Plateau and Mountain Meteorology Research, 2022, 42(3): 31-40.] | |
| [40] |
潘雅婧, 王仰麟, 彭建, 等. 基于小波与R/S方法的汉江中下游流域降水量时间序列分析[J]. 地理研究, 2012, 31(5): 811-820.
doi: 10.11821/yj2012050005 |
|
[Pan Yajing, Wang Yanglin, Peng Jian, et al. Precipitation change in middle and lower reaches of Hanjiang River: Based on wavelet analysis and R/S analysis[J]. Geographical Research, 2012, 31(5): 811-820.]
doi: 10.11821/yj2012050005 |
|
| [41] | 黄勇, 周志芳, 王锦国, 等. R/S分析法在地下水动态分析中的应用[J]. 河海大学学报, 2002, 30(1): 83-87. |
| [Huang Yong, Zhou Zhifang, Wang Jinguo, et al. Application of R/S method to dynamic groundwater analysis[J]. Journal of Hohai University, 2002, 30(1): 83-87.] | |
| [42] | 于延胜, 陈兴伟. R/S和Mann-Kendall法综合分析水文时间序列未来的趋势特征[J]. 水资源与水工程学报, 2008(3): 41-44. |
| [Yu Yansheng, Chen Xingwei. Analysis of future trend characteristics of hydrological time series based on R/S and Mann-Kendall methods[J]. Journal of Water Resources and Water Engineering, 2008(3): 41-44.] | |
| [43] | 陈昭, 梁静溪. 赫斯特指数的分析与应用[J]. 中国软科学, 2005(3): 134-138. |
| [Chen Zhao, Liang Jingxi. The analysis and application of Hurst exponent[J]. China Soft Science, 2005(3): 134-138.] | |
| [44] |
Zhou Y K. Characterizing the spatio-temporal dynamics and variability in climate extremes over the Tibetan Plateau during 1960—2012[J]. Journal of Resources and Ecology, 2019, 10(4): 397-414.
doi: 10.5814/j.issn.1674-764x.2019.04.007 |
| [45] |
Liu Y R, Liu Y P, Yang X, et al. Development of an integrated multivariate trend-frequency analysis method: Spatial-temporal characteristics of climate extremes under global warming for Central Asia[J]. Environmental Research, 2021, 195: 110859, doi: 10.1016/j.envres.2021.110859.
doi: 10.1016/j.envres.2021.110859 |
| [46] | 陈亚宁, 李稚, 方功焕. 中亚天山地区关键水文要素变化与水循环研究进展[J]. 干旱区地理, 2022, 45(1): 1-8. |
| [Chen Yaning, Li Zhi, Fang Gonghuan. Changes of key hydrological elements and research progress of water cycle in the Tianshan Mountains, Central Asia[J]. Arid Land Geography, 2022, 45(1): 1-8.] | |
| [47] | 高洁, 赵勇, 姚俊强, 等. 气候变化背景下中亚干旱区大气水分循环要素时空演变[J]. 干旱区研究, 2022, 39(5): 1371-1384. |
| [Gao Jie, Zhao Yong, Yao Junqiang, et al. Spatiotemporal evolution of atmospheric water cycle factors in arid regions of Central Asia under climate change[J]. Arid Zone Research, 2022, 39(5): 1371-1384.] | |
| [48] |
李奇虎, 马庆勋. 1960—2010年西北干旱区极端降水特征研究[J]. 地理科学, 2014, 34(9): 1134-1138.
doi: 10.13249/j.cnki.sgs.2014.09.1134 |
|
[Li Qihu, Ma Qingxun. Extreme pecipitation features of arid regions in northwest of China[J]. Geographic Science, 2014, 34(9): 1134-1138.]
doi: 10.13249/j.cnki.sgs.2014.09.1134 |
|
| [49] | 闫炎, 赵昕奕, 周力平. 近50年中国西北地区干湿演变的时空特征及其可能成因探讨[J]. 干旱区资源与环境, 2010, 24(4): 38-44. |
| [Yan Yan, Zhao Xinyi, Zhou Liping. The temporal and spatial characteristics of aridity and wetness variation in northwest China during recent 50 years and the factor analysis[J]. Journal of Arid Land Resources and Environment, 2010, 24(4): 38-44.] | |
| [50] | 戴新刚, 汪萍, 张凯静. 近60年新疆降水趋势与波动机制分析[J]. 物理学报, 2013, 62(12): 1-11. |
| [Dai Xingang, Wang Ping, Zhang Kaijing. A study on precipitation trend and fluctuation mechanism in northwestern China over the past 60 years[J]. Acta Physica Sinica, 2013, 62(12): 1-11.] | |
| [51] | 杨莲梅, 关学锋, 张迎新. 亚洲中部干旱区降水异常的大气环流特征[J]. 干旱区研究, 2018, 35(2): 249-259. |
| [Yang Lianmei, Guan Xuefeng, Zhang Yingxin. Atmospheric circulation characteristics of precipitation anomaly in arid regions in Central Asia[J]. Arid Zone Research, 2018, 35(2): 249-259.] | |
| [52] |
Huang W, Chen J H, Zhang X J, et al. Definition of the core zone of the “westerlies-dominated climatic regime”, and its controlling factors during the instrumental period[J]. Science China (Earth Sciences), 2015, 58(5): 676-684.
doi: 10.1007/s11430-015-5057-y |
| [53] | Feng S, Hu Q. How the North Atlantic multidecadal oscillation may have influenced the Indian summer monsoon during the past two millennia[J]. Geophysical Research Letters, 2008, 35(1): 548-562. |
| [54] |
Wei H, Chen F H, Feng S, et al. Interannual precipitation variations in the mid-latitude Asia and their association with large-scale atmospheric circulation[J]. Chinese Science Bulletin, 2013, 58(1): 3962-3968.
doi: 10.1007/s11434-013-5970-4 |
| [55] |
Wei W, Zhang R H, Wen M, et al. Impact of Indian summer monsoon on the South Asian High and its influence on summer rainfall over China[J]. Climate Dynamics, 2014, 43(5-6): 1257-1269.
doi: 10.1007/s00382-013-1938-y |
| [56] |
Jiang J, Zhou T, Chen X, et al. Central Asian precipitation shaped by the tropical Pacific decadal variability and the Atlantic multidecadal variability[J]. Journal of Climate, 2021, 34(18): 7541-7553.
doi: 10.1175/JCLI-D-20-0905.1 |
| [57] |
Peng D D, Zhou T J, Zhang L X, et al. Detecting human influence on the temperature changes in Central Asia[J]. Climate Dynamics, 2019, 53: 4553-4568.
doi: 10.1007/s00382-019-04804-2 |
| [58] |
张强, 韩永翔, 宋连春. 全球气候变化及其影响因素研究进展综述[J]. 地球科学进展, 2005, 20(9): 990-998.
doi: 10.11867/j.issn.1001-8166.2005.09.0990 |
|
[Zhang Qiang, Han Yongxiang, Song Lianchun. The summarize of development of global climate change and its effect factors[J]. Advances in Earth Science, 2005, 20(9): 990-998.]
doi: 10.11867/j.issn.1001-8166.2005.09.0990 |
|
| [59] |
Yang P, Zhang Y Y, Xia J, et al. Investigation of precipitation concentration and trends and their potential drivers in the major river basins of Central Asia[J]. Atmospheric Research, 2020, 245: 105128, doi: 10.1016/j.atmosres.2020.105128.
doi: 10.1016/j.atmosres.2020.105128 |
| [60] |
Shi Z G, Zhou P, Li X Z, et al. Distinct Holocene precipitation trends over arid Central Asia and linkages to westerlies and Asian monsoon[J]. Quaternary Science Reviews, 2021, 266: 107055, doi: 10.1016/j.quascirev.2021.107055.
doi: 10.1016/j.quascirev.2021.107055 |
| [61] | 周天军, 吴波, 郭准, 等. 东亚夏季风变化机理的模拟和未来变化的预估:成绩和问题、机遇和挑战[J]. 大气科学, 2018, 42(4): 902-934. |
| [Zhou Tianjun, Wu Bo, Guo Zhun, et al. A review of East Asian summer monsoon simulation and projection: Achievements and problems, oportunities and challenges[J]. Chinese Journal of Atmospheric Sciences, 2018, 42(4): 902-934.] |
| [1] | 郑孟林, 赵勇, 杨霞. 1961—2022年中国西北干旱区夏季降水变化特征[J]. 干旱区地理, 2025, 48(3): 367-379. |
| [2] | 李梦园, 庞家朋, 李欢. 省域典型旅游集散地综合可达性协调发展及空间关系研究——以新疆为例[J]. 干旱区地理, 2025, 48(3): 539-548. |
| [3] | 张顺伟, 周自翔, 熊炫晨, 周杰. 基于WRF模式的无定河流域极端气候特征分析[J]. 干旱区地理, 2024, 47(9): 1482-1495. |
| [4] | 朱磊, 李燕楠, 徐佳慧, 胡静, 朱芳, 梁茫茫. 中国冰雪旅游地空间分布格局及成因[J]. 干旱区地理, 2024, 47(8): 1399-1410. |
| [5] | 陈聪, 唐英, 史承勇, 杜怡帆, 赵丽娜, 姜旭妍. 黄河流域遗产资源空间分布与区域协同保护[J]. 干旱区地理, 2024, 47(7): 1220-1232. |
| [6] | 黎珩, 朱冰冰, 边熇, 王蓉, 唐馨怡. 1970—2020年黄土高原水蚀风蚀交错区极端降水时空变化研究及驱动因素分析[J]. 干旱区地理, 2024, 47(4): 539-548. |
| [7] | 赵明杰, 王宁练, 石晨烈, 侯靖琪. 2000—2020年中亚大型湖泊湖冰物候时空变化[J]. 干旱区地理, 2024, 47(4): 561-575. |
| [8] | 张宏芳, 潘留杰, 卢珊, 沈姣姣. 近40 a来秦岭及周边地区极端降水变化特征[J]. 干旱区地理, 2024, 47(3): 380-390. |
| [9] | 蔡霞, 梁桂花, 张冬峰, 蔡琳, 白樱, 李锐锋. 山西北部极端降水时空演变规律及与大气环流因子的响应[J]. 干旱区地理, 2024, 47(3): 391-402. |
| [10] | 姜萍, 袁野. 新疆植被总初级生产力对大气水分亏缺的响应[J]. 干旱区地理, 2024, 47(3): 403-412. |
| [11] | 王安琪, 张钰, 刘佳伟, 赵威, 刘馨雨, 李凯. 新疆甘家湖梭梭林国家级自然保护区植被群落多样性及空间分布格局[J]. 干旱区地理, 2024, 47(11): 1841-1851. |
| [12] | 李晓萌, 杨莲梅, 李建刚, 刘晶. 昆仑山北坡“6·14”极端暴雨过程的中尺度对流系统特征分析[J]. 干旱区地理, 2024, 47(10): 1700-1712. |
| [13] | 江岳坤, 石鹏娟. 中国市域城乡收入差距时空演化及影响因素[J]. 干旱区地理, 2024, 47(1): 147-157. |
| [14] | 刘文丽, 陈樟, 赵勇, 梁雨欣. 中亚5月土壤湿度异常对6月降水的影响[J]. 干旱区地理, 2024, 47(1): 38-47. |
| [15] | 史维良, 车璐阳, 李涛. 陕西省汛期极端降水概率分布及综合危险性评估[J]. 干旱区地理, 2023, 46(9): 1407-1417. |
| Viewed | ||||||||||||||||||||||||||||||||||||||||||||||||||
|
Full text 224
|
|
|||||||||||||||||||||||||||||||||||||||||||||||||
|
Abstract 413
|
|
|||||||||||||||||||||||||||||||||||||||||||||||||
Cited |
|
|||||||||||||||||||||||||||||||||||||||||||||||||
| Shared | ||||||||||||||||||||||||||||||||||||||||||||||||||
|
||