Arid Land Geography ›› 2026, Vol. 49 ›› Issue (4): 756-768.doi: 10.12118/j.issn.1000-6060.2025.300
• “Dual Carbon”Research • Previous Articles Next Articles
HAO Xiaoyan1,2( ), LI Yuerong1, WU Yue1()
Received:2025-05-29
Revised:2025-07-18
Online:2026-04-25
Published:2026-04-28
Contact:
WU Yue
E-mail:nmghxy@imut.edu.cn;13191790935@163.com
HAO Xiaoyan, LI Yuerong, WU Yue. Measurement of total factor carbon productivity of the logistics industry in the Yellow River Basin and its influencing factors: A perspective based on energy endowment differences[J].Arid Land Geography, 2026, 49(4): 756-768.
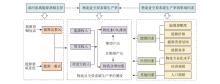
Fig. 1
Research mechanism"


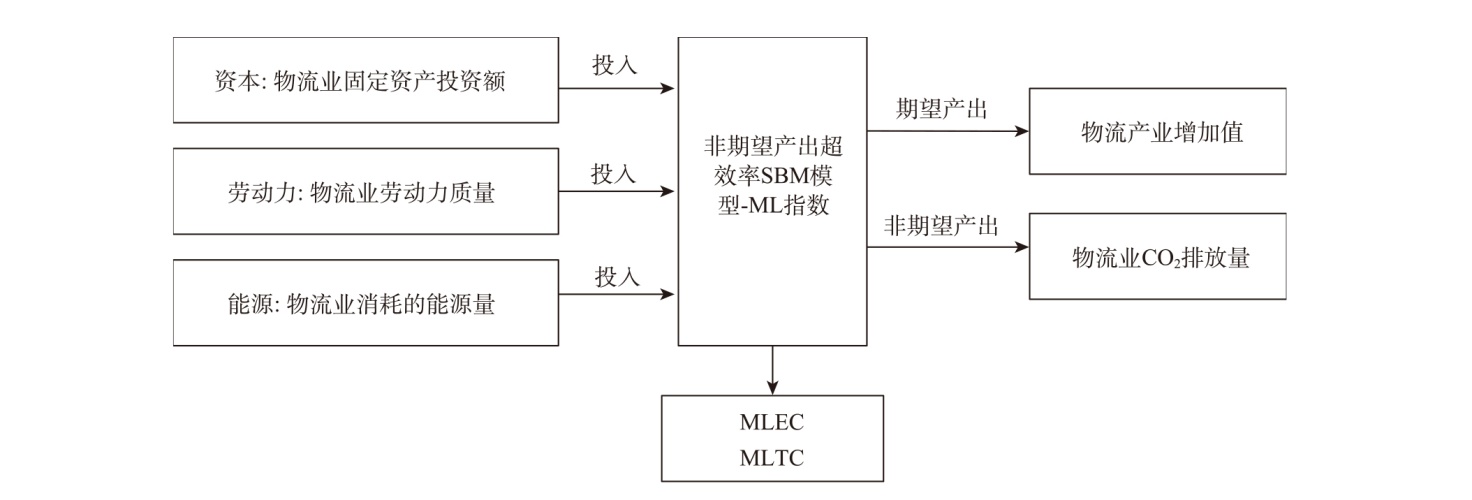
Fig. 2
Total factor carbon productivity indicator system of the logistics industry"
Tab. 1
Indicator system of influencing factors of total factor carbon productivity in the logistics industry"
| 一级指标 | 二级指标 | 指标解释 |
|---|---|---|
| 能源因素 | 能源禀赋度 | 煤、石油、天然气的产量折算为标准煤之后占全国的比重 |
| 能源价格 | 燃料、动力类工业生产者购进价格指数代替[ | |
| 能源消费结构 | 能源消费结构主要指物流业各种能源消费的比重,用能源结构系数表示 | |
| 能源效率 | 能源效率用物流业能源消耗量除以物流业增加值表示 | |
| 经济因素 | 物流专业化水平 | 物流专业化水平用物流业增加值除以当年GDP水平表示 |
| 经济规模 | 地区生产总值表示 | |
| 其他 | 人口规模 | 人口规模指各省区的年末人口数 |
Fig. 3
Energy endowment of 9 provinces and autonomous regions in the Yellow River Basin from 2013 to 2022"
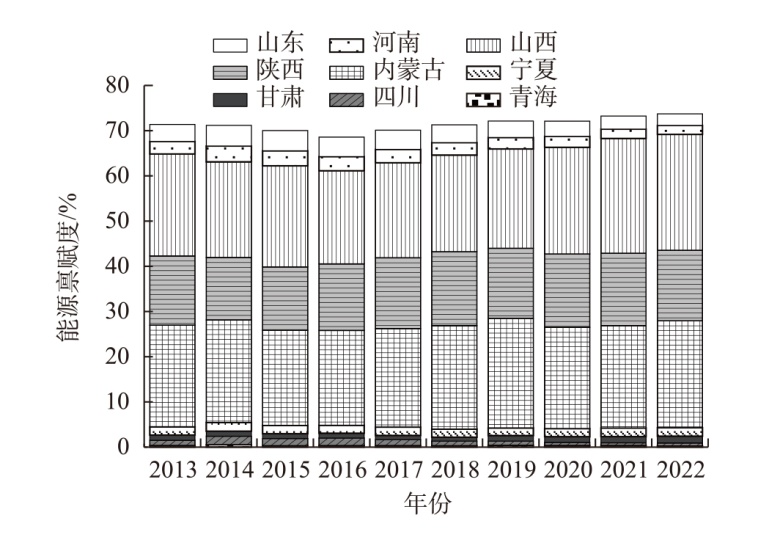
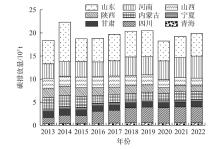
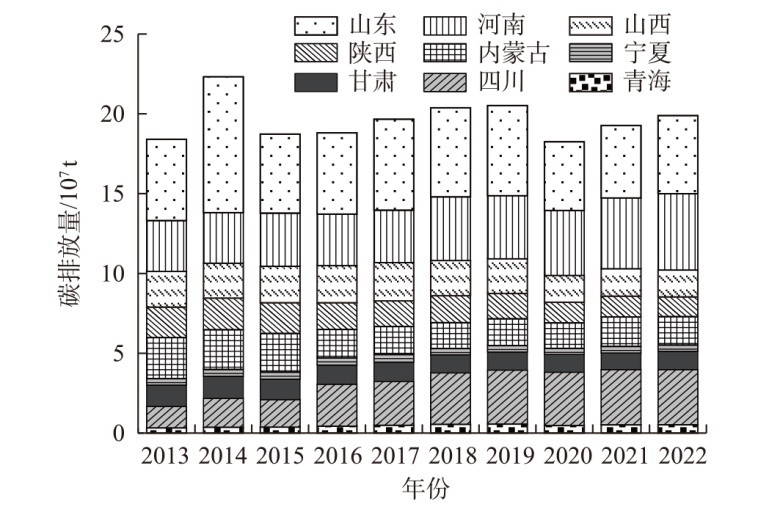
Fig. 4
Carbon emissions of the logistics industry in 9 provinces and autonomous regions of the Yellow River Basin from 2013 to 2022"
Tab. 2
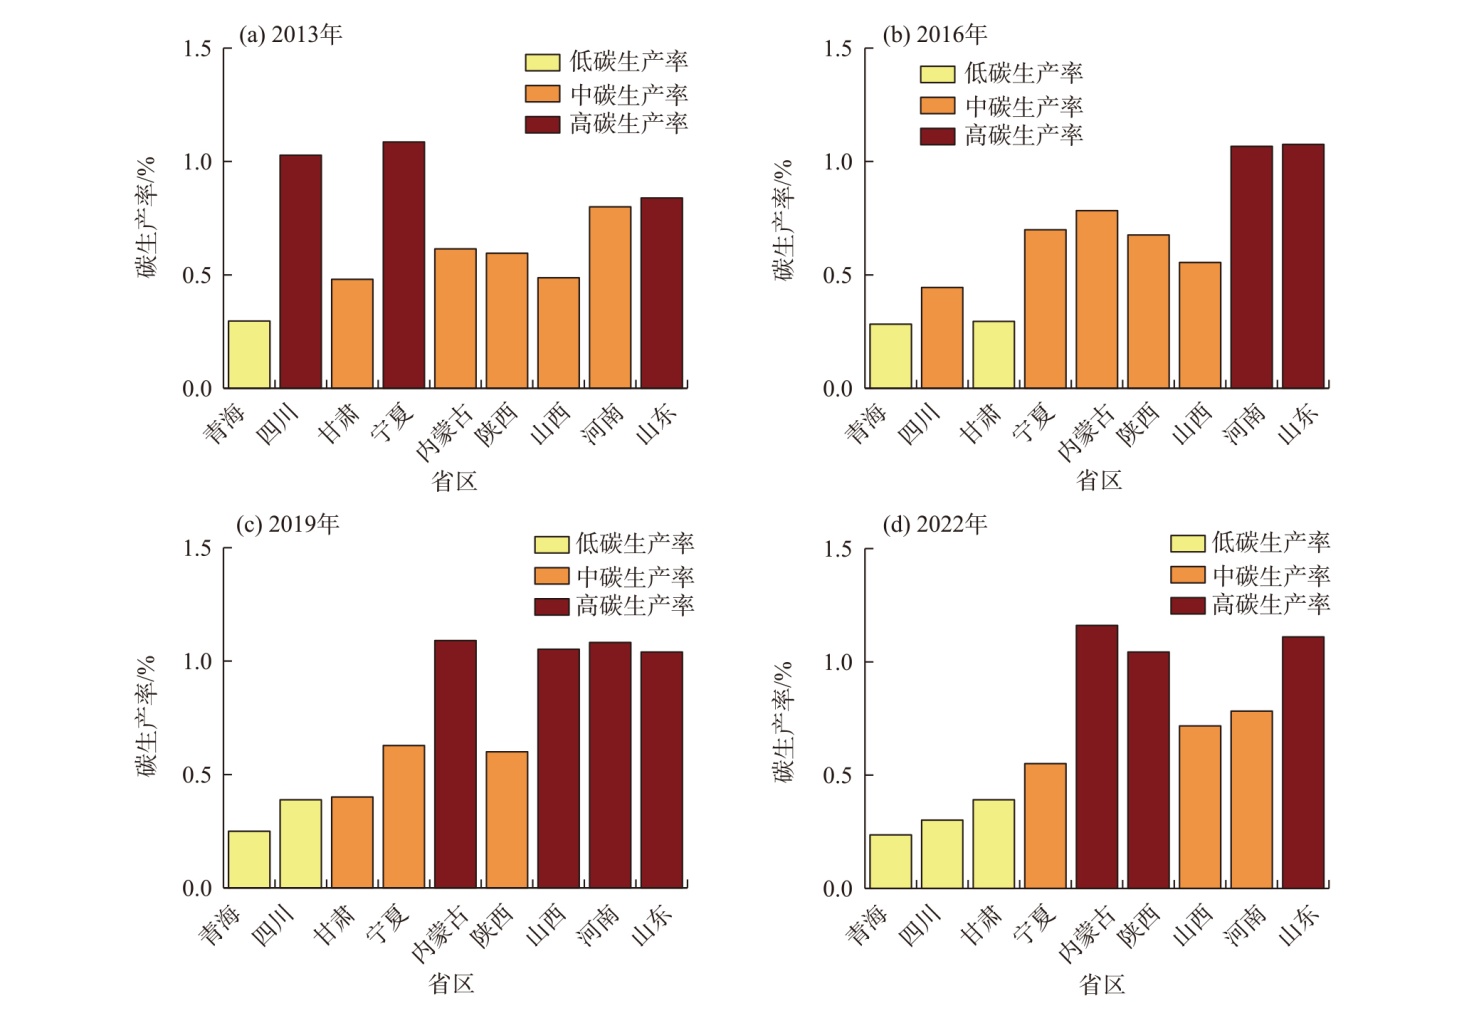
Total factor carbon productivity of the logistics industry in 9 provinces and autonomous regions of the Yellow River Basin from 2013 to 2022"
| 年份 | 能源富集区 | 能源一般区 | ||||||||
|---|---|---|---|---|---|---|---|---|---|---|
| 山西 | 内蒙古 | 陕西 | 青海 | 四川 | 甘肃 | 宁夏 | 河南 | 山东 | ||
| 2013 | 0.487 | 0.615 | 0.596 | 0.297 | 1.028 | 0.481 | 1.086 | 0.800 | 0.839 | |
| 2014 | 0.510 | 0.708 | 0.597 | 0.308 | 0.481 | 0.343 | 1.083 | 1.152 | 1.034 | |
| 2015 | 0.584 | 0.718 | 0.611 | 0.336 | 1.004 | 0.441 | 0.822 | 1.048 | 1.053 | |
| 2016 | 0.555 | 0.783 | 0.676 | 0.283 | 0.445 | 0.295 | 0.699 | 1.067 | 1.075 | |
| 2017 | 1.376 | 1.003 | 0.685 | 0.241 | 0.420 | 0.405 | 0.605 | 1.071 | 1.128 | |
| 2018 | 1.107 | 1.108 | 0.568 | 0.236 | 0.380 | 0.401 | 0.550 | 1.070 | 0.861 | |
| 2019 | 1.053 | 1.091 | 0.600 | 0.250 | 0.388 | 0.401 | 0.627 | 1.082 | 1.040 | |
| 2020 | 1.006 | 1.087 | 1.048 | 0.249 | 0.355 | 0.365 | 0.662 | 1.003 | 1.031 | |
| 2021 | 0.826 | 1.141 | 1.005 | 0.234 | 0.304 | 0.346 | 0.575 | 0.770 | 1.103 | |
| 2022 | 0.717 | 1.161 | 1.044 | 0.237 | 0.301 | 0.392 | 0.551 | 0.783 | 1.110 | |
| 均值 | 0.822 | 0.941 | 0.743 | 0.267 | 0.511 | 0.387 | 0.726 | 0.985 | 1.028 | |
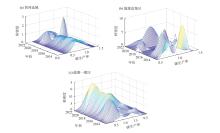
Fig. 5
Kernel density curve for total factor carbon productivity of the logistics industry from 2013 to 2022"
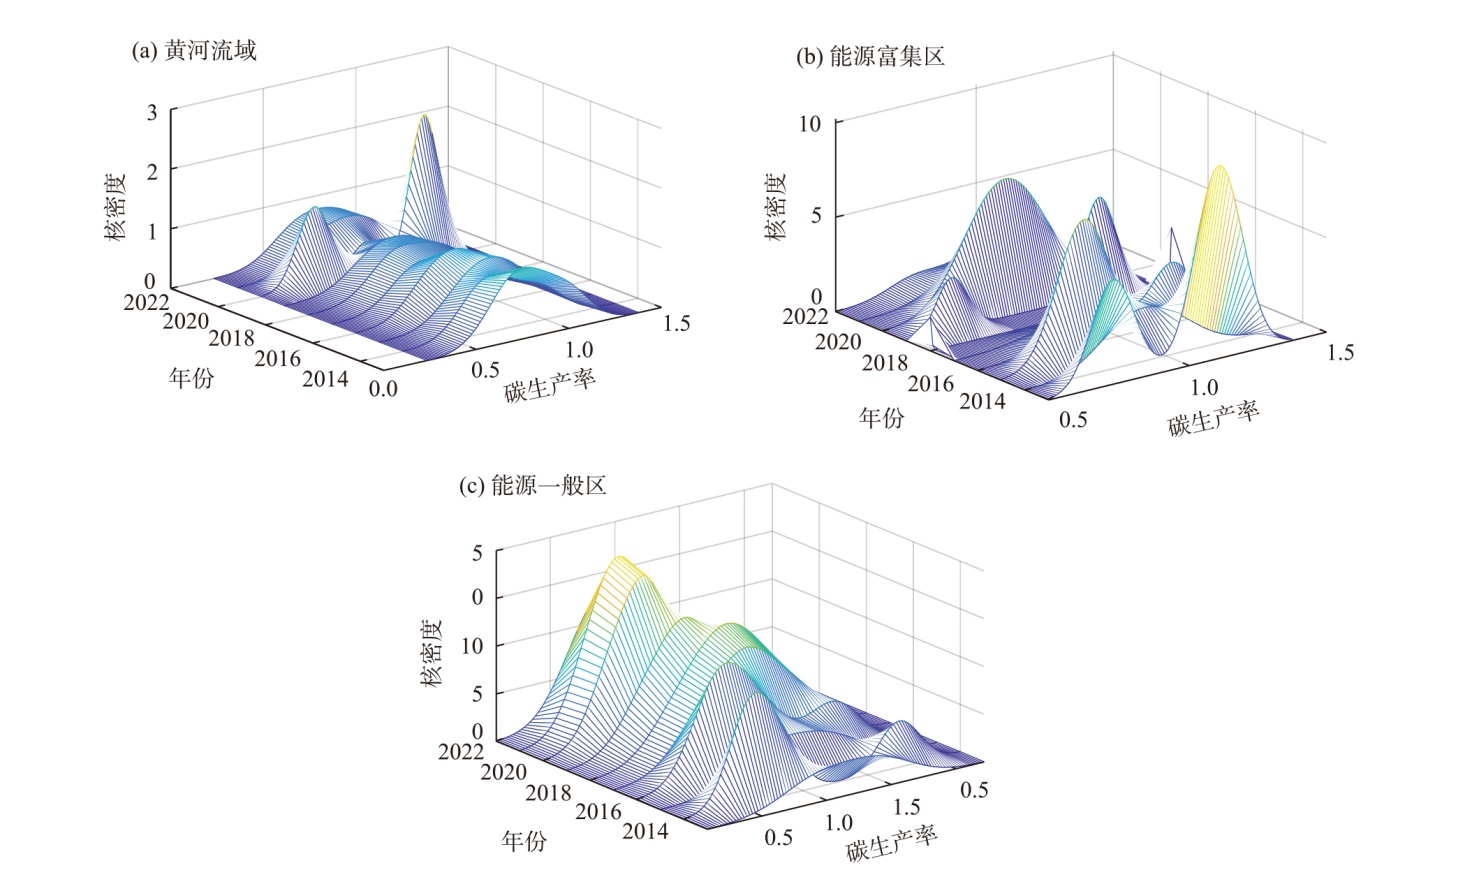

Fig. 6
Change of total factor carbon productivity of the logistics industry in 9 provinces and autonomous regions of the Yellow River Basin from 2013 to 2022"
Tab. 3
ML index of total factor carbon productivity of the logistics industry in 9 provinces and autonomous regions of the Yellow River Basin from 2013 to 2022"
| 年份 | 能源富集区 | 能源一般区 | ||||||||
|---|---|---|---|---|---|---|---|---|---|---|
| 山西 | 内蒙古 | 陕西 | 青海 | 四川 | 甘肃 | 宁夏 | 河南 | 山东 | ||
| 2013—2014 | 1.063 | 1.103 | 1.050 | 1.037 | 1.063 | 0.698 | 0.978 | 1.444 | 0.996 | |
| 2014—2015 | 1.090 | 1.076 | 0.988 | 1.136 | 2.097 | 1.293 | 0.929 | 0.928 | 1.009 | |
| 2015—2016 | 1.041 | 1.293 | 1.238 | 0.899 | 0.669 | 0.716 | 1.060 | 1.097 | 1.076 | |
| 2016—2017 | 2.472 | 1.342 | 1.272 | 0.957 | 1.035 | 1.491 | 0.957 | 1.019 | 1.092 | |
| 2017—2018 | 0.930 | 1.295 | 1.009 | 1.161 | 1.119 | 1.189 | 1.107 | 1.154 | 0.998 | |
| 2018—2019 | 0.847 | 0.986 | 1.140 | 1.106 | 1.081 | 1.055 | 1.184 | 1.063 | 1.247 | |
| 2019—2020 | 0.974 | 1.006 | 1.742 | 0.947 | 0.887 | 0.871 | 1.059 | 0.904 | 0.981 | |
| 2020—2021 | 1.057 | 1.157 | 1.361 | 1.201 | 1.110 | 1.227 | 1.053 | 1.077 | 1.277 | |
| 2021—2022 | 0.920 | 1.001 | 1.304 | 1.076 | 1.057 | 1.201 | 1.019 | 1.201 | 1.053 | |
| 均值 | 1.155 | 1.140 | 1.234 | 1.058 | 1.124 | 1.082 | 1.039 | 1.098 | 1.081 | |
Tab. 4
MLEC and MLTC of total factor carbon productivity of the logistics industry in different regions from 2013 to 2022"
| 年份 | 能源富集区 | 能源一般区 | |||
|---|---|---|---|---|---|
| MLEC | MLTC | MLEC | MLTC | ||
| 2013—2014 | 1.067 | 1.007 | 0.981 | 1.174 | |
| 2014—2015 | 1.061 | 0.993 | 1.192 | 1.048 | |
| 2015—2016 | 1.049 | 1.133 | 0.807 | 1.171 | |
| 2016—2017 | 1.591 | 1.100 | 1.015 | 1.078 | |
| 2017—2018 | 0.913 | 1.181 | 0.924 | 1.218 | |
| 2018—2019 | 0.997 | 0.991 | 1.074 | 1.046 | |
| 2019—2020 | 1.232 | 1.009 | 0.966 | 0.974 | |
| 2020—2021 | 0.943 | 1.270 | 0.908 | 1.280 | |
| 2021—2022 | 0.975 | 1.100 | 1.020 | 1.080 | |
| 均值 | 1.092 | 1.087 | 0.987 | 1.119 | |
Tab. 5
Average value of MLEC and MLTC for total factor carbon productivity of logistics industry in 9 provinces and autonomous regions of Yellow River Basin from 2013 to 2022"
| 指数 | 能源富集区 | 能源一般区 | ||||||||
|---|---|---|---|---|---|---|---|---|---|---|
| 山西 | 内蒙古 | 陕西 | 青海 | 四川 | 甘肃 | 宁夏 | 河南 | 山东 | ||
| MLEC | 1.114 | 1.077 | 1.086 | 0.979 | 0.959 | 1.002 | 0.934 | 1.010 | 1.040 | |
| MLTC | 1.053 | 1.058 | 1.151 | 1.084 | 1.279 | 1.079 | 1.122 | 1.098 | 1.052 | |
Tab. 6
Panel regression results of total factor carbon productivity of the logistics industry"
| 解释变量 | 黄河流域整体 | 能源富集区 | 能源一般区 | ||||
|---|---|---|---|---|---|---|---|
| 初始回归 | 初始回归 | 进一步回归 | 初始回归 | 进一步回归 | |||
| 能源禀赋度 | 0.22** | 0.39 | 0.50 | 0.54*** | 0.48*** | ||
| (0.014) | (0.266) | (0.110) | (0.000) | (0.000) | |||
| 能源价格 | 0.02 | 0.75 | 0.74* | -0.65* | -0.44 | ||
| (0.944) | (0.235) | (0.088) | (0.071) | (0.134) | |||
| 能源消费结构 | -0.33 | 0.29 | 0.05 | -1.65** | -0.33 | ||
| (0.383) | (0.687) | (0.903) | (0.006) | (0.551) | |||
| 能源效率 | 0.66*** | 0.65 | 0.11** | 0.52** | 0.02 | ||
| (0.000) | (0.286) | (0.031) | (0.004) | (0.721) | |||
| 物流专业化水平 | -0.56*** | -0.59 | - | -0.45** | - | ||
| (0.000) | (0.330) | (0.010) | |||||
| 经济规模 | -0.76*** | -0.72 | - | -0.09 | - | ||
| (0.000) | (0.497) | (0.590) | |||||
| 人口规模 | 0.83** | -0.16 | - | -0.04 | - | ||
| (0.002) | (0.765) | (0.780) | |||||
| 常数 | -0.86 | 3.36 | -2.84 | 4.88** | 3.58** | ||
| (0.633) | (0.597) | (0.212) | (0.001) | (0.007) | |||
| 总体R2 | 0.4781 | 0.4510 | 0.4119 | 0.8413 | 0.8063 | ||
| 样本观测数 | 86 | 29 3 | 57 6 | ||||
| 组数 | 9 | ||||||
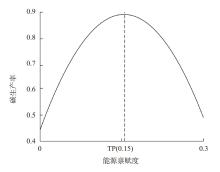
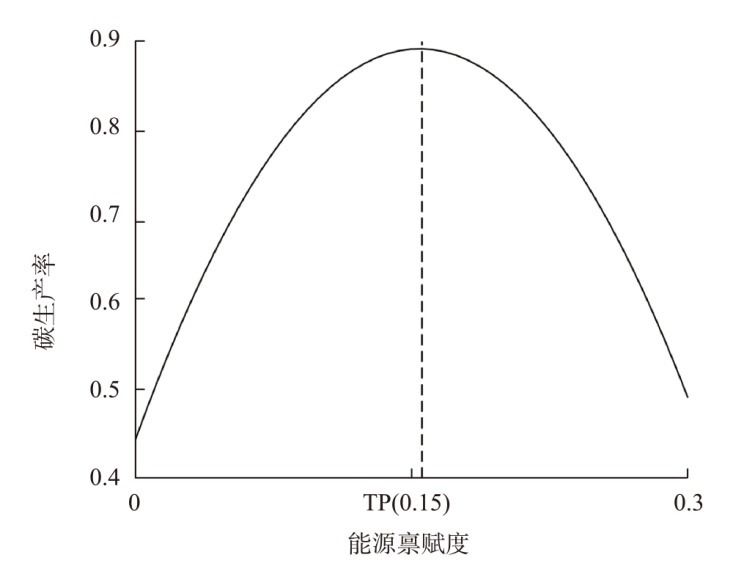
Fig. 7
Inverted “U” curve of energy endowment and carbon productivity"
| [1] | Kang X, Chen L, Wang Y, et al. Analysis on the spatial correlation network and driving factors of carbon emissions in China’s logistics industry[J]. Journal of Environmental Management, 2024, 366: 121916, doi: 10.1016/j.jenvman.2024.121916. |
| [2] | 刘帅. 数字物流促进物流业碳排放效率提升的机制与效应[J]. 中国流通经济, 2024, 38(6): 54-65. |
| [Liu Shuai. The mechanism and impact of digital logistics in enhancing the efficiency of carbon emissions in the logistics industry[J]. China Business and Market, 2024, 38(6): 54-65.] | |
| [3] | Sporkmann J, Liu Y, Spinler S. Corrigendum to “carbon emissions from European land transportation: A comprehensive analysis”[J]. Transportation Research Part D: Transport and Environment, 2024, 126: 103992, doi: 10.1016/j.trd.2023.103992. |
| [4] | 陈猛, 谈晓勇. 西部陆海新通道物流业碳排放特征及驱动因素研究[J]. 铁道运输与经济, 2024, 46(12): 100-107. |
| [Chen Meng, Tan Xiaoyong. Carbon emission characteristics and driving factors of logistics industry in new international land-sea trade corridor[J]. Railway Transport and Economy, 2024, 46(12): 100-107.] | |
| [5] | Dong Q Y, Zhou J P, Du Q Y. Analysis of the spatial correlation pattern of logistics carbon emission efficiency and its influencing factors: The case of China[J]. Environmental Science & Pollution Research, 2024, 31(7): 11178-11191. |
| [6] | 王兆峰, 黄冬春. 长江经济带与黄河流域交通碳排放效率的比较及其影响因素[J/OL]. 经济地理. [2025-11-11]. https://link.cnki.net/urlid/43.1126.K.20230831.1703.002. |
| [Wang Zhaofeng, Huang Dongchun. Comparison of transportation carbon emission efficiency and its influencing factors between Yangtze River Economic Belt and Yellow River Basin[J/OL]. Economic Geography. [2025-11-11]. https://link.cnki.net/urlid/43.1126.K.20230831.1703.002. ] | |
| [7] | Liu F, Xu H. Heterogeneity of green TFP in China’s logistics industry under environmental constraints[J]. Complexity, 2020, 2020: 8842560, doi: 10.1155/2020/8842560. |
| [8] |
Tone K. A slacks-based measure of efficiency in data envelopment analysis[J]. European Journal of Operational Research, 2001, 130(3): 498-509.
doi: 10.1016/S0377-2217(99)00407-5 |
| [9] |
Chung Y H, Färe R, Grosskopf S. Productivity and undesirable outputs: A directional distance function approach[J]. Journal of Environmental Management, 1997, 51(3): 229-240.
doi: 10.1006/jema.1997.0146 |
| [10] |
Färe R, Grosskopf S, Pasurka C A. Accounting for air pollution emissions in measures of state manufacturing productivity growth[J]. Journal of Regional Science, 2001, 41(3): 381-409.
doi: 10.1111/jors.2001.41.issue-3 |
| [11] | 王凯, 马月琴, 甘畅, 等. 中国旅游业全要素碳生产率动态演进及其影响因素[J]. 环境科学研究, 2020, 33(10): 2388-2398. |
| [Wang Kai, Ma Yueqin, Gan Chang, et al. Dynamic evolution and influencing factors of total factor carbon productivity in China’s tourism industry[J]. Research of Environmental Sciences, 2020, 33(10): 2388-2398.] | |
| [12] | 吴传清, 邓明亮. 数字经济发展对中国工业碳生产率的影响研究[J]. 中国软科学, 2023(11): 189-200. |
| [Wu Chuanqing, Deng Mingliang. Impact of digital economy development on industrial carbon productivity in China[J]. China Soft Science, 2023(11): 189-200.] | |
| [13] |
Chen J D, Xu C, Song M L, et al. Regional disparities and influencing factors for carbon productivity change in China’s transportation industry[J]. International Journal of Sustainable Transportation, 2019, 14(8): 579-590.
doi: 10.1080/15568318.2019.1587797 |
| [14] |
穆佳薇, 乔保荣, 余国新. 新疆塔里木河流域县域农业低碳生产率时空格局及影响效应研究[J]. 干旱区地理, 2023, 46(6): 968-981.
doi: 10.12118/j.issn.1000-6060.2022.358 |
|
[Mu Jiawei, Qiao Baorong, Yu Guoxin. Spatial and temporal patterns of agricultural low-carbon productivity and its influence effects in the counties of Tarim River Basin, Xinjiang[J]. Arid Land Geography, 2023, 46(6): 968-981.]
doi: 10.12118/j.issn.1000-6060.2022.358 |
|
| [15] | Wang X Z, Wang S, Zhang X X. Heterogeneity and influence factors of carbon productivity: Evidence from Chinese manufacturing enterprises[J]. Journal of Cleaner Production, 2023, 404(10): 136938, doi: 10.1016/j.jclepro.2023.136938. |
| [16] | 于向宇, 李跃, 陈会英, 等. “资源诅咒”视角下环境规制、能源禀赋对区域碳排放的影响[J]. 中国人口·资源与环境, 2019, 29(5): 52-60. |
| [Yu Xiangyu, Li Yue, Chen Huiying, et al. Study on the impact of environmental regulation and energy endowment on regional carbon emissions from the perspective of resource curse[J]. China Population, Resources and Environment, 2019, 29(5): 52-60.] | |
| [17] |
黄鲜华, 边娜, 石欣. 能源禀赋与产业技术进步对碳排放强度的影响效应研究——来自长江经济带的实证[J]. 科技进步与对策, 2018, 35(19): 59-64.
doi: 10.6049/kjjbydc.2018020274 |
| [Huang Xianhua, Bian Na, Shi Xin. The effect of energy endowments and industrial technological advances on carbon intensity: An empirical analysis based on the Yangtze River Economic Belt[J]. Science & Technology Progress and Policy, 2018, 35(19): 59-64.] | |
| [18] | 张翠菊, 张宗益, 覃明锋. 能源禀赋、技术进步与碳排放强度——基于空间计量模型的研究[J]. 系统工程, 2016, 34(11): 47-53. |
| [Zhang Cuiju, Zhang Zongyi, Qin Mingfeng. Research on energy resources, technology advance and carbon emission intensity: Based on spatial panel econometric model[J]. Systems Engineering, 2016, 34(11): 47-53.] | |
| [19] | 丁忠毅, 江蓉. 碳达峰碳中和进程中西部边疆地区的空间优势与战略匹配[J]. 云南师范大学学报(哲学社会科学版), 2022, 54(3): 34-45. |
| [Ding Zhongyi, Jiang Rong. Spatial advantages and strategic alignment of the frontier region of west China in the process of peak carbon dioxide emissions and carbon neutrality[J]. Journal of Yunnan Normal University (Philosophy and Social Sciences Edition), 2022, 54(3): 34-45.] | |
| [20] | 姚顺波, 韩久保. 基于资源丰裕和资源依赖不同视角下的“资源诅咒”问题再检验——以陕西省10个地市面板数据为例[J]. 经济经纬, 2017, 34(5): 14-19. |
| [Yao Shunbo, Han Jiubao. Re-examination of the “resource curse” from different perspectives of resource abundance and resource dependence: A case study based on panel data of 10 cities in Shaanxi Province[J]. Economic Survey, 2017, 34(5): 14-19.] | |
| [21] | Su X, Tan J L. Regional energy transition path and the role of government support and resource endowment in China[J]. Renewable and Sustainable Energy Reviews, 2023, 174: 113150, doi: 10.1016/j.rser.2023.113150. |
| [22] | 申萌, 李凯杰, 曲如晓. 技术进步、经济增长与二氧化碳排放: 理论和经验研究[J]. 世界经济, 2012, 35(7): 83-100. |
| [Shen Meng, Li Kaijie, Qu Ruxiao. Technological progress, economic growth and carbon dioxide emissions: A theoretical and empirical study[J]. The Journal of World Economy, 2012, 35(7): 83-100.] | |
| [23] |
Ding H P, Wang Y, Sheng W J, et al. Measurement and evaluation of carbon emission efficiency in logistics industry: Taking Anhui Province as an example[J]. Polish Journal of Environmental Studies, 2024, 33(6): 6097-6108.
doi: 10.15244/pjoes/185535 |
| [24] |
Tone K. A slacks-based measure of super-efficiency in data envelopment analysis[J]. European Journal of Operational Research, 2002, 143(1): 32-41.
doi: 10.1016/S0377-2217(01)00324-1 |
| [25] |
裴恺程, 穆怀中. 环境规制对物流业绿色发展的影响研究——来自京津冀地区的实证检验[J]. 工业技术经济, 2021, 40(5): 107-114.
doi: 10.3969/j.issn.1004-910X.2021.05.013 |
| [Pei Kaicheng, Mu Huaizhong. Impact of environmental regulation on green development of logistics industry: Empirical test based on Beijing-Tianjin-Hebei region[J]. Journal of Industrial Technological Economics, 2021, 40(5): 107-114.] | |
| [26] | Agan B. Sustainable development through green transition in EU countries: New evidence from panel quantile regression[J]. Journal of Environmental Management, 2024, 365: 121545, doi: 10.1016/j.jenvman.2024.121545. |
| [27] | 张兰怡, 徐艺诺, 翁大维, 等. 经济高质量发展背景下中国省域物流业碳排放时空分异[J]. 环境科学, 2024, 45(9): 5086-5096. |
| [Zhang Lanyi, Xu Yinuo, Weng Dawei, et al. Spatiotemporal differentiation of carbon emissions from logistics industry at provincial scale in China under the background of high-quality economic development[J]. Environmental Science, 2024, 45(9): 5086-5096.] | |
| [28] | 梁毅, 徐超飞, 高子涵. “一带一路”倡议下中国沿线区域物流业碳排放时空演变及驱动因素分析[J]. 环境工程技术学报, 2025, 15(3): 798-810. |
| [Liang Yi, Xu Chaofei, Gao Zihan. Spatial and temporal evolution and driving factors of carbon emissions in regional logistics industry in China under the Belt and Road Initiative[J]. Journal of Environmental Engineering Technology, 2025, 15(3): 798-810.] | |
| [29] | 李跃, 方冉, 韩浩亮, 等. 煤炭资源区域异质性视角下新能源发展的产业转型升级效应研究[J]. 中国煤炭, 2024, 50(8): 34-42. |
| [Li Yue, Fang Ran, Han Haoliang, et al. Research on the industrial transformation and upgrading effect of new energy development from the perspective of regional heterogeneity of coal resources[J]. China Coal, 2024, 50(8): 34-42.] | |
| [30] | 喻小宝, 于永智. 基于SBM-ML-Tobit模型的中国工业碳生产率影响因素研究[J]. 生态经济, 2024, 40(8): 13-19. |
|
[Yu Xiaobao, Yu Yongzhi. Research of factors influencing industrial carbon productivity in China based on the SBM-ML-Tobit model[J]. Ecological Economy, 2024, 40(8): 13-19.]
doi: 10.1016/S0921-8009(01)00275-0 |
|
| [31] | 邵帅, 杨莉莉. 自然资源丰裕、资源产业依赖与中国区域经济增长[J]. 管理世界, 2010(9): 26-44. |
| [Shao Shuai, Yang Lili. The abundance of natural resources, the dependence on the resources industry, and China’s regional economic growth[J]. Management World, 2010(9): 26-44.] | |
| [32] | 薛建春, 丁志斌, 曹凌辰. 黄河流域能源利用效率空间关联网络及其形成机制[J]. 环境工程技术学报, 2025, 15(4): 1398-1408. |
| [Xue Jianchun, Ding Zhibin, Cao Lingchen. Spatial correlation network of energy efficiency in the Yellow River Basin and its formation mechanism[J]. Journal of Environmental Engineering Technology, 2025, 15(4): 1398-1408.] | |
| [33] | 赵艳敏, 王迪. 数字经济发展对全要素能源效率的影响机制研究——以黄河流域73个地级市为例[J]. 软科学, 2024, 38(8): 37-44, 59. |
| [Zhao Yanmin, Wang Di. Influence mechanism of digital economy development on total factor energy efficiency: Taking 73 prefecture-level cities in the Yellow River Basin as examples[J]. Soft Science, 2024, 38(8): 37-44, 59.] | |
| [34] |
李慧, 姚西龙. 水足迹视角下黄河流域可再生能源制氢节水潜力研究[J]. 干旱区地理, 2025, 48(8): 1353-1362.
doi: 10.12118/j.issn.1000-6060.2025.066 |
|
[Li Hui, Yao Xilong. Water-saving potential of hydrogen production from renewable energy in Yellow River Basin from the perspective of water footprint[J]. Arid Land Geography, 2025, 48(8): 1353-1362.]
doi: 10.12118/j.issn.1000-6060.2025.066 |
|
| [35] | 韩冬日, 刁燕霞, 王心娟. 黄河流域减污降碳协同治理效率空间网络关联特征及驱动因素[J]. 环境科学, 2025, 46(6): 3592-3603. |
| [Han Dongri, Diao Yanxia, Wang Xinjuan. Analysis of carbon total factor productivity, economic growth and low-carbon development in the Yellow River Basin[J]. Environmental Science, 2025, 46(6): 3592-3603.] | |
| [36] | 祝福云, 师宇星. 碳全要素生产率、经济增长与低碳发展分析——基于黄河流域58个地级市的证据[J]. 干旱区资源与环境, 2024, 38(1): 52-59. |
| [Zhu Fuyun, Shi Yuxing. Analysis of carbon total factor productivity, economic growth and low-carbon development in the Yellow River Basin[J]. Journal of Arid Land Resources and Environment, 2024, 38(1): 52-59.] | |
| [37] |
宋成镇, 刘庆芳, 马伟, 等. 技术创新对黄河流域地区和长江经济带碳生产率影响路径比较——基于数字金融的中介效应[J]. 资源科学, 2024, 46(3): 450-461.
doi: 10.18402/resci.2024.03.02 |
|
[Song Chengzhen, Liu Qingfang, Ma Wei, et al. Comparison of the impact paths of technological innovation on carbon productivity in the Yellow River Basin and the Yangtze River Economic Belt: Mediation effect based on digital finance[J]. Resources Science, 2024, 46(3): 450-461.]
doi: 10.18402/resci.2024.03.02 |
|
||