Arid Land Geography ›› 2025, Vol. 48 ›› Issue (2): 283-295.doi: 10.12118/j.issn.1000-6060.2024.324
• Ecology and Environment • Previous Articles Next Articles
LI Kangning1,2,3( ), LIN Yilin1,2,3(), ZHAO Junsan1,2,3, WANG Jian1,2,3, GE Feng4
Received:2024-05-26
Revised:2024-11-26
Online:2025-02-25
Published:2025-02-25
Contact:
LIN Yilin
E-mail:20222201075@stu.kust.edu.cn;20200111@kust.edu.cn
LI Kangning, LIN Yilin, ZHAO Junsan, WANG Jian, GE Feng. Driving mechanisms of vegetation change and ecological vulnerability in the Three-River Headwater Region[J].Arid Land Geography, 2025, 48(2): 283-295.

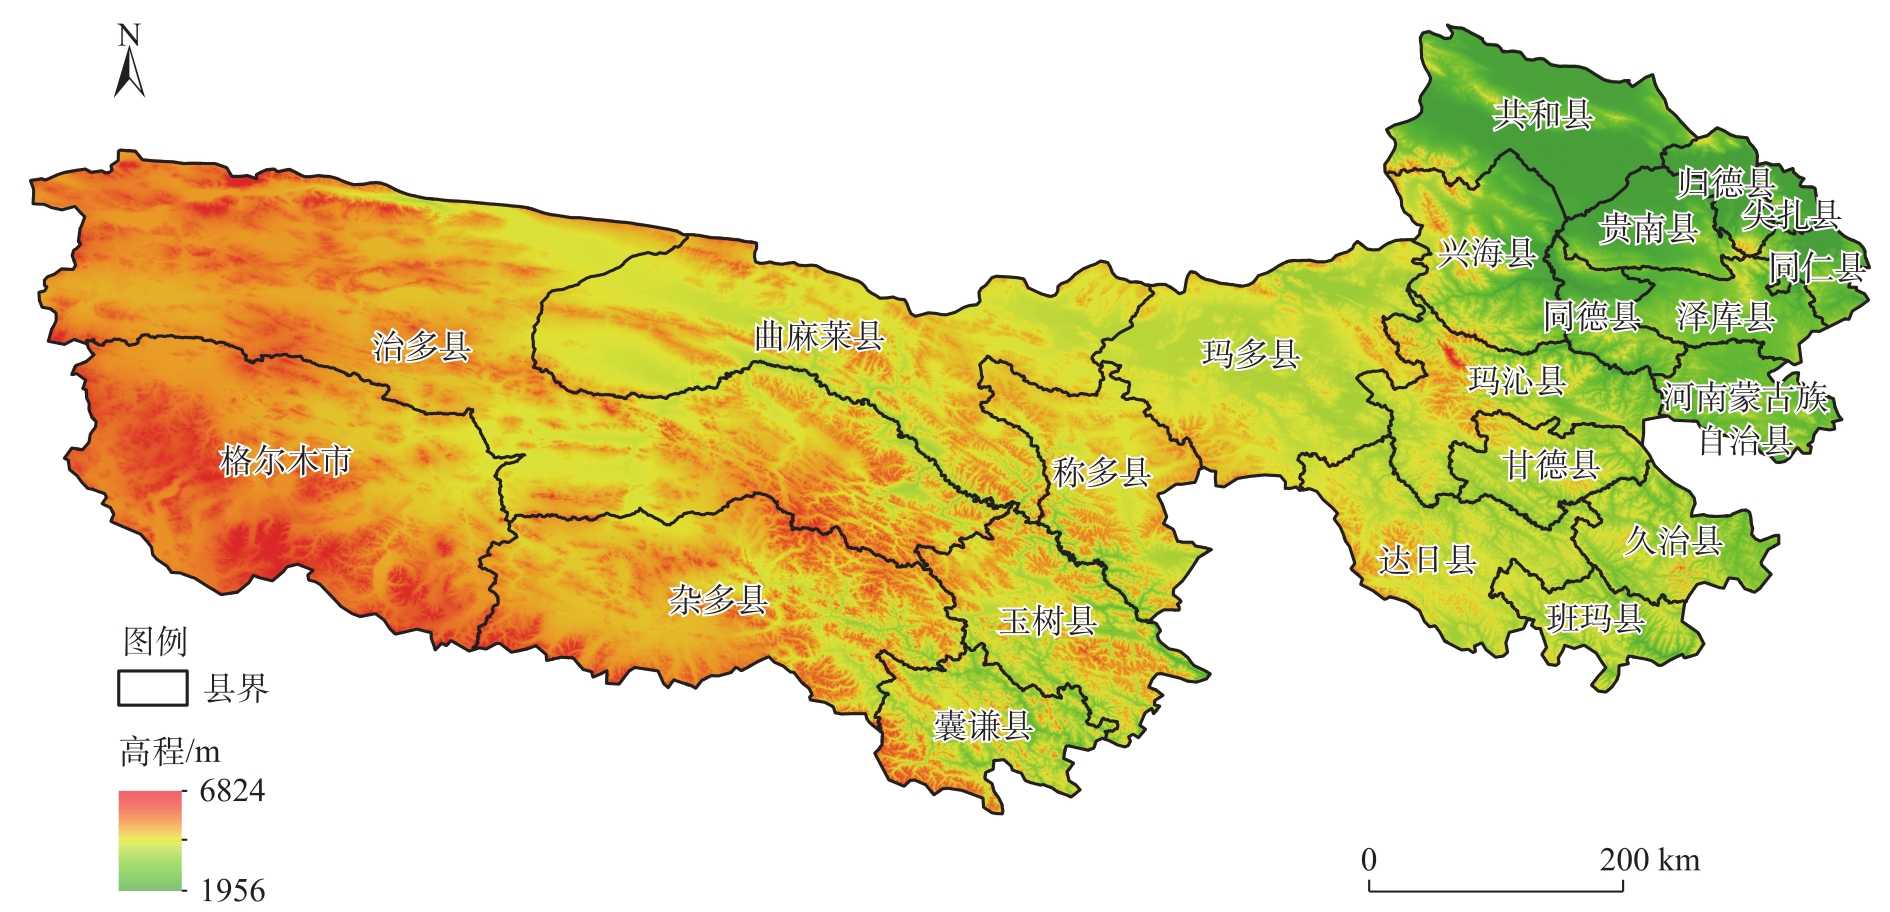
Fig. 1
Schematic drawing in the area of Three-River Headwater Region (TRHR)"
Tab. 1
Interaction types of different impact factors"
| 判断区间 | 交互作用 |
|---|---|
| q(Xn∩Xm)<min[q(Xn), q(Xm)] | 非线性减弱 |
| min[q(Xn), q(Xm)]<q(Xn∩Xm)<max[q(Xn), q(Xm)] | 单因子非线性减弱 |
| q(Xn∩Xm)>max[q(Xn), q(Xm)] | 双因子增强 |
| q(Xn∩Xm)=q(Xn)+q(Xm) | 相互独立 |
| q(Xn∩Xm)>q(Xn)+q(Xm) | 非线性增强 |
Tab. 2
Standardized assignment"
| 土地利用类型 | 林地、水域 | 草地 | 耕地 | 建设用地 | 裸地 |
|---|---|---|---|---|---|
| 标准化赋值 | 0.2 | 0.4 | 0.6 | 0.8 | 1.0 |
Tab. 3
Evaluation index system and AHP weight of ecological vulnerability in the area of TRHR"
| 目标层 | 准则层 | 指标层 | 属性 |
|---|---|---|---|
| 敏感性(0.7089) | 地形因子(0.2024) | 海拔(0.1797) | 正向 |
| 坡度(0.0227) | 正向 | ||
| 地表因子(0.0496) | 土地利用类型(0.0496) | 定性 | |
| 气象因子(0.4570) | 降水量(0.1943) | 负向 | |
| 气温(0.1630) | 负向 | ||
| 蒸散发(0.0356) | 负向 | ||
| PM10(0.0641) | 正向 | ||
| 恢复力(0.1786) | 植被因子(0.1191) | NDVI/kNDVI(0.1191) | 负向 |
| 多样性因子(0.0595) | 生物丰富度指数(0.0595) | 负向 | |
| 压力度(0.1125) | 社会因子(0.1125) | 人口密度(0.0844) | 正向 |
| 夜间灯光(0.0281) | 正向 |
Tab. 4
Ecological vulnerability classification criteria represented by NDVI and kNDVI"
| 生态脆弱性程度 | 生态脆弱性指数 | |
|---|---|---|
| NDVI | kNDVI | |
| 微度脆弱 | 0.087~0.237 | 0.084~0.253 |
| 轻度脆弱 | 0.237~0.299 | 0.253~0.316 |
| 中度脆弱 | 0.299~0.359 | 0.316~0.376 |
| 重度脆弱 | 0.359~0.428 | 0.376~0.444 |
| 极度脆弱 | 0.428~0.555 | 0.444~0.555 |
Fig. 2
Time variation trends of NDVI and kNDVI in the area of TRHR"
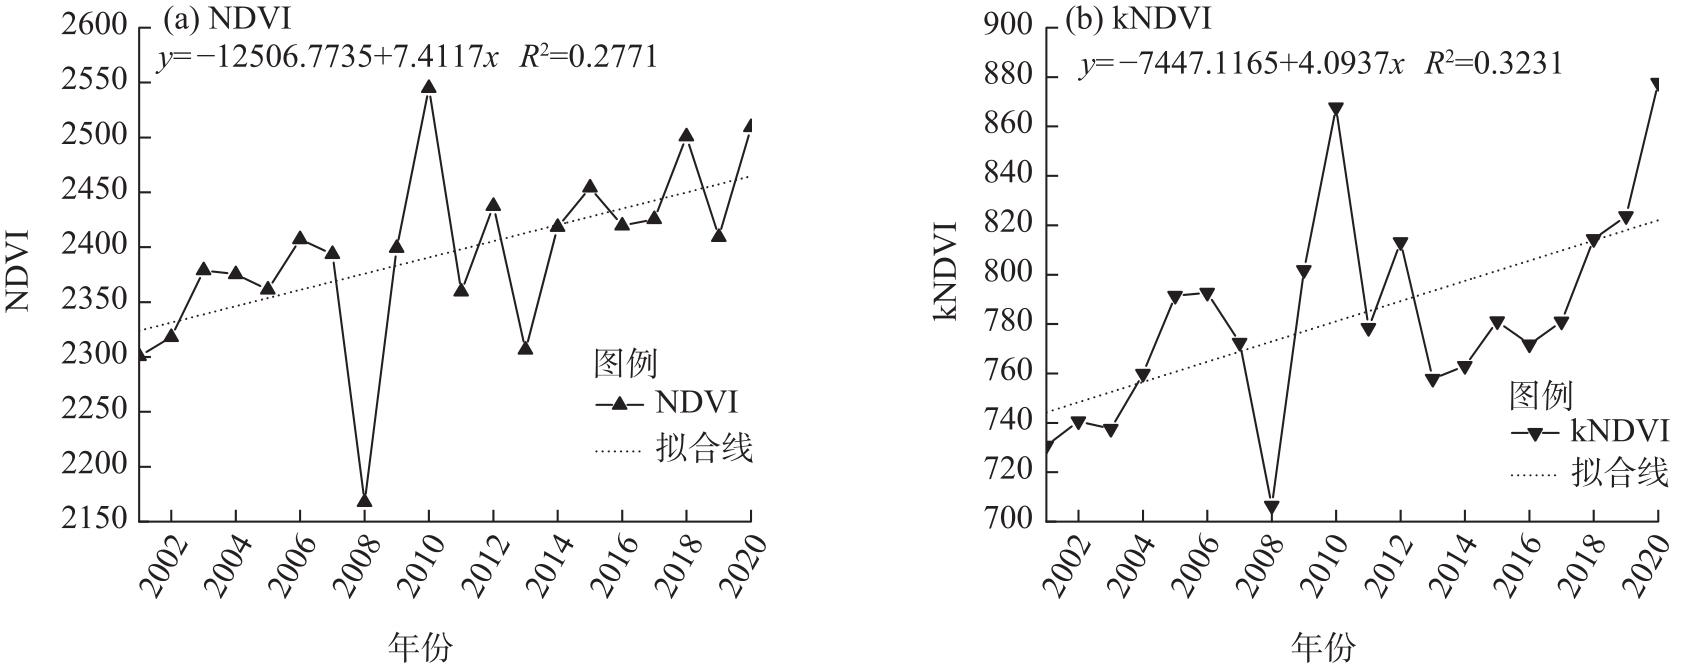
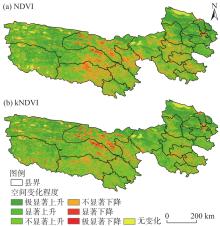
Fig. 3
Spatial variation trend and degree of annual NDVI and kNDVI in the area of TRHR"

Tab. 5
Factor detection results"
| 指标 | X1 | X2 | X3 | X4 | X5 | X6 | X7 | X8 | X9 | X10 | |
|---|---|---|---|---|---|---|---|---|---|---|---|
| NDVI | q | 0.513 | 0.449 | 0.187 | 0.034 | 0.007 | 0.229 | 0.493 | 0.007 | 0.123 | 0.078 |
| P | 0.000 | 0.000 | 0.000 | 0.000 | 0.000 | 0.000 | 0.000 | 0.000 | 0.000 | 0.000 | |
| kNDVI | q | 0.504 | 0.438 | 0.182 | 0.036 | 0.007 | 0.178 | 0.500 | 0.008 | 0.123 | 0.062 |
| P | 0.000 | 0.000 | 0.000 | 0.000 | 0.000 | 0.000 | 0.000 | 0.000 | 0.000 | 0.000 | |
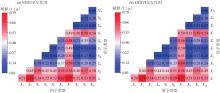
Fig. 4
Explanatory power of interaction between NDVI and kNDVI factors in the area of TRHR"

Tab. 6
Precipitation risk detection results"
| 降水量/mm | 降水量/mm | ||||||||
|---|---|---|---|---|---|---|---|---|---|
| 0~225 | 225~280 | 280~330 | 330~379 | 379~427 | 427~472 | 472~516 | 516~573 | 573~675 | |
| 0~225 | |||||||||
| 225~280 | Y | ||||||||
| 280~330 | Y | Y | |||||||
| 330~379 | Y | Y | Y | ||||||
| 379~427 | Y | Y | Y | Y | |||||
| 427~472 | Y | Y | Y | Y | Y | ||||
| 472~516 | Y | Y | Y | Y | Y | Y | |||
| 516~573 | Y | Y | Y | Y | Y | Y | N | ||
| 573~675 | Y | Y | Y | Y | Y | Y | Y | Y | |
| NDVI | 0.143 | 0.196 | 0.253 | 0.302 | 0.351 | 0.416 | 0.445 | 0.451 | 0.558 |
| kNDVI | 0.045 | 0.061 | 0.091 | 0.117 | 0.144 | 0.186 | 0.204 | 0.209 | 0.270 |
Tab. 7
Altitude risk detection results"
| 海拔/m | 海拔/m | ||||||||
|---|---|---|---|---|---|---|---|---|---|
| 1956~2979 | 2979~3447 | 3447~3850 | 3850~4176 | 4176~4436 | 4436~4665 | 4665~4894 | 4894~5181 | 5181~6824 | |
| 1956~2979 | |||||||||
| 2979~3447 | Y | ||||||||
| 3447~3850 | Y | Y | |||||||
| 3850~4176 | Y | Y | Y | ||||||
| 4176~4436 | Y | Y | Y | Y | |||||
| 4436~4665 | Y | Y | Y | Y | Y | ||||
| 4665~4894 | Y | Y | Y | Y | Y | Y | |||
| 4894~5181 | Y | Y | Y | Y | Y | Y | Y | ||
| 5181~6824 | Y | Y | Y | Y | Y | Y | Y | Y | |
| NDVI | 0.262 | 0.378 | 0.564 | 0.536 | 0.405 | 0.322 | 0.277 | 0.207 | 0.149 |
| kNDVI | 0.096 | 0.164 | 0.278 | 0.257 | 0.178 | 0.130 | 0.105 | 0.069 | 0.051 |
Tab. 8
Appropriate range or type of factors"
| 因子类型 | NDVI/kNDVI 适宜范围或类型 | NDVI | kNDVI | |
|---|---|---|---|---|
| 自然 因子 | 降水量 | 573~675 mm | 0.558 | 0.270 |
| 气温 | -5~21 ℃ | 0.529 | 0.256 | |
| 蒸散发 | 168~408 mm·月-1 | 0.524 | 0.253 | |
| 海拔 | 3447~3850 m | 0.564 | 0.278 | |
| 坡向 | 西、西北方向 | 0.349 | 0.149 | |
| 坡度 | 20°~24° | 0.425 | 0.191 | |
| 土壤类型 | 黄壤 | 0.580 | 0.287 | |
| 人为 因子 | 人口密度 | 7~47 人·km-2 | 0.491 | 0.231 |
| 夜间灯光 | 9~16 lm·m-3 | 0.449 | 0.191 | |
| 土地利用 | 森林 | 0.581 | 0.292 | |
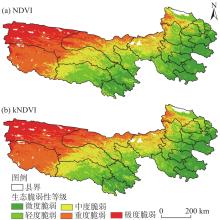
Fig. 5
Spatial distributions of ecological vulnerability levels of NDVI and kNDVI in the area of TRHR"
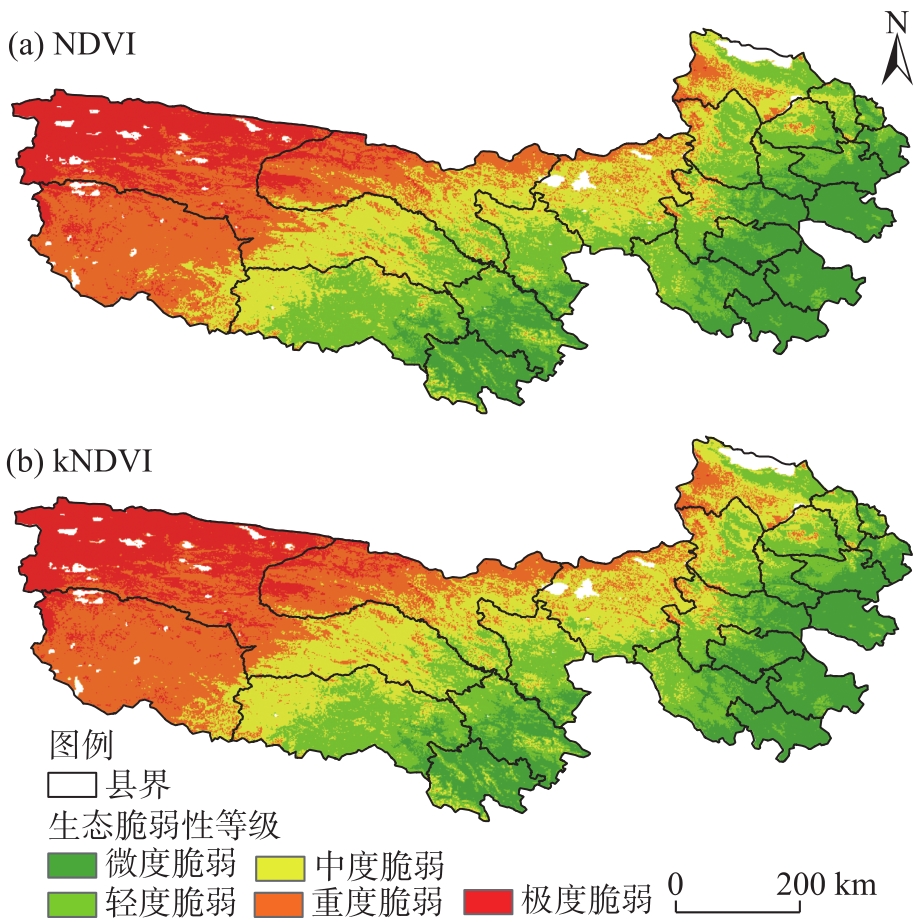
Tab. 9
NDVI, kNDVI vulnerable area and specific gravity"
| 生态脆弱性等级 | NDVI | kNDVI | |||
|---|---|---|---|---|---|
| 面积/km2 | 比例/% | 面积/km2 | 比例/% | ||
| 微度脆弱 | 40895 | 18.01 | 37780 | 16.64 | |
| 轻度脆弱 | 51917 | 22.86 | 49569 | 21.83 | |
| 中度脆弱 | 53950 | 23.75 | 56026 | 24.68 | |
| 重度脆弱 | 52507 | 23.12 | 55232 | 24.33 | |
| 极度脆弱 | 27856 | 12.26 | 28435 | 12.52 | |
| [1] | 张元梅, 孙桂丽, 鲁艳, 等. 气候变化和人类活动对环塔里木盆地植被覆盖度的影响[J]. 东北林业大学学报, 2024, 52(5): 75-81. |
| [Zhang Yuanmei, Sun Guili, Lu Yan, et al. Effects of climate change and human activities on vegetation coverage in Ring Tarim Basin[J]. Journal of Northeast Forestry University, 2024, 52(5): 75-81. ] | |
| [2] | Zheng K Y, Tan L S, Sun Y W, et al. Impacts of climate change and anthropogenic activities on vegetation change: Evidence from typical areas in China[J]. Ecological Indicators, 2021, 126: 107648, doi: 10.1016/j.ecolind.2021.107648. |
| [3] |
Yuan J, Xu Y P, Xiang J, et al. Spatiotemporal variation of vegetation coverage and its associated influence factor analysis in the Yangtze River Delta, eastern China[J]. Environmental Science and Pollution Research, 2019, 26: 32866-32879.
doi: 10.1007/s11356-019-06378-2 |
| [4] | Li X W, Zulkar H, Wang D Y, et al. Changes in vegetation coverage and migration characteristics of center of gravity in the arid desert region of northwest China in 30 recent years[J]. Land, 2022, 11(10): 1688, doi: 10.3390/land11101688. |
| [5] | Shammi S A, Meng Q M. Use time series NDVI and EVI to develop dynamic crop growth metrics for yield modeling[J]. Ecological Indicators, 2021, 121: 107124, doi: 10.1016/j.ecolind.2020.107124. |
| [6] | Zhang J X, Yang T, Deng M, et al. Spatiotemporal variations and its driving factors of NDVI in northwest China during 2000—2021[J]. Environmental Science and Pollution Research, 2023, 30(56): 118782-118800. |
| [7] | Alencar A Z, Shimbo J, Lenti F, et al. Mapping three decades of changes in the Brazilian savanna native vegetation using landsat data processed in the google earth engine platform[J]. Remote Sensing, 2020, 12(6): 924, doi: 10.3390/rs12060924. |
| [8] | Camps-Valls G, Campos-Taberner M, Moreno-Martínez Á, et al. A unified vegetation index for quantifying the terrestrial biosphere[J]. Science Advances, 2021, 7(9): eabc7447, doi: 10.1126/sciadv.abc7447. |
| [9] | Chen Z G, Shen M G, Jiang N, et al. Daytime warming strengthened delaying effect of precipitation on end of the vegetation growing season on the Tibetan Plateau[J]. Science of the Total Environment, 2023, 892: 164382, doi: 10.1016/j.scitotenv.2023.164382. |
| [10] | Li X, Xu L, Li M X, et al. High-resolution maps of vegetation nitrogen density on the Tibetan Plateau: An intensive field-investigation[J]. Science of the Total Environment, 2023, 904: 167233, doi: 10.1016/j.scitotenv.2023.167233. |
| [11] | Liu Y, Tian J, Liu R H, et al. Influences of climate change and human activities on NDVI changes in China[J]. Remote Sensing, 2021, 13(21): 4326, doi: 10.3390/rs13214326. |
| [12] | Dai Q, Cui C F, Wang S. Spatiotemporal variation and sustainability of NDVI in the Yellow River Basin[J]. Irrigation and Drainage, 2022, 71(5): 1304-1318. |
| [13] | 李敏, 张艳. 黄河流域中段植被覆盖时空变化特征及影响因素分析[J]. 贵州师范大学学报(自然科学版), 2023, 41(1): 10-20, 40. |
| [Li Min, Zhang Yan. Temporal and spatial variation characteristics and influencing factors of vegetation cover in the middle Yellow River Basin[J]. Journal of Guizhou Normal University (Natural Sciences Edition), 2023, 41(1): 10-20, 40. ] | |
| [14] |
赵慧芳, 曹晓云. 三江源国家公园植被覆盖时空变化及其气候驱动因素[J]. 高原气象, 2022, 41(2): 328-337.
doi: 10.7522/j.issn.1000-0534.2021.00091 |
|
[Zhao Huifang, Cao Xiaoyun. Vegetation cover changes and its climate driving in Three-River-Source National Park[J]. Plateau Meteorology, 2022, 41(2): 328-337. ]
doi: 10.7522/j.issn.1000-0534.2021.00091 |
|
| [15] | 谢绮丽, 杨鑫, 郝利娜. 2001—2020年三江源区植被覆盖时空变化特征及其影响因素[J]. 水土保持通报, 2022, 42(5): 202-212. |
| [Xie Qili, Yang Xin, Hao Lina. Spatio-temporal variation of vegetation cover and its driving factors in Three-River Headwaters Region during 2001—2020[J]. Bulletin of Soil and Water Conservation, 2022, 42(5): 202-212. ] | |
| [16] | Wang J, Zhao J S, Zhou P, et al. Study on the spatial and temporal evolution of NDVI and its driving mechanism based on geodetector and hurst indexes: A case study of the Tibet Autonomous Region[J]. Sustainability, 2023, 15(7): 5981, doi: 10.3390/su15075981. |
| [17] | Chen C, Li T J, Sivakumar B, et al. Attribution of growing season vegetation activity to climate change and human activities in the Three-River Headwaters Region, China[J]. Journal of Hydroinformatics, 2020, 22(1): 186-204. |
| [18] |
王劲峰, 徐成东. 地理探测器: 原理与展望[J]. 地理学报, 2017, 72(1): 116-134.
doi: 10.11821/dlxb201701010 |
|
[Wang Jinfeng, Xu Chengdong. Geodetector: Principle and prospective[J]. Acta Geographica Sinica, 2017, 72(1): 116-134. ]
doi: 10.11821/dlxb201701010 |
|
| [19] | Dong Y, Yin D Q, Li X, et al. Spatial-temporal evolution of vegetation NDVI in association with climatic, environmental and anthropogenic factors in the Loess Plateau, China during 2000—2015: Quantitative analysis based on geographical detector model[J]. Remote Sensing, 2021, 13(21): 4380, doi: 10.3390/rs13214380. |
| [20] | Gao S Q, Dong G T, Jiang X H, et al. Quantification of natural and anthropogenic driving forces of vegetation changes in the Three-River Headwater Region during 1982—2015 based on geographical detector model[J]. Remote Sensing, 2021, 13(20): 4175, doi: 10.3390/rs13204175. |
| [21] | Wu R N, Wang Y, Liu B Y, et al. Spatial-temporal changes of NDVI in the three northeast provinces and its dual response to climate change and human activities[J]. Frontiers in Environmental Science, 2022, 10: 974988, doi: 10.3389/fenvs.2022.974988. |
| [22] | Jiang B H, Chen W, Dai X A, et al. Change of the spatial and temporal pattern of ecological vulnerability: A case study on Cheng-Yu urban agglomeration, southwest China[J]. Ecological Indicators, 2023, 149: 110161, doi: 10.1016/j.ecolind.2023.110161. |
| [23] | 陆晴, 廖佳婧, 胡慧敏. 基于SRP模型的红壤丘陵区生态脆弱性评价——以江西省赣南地区为例[J]. 上海国土资源, 2023, 44(3): 100-105, 156. |
| [Lu Qing, Liao Jiajing, Hu Huimin. Evaluation of ecological vulnerability in the Gannan region of Jiangxi Province[J]. Shanghai Land & Resources, 2023, 44(3): 100-105, 156. ] | |
| [24] | 王成军, 罗昕玥. 基于SRP模型榆林市生态脆弱性评价及时空演变研究[J]. 生产力研究, 2023(10): 56-61. |
| [Wang Chengjun, Luo Xinyue. A study on ecological vulnerability evaluation and spatial and temporal evolution of Yulin City based on SRP modeling[J]. Productivity Research, 2023(10): 56-61. ] | |
| [25] | 常溢华, 蔡海生. 基于SRP模型的多尺度生态脆弱性动态评价——以江西省鄱阳县为例[J]. 江西农业大学学报, 2022, 44(1): 245-260. |
| [Chang Yihua, Cai Haisheng. Dynamic assessment of multi-scale eco-environmental vulnerability based on SRP model in Poyang County[J]. Acta Agriculturae Universitatis Jiangxiensis, 2022, 44(1): 245-260. ] | |
| [26] | 樊星, 秦圆圆, 高翔. IPCC第六次评估报告第一工作组报告主要结论解读及建议[J]. 环境保护, 2021, 49(增刊2): 44-48. |
| [Fan Xing, Qin Yuanyuan, Gao Xiang. Interpretation and suggestions on the main conclusions of the IPCC sixth assessment report by working group I[J]. Environmental Protection, 2021, 49(Suppl. 2): 44-48. ] | |
| [27] | 丁文荣, 李孝川, 陈相标. 珠江源区植被变化特征及其影响因素研究[J]. 人民长江, 2024, 55(3): 83-88, 96. |
| [Ding Wenrong, Li Xiaochuan, Chen Xiangbiao. Dynamic characteristics and attribution of vegetation in source region of Pearl River[J]. Yangtze River, 2024, 55(3): 83-88, 96. ] | |
| [28] | Mann H B. Nonparametric tests against trend[J]. Econometrica: Journal of the Econometric Society, 1945: 245-259. |
| [29] | Wang J F, Li X H, Christakos G, et al. Geographical detectors-based health risk assessment and its application in the neural tube defects study of the Heshun Region, China[J]. International Journal of Geographical Information Science, 2010, 24(1): 107-127. |
| [30] | 李佳, 彭泰来, 刘寅学, 等. 基于SRP模型的广东省林地生态脆弱性评价[J]. 中南林业调查规划, 2024, 43(1): 33-37. |
| [Li Jia, Peng Tailai, Liu Yinxue, et al. Forest ecological vulnerability assessment of Guangdong Province based on SRP model[J]. Central South Forest Inventory and Planning, 2024, 43(1): 33-37. ] | |
| [31] | 金丽娟, 许泉立. 基于SRP模型的四川省生态脆弱性评价[J]. 生态科学, 2022, 41(2): 156-165. |
| [Jin Lijuan, Xu Quanli. Ecological vulnerability assessment of Sichuan Province based on SRP model[J]. Ecological Science, 2022, 41(2): 156-165. ] | |
| [32] |
卓静, 胡皓, 何慧娟, 等. 陕北黄土高原生态脆弱性时空变异及驱动因素分析[J]. 干旱区地理, 2023, 46(11): 1768-1777.
doi: 10.12118/j.issn.1000-6060.2023.027 |
|
[Zhuo Jing, Hu Hao, He Huijuan, et al. Spatiotemporal variation and driving factors of ecological vulnerability in the Loess Plateau of northern Shaanxi[J]. Arid Land Geography, 2023, 46(11): 1768-1777. ]
doi: 10.12118/j.issn.1000-6060.2023.027 |
|
| [33] |
黄越, 程静, 王鹏. 中国北方农牧交错区生态脆弱性时空演变格局与驱动因素——以盐池县为例[J]. 干旱区地理, 2021, 44(4): 1175-1185.
doi: 10.12118/j.issn.1000–6060.2021.04.29 |
|
[Huang Yue, Cheng Jing, Wang Peng. Spatiotemporal evolution pattern and driving factors of ecological vulnerability in agro-pastoral region in northern China: A case of Yanchi County in Ningxia[J]. Arid Land Geography, 2021, 44(4): 1175-1185. ]
doi: 10.12118/j.issn.1000–6060.2021.04.29 |
|
| [34] | 贾晶晶, 赵军, 王建邦, 等. 基于SRP模型的石羊河流域生态脆弱性评价[J]. 干旱区资源与环境, 2020, 34(1): 34-41. |
| [Jia Jingjing, Zhao Jun, Wang Jianbang, et al. Ecological vulnerability assessment of Shiyang River Basin based on SRP model[J]. Journal of Arid Land Resources and Environment, 2020, 34(1): 34-41. ] | |
| [35] | 邰苏日嘎拉, 王永亮, 陈国栋, 等. 基于SRP模型的内蒙古鄂伦春地区生态脆弱性评价[J]. 中国地质, 2024, 51(1): 234-247. |
| [Tai Surigala, Wang Yongliang, Chen Guodong, et al. Ecological vulnerability assessment of Oroqen region in the Inner Mongolia based on SRP model[J]. Geology in China, 2024, 51(1): 234-247. ] | |
| [36] |
饶品增, 王义成, 王芳. 三江源植被覆盖区NDVI变化及影响因素分析[J]. 草地学报, 2021, 29(3): 572-582.
doi: 10.11733/j.issn.1007-0435.2021.03.019 |
|
[Rao Pinzeng, Wang Yicheng, Wang Fang. Analysis on the NDVI change and influence factors of vegetation cover in the Three-River Headwaters Region[J]. Acta Agrestia Sinica, 2021, 29(3): 572-582. ]
doi: 10.11733/j.issn.1007-0435.2021.03.019 |
|
| [37] | 张青. 三江源地区植被覆盖时空变化特征及其影响因素研究[D]. 郑州: 郑州大学, 2022. |
| [Zhang Qing. Spatial-temporal variation of vegetation cover and its influencing factors in the Three-River Headwaters Region[D]. Zhengzhou: Zhengzhou University, 2022. ] | |
| [38] | Feng X J, Tian J, Wang Y X, et al. Spatio-temporal variation and climatic driving factors of vegetation coverage in the Yellow River Basin from 2001 to 2020 based on kNDVI[J]. Forests, 2023, 14(3): 620, doi: 10.3390/f14030620. |
| [1] | MA Qimin, DU Hanrui, WANG Zhengming, LONG Yinping. Vegetation coverage characteristics of different topography and landforms in ten tributaries of the Ordos Plateau [J]. Arid Land Geography, 2025, 48(3): 434-443. |
| [2] | ZHANG Haidong, LI Chongbo, MENG Liqi, Adilai SAITINIYAZI, JU Xifeng. Evolutionary characteristics of NDVI in the Kashi Delta and its response to the climate [J]. Arid Land Geography, 2025, 48(2): 296-307. |
| [3] | CHANG Wenjing, CONG Shixiang, WANG Rongrong, DING Xudong, YU Hailong, HUANG Juying. Quantitative analysis of NDVI changes in Mu Us Sandy Land by climate change and human activities [J]. Arid Land Geography, 2025, 48(1): 63-74. |
| [4] | LI Junjia, ZHAO Meifeng. Spatial evolution and influencing mechanism of high-quality development in ethnic minority areas of China [J]. Arid Land Geography, 2024, 47(3): 496-505. |
| [5] | MU Shilei, YANG Yuhuan, Wuritaoketaohu . Spatial differentiation pattern and influencing factors of national desert (rocky desert) parks [J]. Arid Land Geography, 2024, 47(2): 356-368. |
| [6] | WANG Ziyan, NIU Liqin, CHENG Zhanhong. Temporal and spatial evolution of ecological welfare performance and its influencing factors: A case of Shanxi Province [J]. Arid Land Geography, 2024, 47(12): 2152-2163. |
| [7] | YANG Xiaoling, DING Wenkui, ZHOU Hua, LI Yanying, CHEN Haibei. Normalized difference vegetation index change and its driving factors in Shiyang River Basin [J]. Arid Land Geography, 2024, 47(10): 1735-1744. |
| [8] | LI Jianhui, CHEN Lin, DANG Zheng. Spatial pattern and influencing factors of patriotic education bases in the Yellow River Basin [J]. Arid Land Geography, 2023, 46(9): 1536-1544. |
| [9] | ZHANG Gangdong, BAO Gang, HUANG Xiaojun, YUAN Zhihui, WEN Durina. Asymmetrical warming in winter and spring and its effect on start of growing season and spring NDVI in Mongolia [J]. Arid Land Geography, 2023, 46(8): 1238-1249. |
| [10] | AI Liya, WANG Yongfang, GUO Enliang, YIN Shan, GU Xiling. NDVI change and its influencing factors of Daqingshan National Nature Reserve based on GEE [J]. Arid Land Geography, 2023, 46(8): 1279-1290. |
| [11] | ZHANG Hao, HAN Zenglin, QIAO Guorong, WANG Hui, WANG Hongye, DUAN Ye. Patterns and influencing factors of tourism economic linkages between cities in the Yellow River Basin [J]. Arid Land Geography, 2023, 46(8): 1344-1354. |
| [12] | KANG Ligang, CAO Shengkui, CAO Guangchao, YAN Li, CHEN Lianxuan, LI Wenbin, ZHAO Haoran. Spatiotemporal variation of land surface temperature in Qinghai Lake Basin [J]. Arid Land Geography, 2023, 46(7): 1084-1097. |
| [13] | LUO Jiayan, ZHANG Jing, XU Mengran, MO Yu, TONG Liga. Vegetation dynamic and its driving force and multi-scenario prediction in Otindag Sandy Land [J]. Arid Land Geography, 2023, 46(4): 614-624. |
| [14] | ZHU Lei, LI Yannan, HU Jing, TIAN Xiaobo, XU Jiahui, QING Qi. Multi-scale characteristics and influencing mechanism of spatial pattern on research and practice bases in China [J]. Arid Land Geography, 2023, 46(4): 625-635. |
| [15] | CHENG Jing,WANG Peng,CHEN Hongxiang,HAN Yonggui. Spatiotemporal evolution of habitat quality in the Weihe River Basin and its topographic gradient effects and influencing factors [J]. Arid Land Geography, 2023, 46(3): 481-491. |
|
||