- May. 13, 2025
Arid Land Geography ›› 2025, Vol. 48 ›› Issue (4): 739-752.doi: 10.12118/j.issn.1000-6060.2024.404
• Regional Development • Previous Articles
LI Songrui1( ), LIN Qiuping1,2(), YANG Shangguang3
Received:2024-07-04
Revised:2024-08-30
Online:2025-04-25
Published:2025-04-18
Contact:
LIN Qiuping
E-mail:lisongrui2021@163.com;lqpxjcd@foxmail.com
LI Songrui, LIN Qiuping, YANG Shangguang. Multi-scale evolution characteristics and influencing factors of spatial layout of logistics enterprises in Xinjiang[J].Arid Land Geography, 2025, 48(4): 739-752.
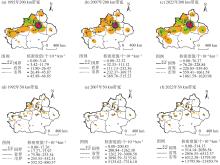
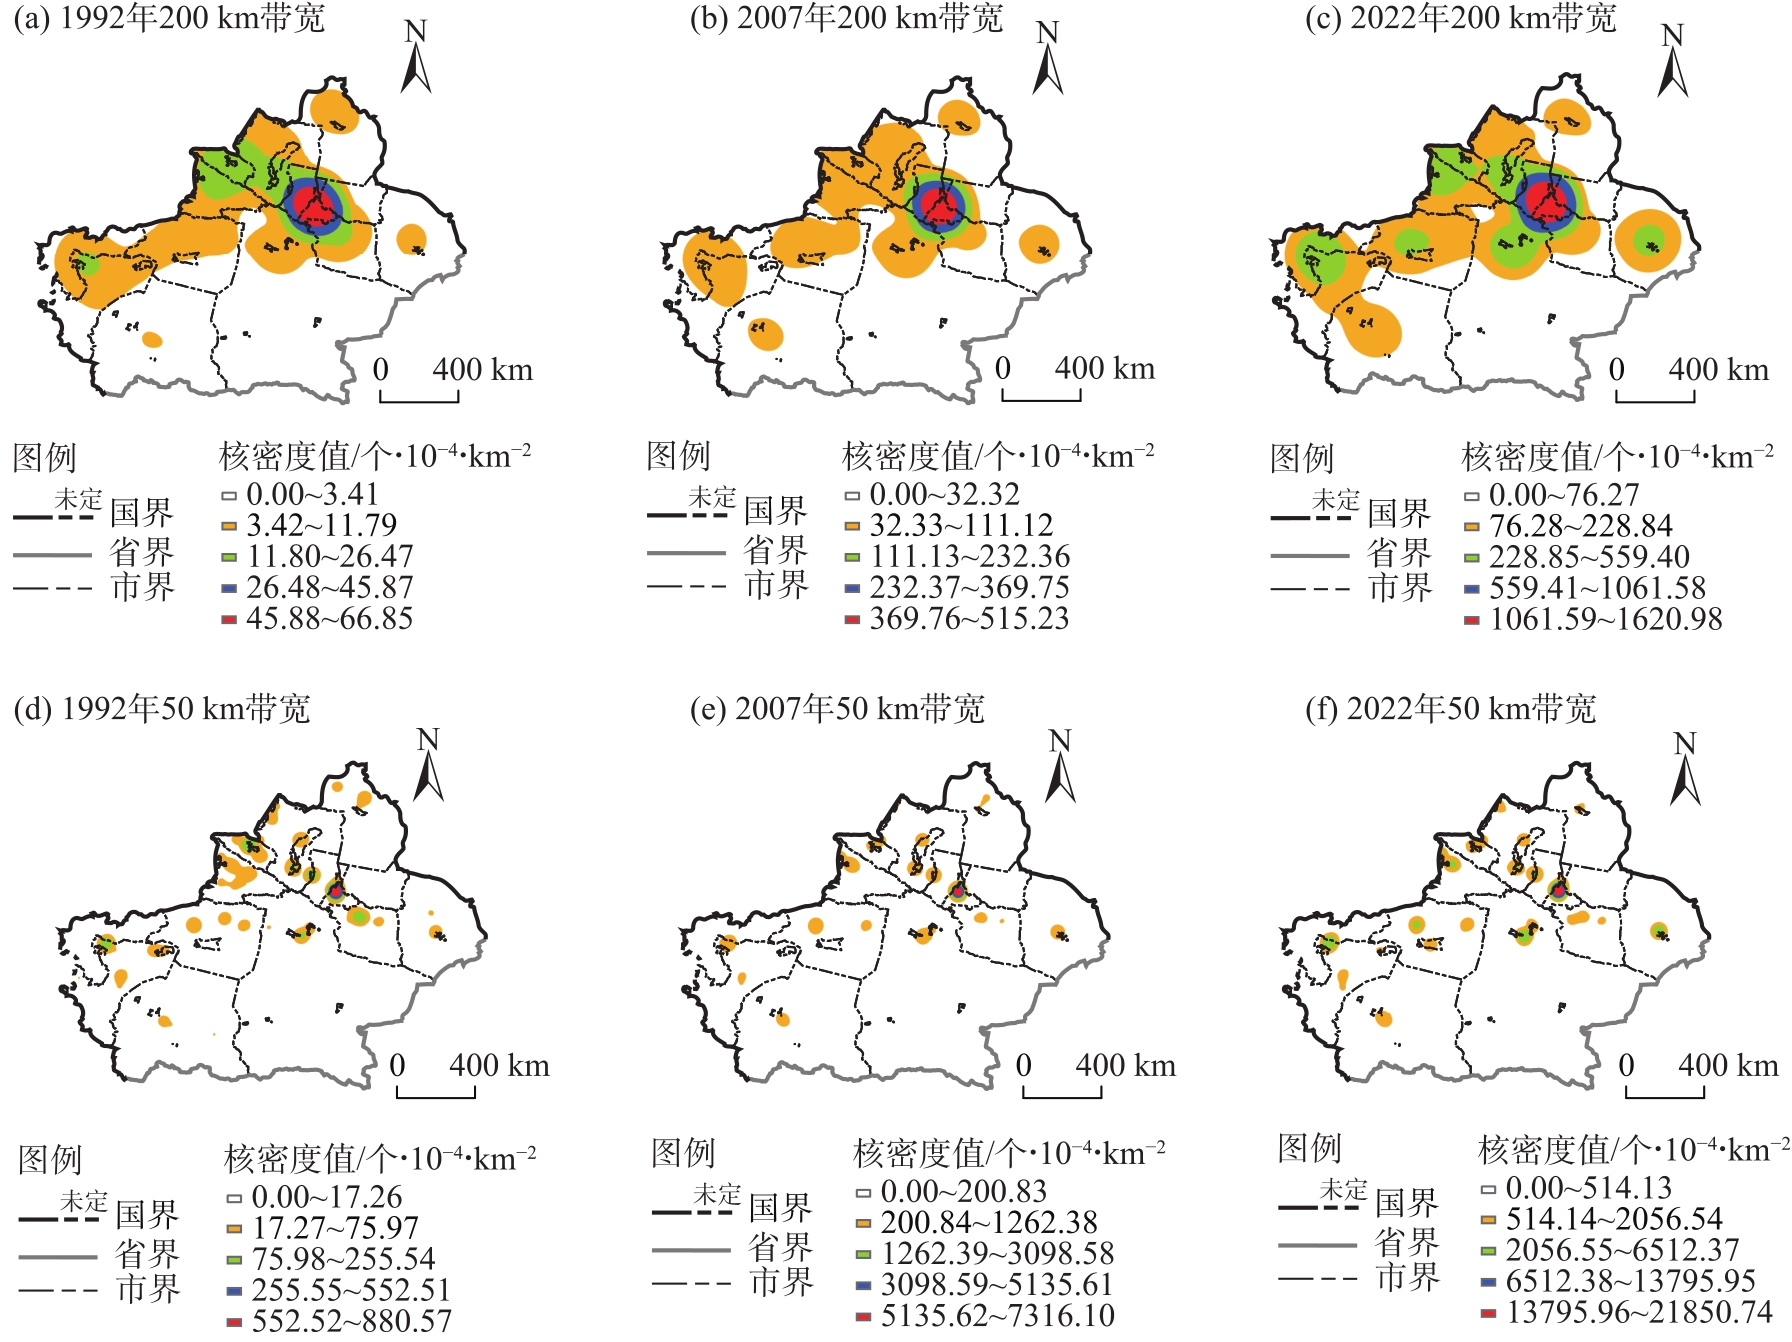
Fig. 1
Spatial distributions of kernel density of logistics enterprise"
Tab. 1
Global Moran’s index at the county scale"
| 年份 | 莫兰指数 | Z值 | P值 | 年份 | 莫兰指数 | Z值 | P值 |
|---|---|---|---|---|---|---|---|
| 1992 | 0.214 | 3.783 | 0.000 | 2008 | 0.254 | 4.785 | 0.000 |
| 1994 | 0.194 | 3.436 | 0.001 | 2010 | 0.268 | 5.056 | 0.000 |
| 1996 | 0.233 | 4.142 | 0.000 | 2012 | 0.240 | 4.552 | 0.000 |
| 1998 | 0.139 | 2.518 | 0.012 | 2014 | 0.212 | 3.993 | 0.000 |
| 2000 | 0.122 | 2.209 | 0.027 | 2016 | 0.139 | 2.572 | 0.010 |
| 2002 | 0.141 | 2.552 | 0.011 | 2018 | 0.129 | 2.377 | 0.017 |
| 2004 | 0.193 | 3.479 | 0.001 | 2020 | 0.161 | 2.918 | 0.004 |
| 2006 | 0.221 | 4.041 | 0.000 | 2022 | 0.186 | 3.363 | 0.001 |
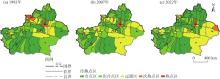
Fig. 2
County-scale hotspot analysis of logistics enterprises in Xinjiang"
Tab. 2
Global Moran’s index at the grid scale"
| 年份 | 莫兰指数 | Z值 | P值 | 年份 | 莫兰指数 | Z值 | P值 |
|---|---|---|---|---|---|---|---|
| 1992 | 0.167 | 7.290 | 0.000 | 2008 | 0.131 | 6.017 | 0.000 |
| 1994 | 0.161 | 7.103 | 0.000 | 2010 | 0.138 | 6.219 | 0.000 |
| 1996 | 0.151 | 6.691 | 0.000 | 2012 | 0.141 | 6.212 | 0.000 |
| 1998 | 0.139 | 5.839 | 0.000 | 2014 | 0.136 | 5.968 | 0.000 |
| 2000 | 0.138 | 5.620 | 0.000 | 2016 | 0.129 | 5.423 | 0.000 |
| 2002 | 0.132 | 5.441 | 0.000 | 2018 | 0.134 | 5.581 | 0.000 |
| 2004 | 0.130 | 5.577 | 0.000 | 2020 | 0.141 | 5.944 | 0.000 |
| 2006 | 0.127 | 5.574 | 0.000 | 2022 | 0.141 | 6.072 | 0.000 |
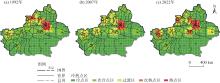
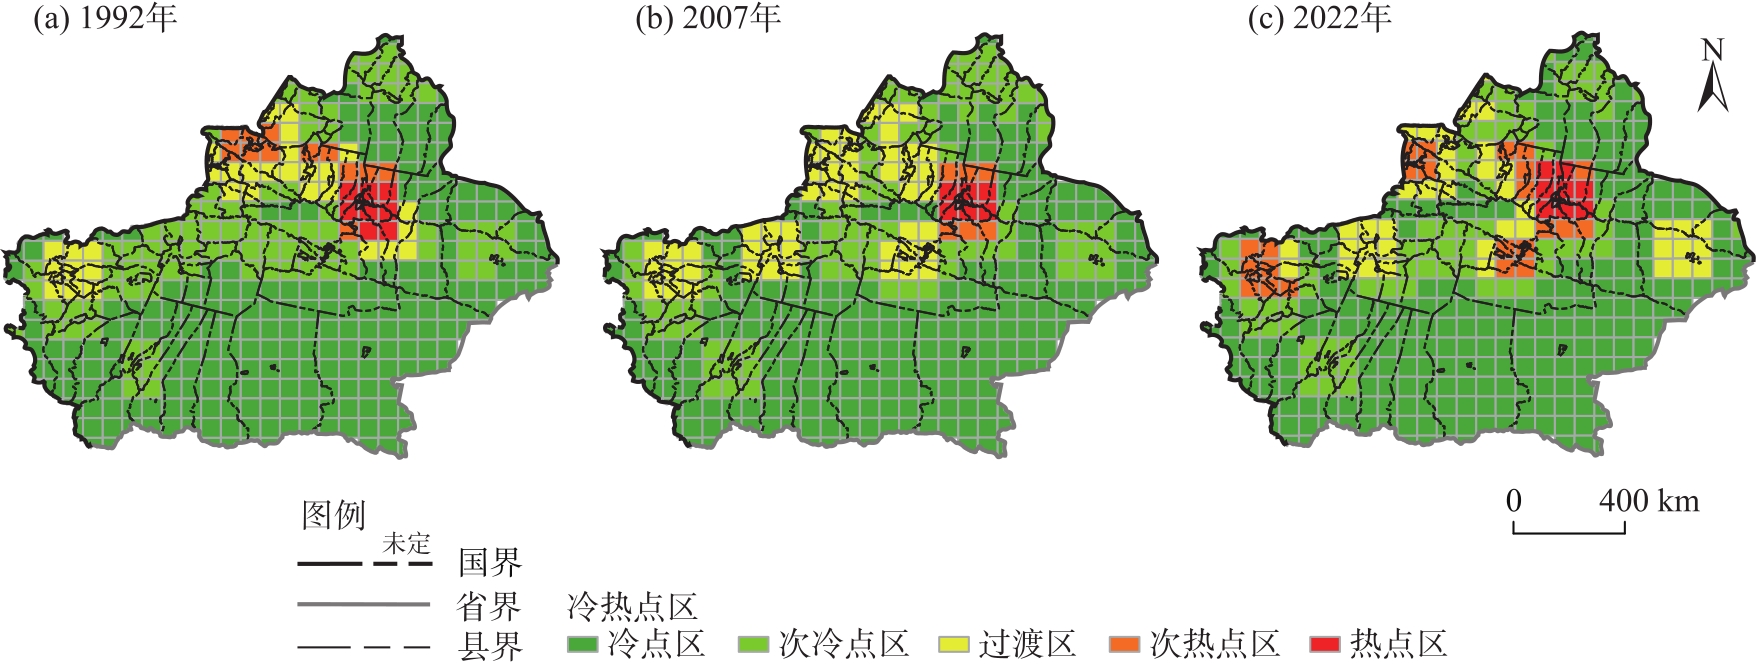
Fig. 3
Grid-scale hotspot analysis of logistics enterprises in Xinjiang"
Tab. 3
Relevant indicators and explanatory power of the spatial distribution of logistics enterprises"
| 一级指标 | 二级指标 | 单位 | 符号 | 县域q值 | 网格q值 |
|---|---|---|---|---|---|
| 集聚因素 | 物流企业距离 | km | X1 | 0.050 | 0.114*** |
| 批发市场距离 | km | X2 | 0.104** | 0.196*** | |
| 工业园区距离 | km | X3 | 0.227*** | 0.215*** | |
| 农业园区距离 | km | X4 | 0.272*** | 0.204*** | |
| 电商园区距离 | km | X5 | 0.322*** | 0.352*** | |
| 经济因素 | 经济发展水平(灯光数据均值) | - | X6 | 0.439*** | 0.209*** |
| 人口密度 | 人·km-2 | X7 | 0.448*** | 0.301*** | |
| 交通因素 | 交通干线可达性(5级) | - | X8 | 0.171*** | 0.006 |
| 火车站距离 | km | X9 | 0.192*** | 0.178*** | |
| 机场距离 | km | X10 | 0.142*** | 0.149*** | |
| 政策因素 | 物流园区距离 | km | X11 | 0.282*** | 0.256*** |
| 口岸距离 | km | X12 | 0.292*** | 0.210*** | |
| 综合保税区距离 | km | X13 | 0.412*** | 0.317*** | |
| 自然环境因素 | 山地面积占比 | % | X14 | 0.031 | 0.011 |
| 沙漠、戈壁面积占比 | % | X15 | 0.101** | 0.032** | |
| 年结冰时间占比 | % | X16 | 0.060 | 0.077*** |
Tab. 4
Interaction detection results of different influencing factors"
| 因素 | 县域 | 网格 | 因素 | 县域 | 网格 | 因素 | 县域 | 网格 | 因素 | 县域 | 网格 |
|---|---|---|---|---|---|---|---|---|---|---|---|
| X1∩X2 | BE | BE | X3∩X5 | BE | BE | X5∩X12 | BE | BE | X8∩X15 | NE | NE |
| X1∩X3 | BE | BE | X3∩X6 | BE | BE | X5∩X13 | BE | BE | X8∩X16 | NE | NE |
| X1∩X4 | BE | BE | X3∩X7 | BE | BE | X5∩X14 | BE | NE | X9∩X10 | BE | BE |
| X1∩X5 | BE | BE | X3∩X8 | BE | NE | X5∩X15 | BE | NE | X9∩X11 | BE | BE |
| X1∩X6 | BE | BE | X3∩X9 | BE | BE | X5∩X16 | NE | BE | X9∩X12 | BE | BE |
| X1∩X7 | BE | BE | X3∩X10 | BE | BE | X6∩X7 | BE | BE | X9∩X13 | BE | BE |
| X1∩X8 | NE | NE | X3∩X11 | BE | BE | X6∩X8 | BE | NE | X9∩X14 | NE | NE |
| X1∩X9 | BE | BE | X3∩X12 | BE | BE | X6∩X9 | BE | BE | X9∩X15 | NE | NE |
| X1∩X10 | BE | BE | X3∩X13 | BE | BE | X6∩X10 | BE | BE | X9∩X16 | NE | NE |
| X1∩X11 | BE | BE | X3∩X14 | NE | NE | X6∩X11 | BE | BE | X10∩X11 | BE | BE |
| X1∩X12 | BE | BE | X3∩X15 | BE | NE | X6∩X12 | BE | BE | X10∩X12 | BE | BE |
| X1∩X13 | BE | BE | X3∩X16 | NE | BE | X6∩X13 | BE | BE | X10∩X13 | BE | BE |
| X1∩X14 | NE | NE | X4∩X5 | BE | BE | X6∩X14 | BE | NE | X10∩X14 | NE | NE |
| X1∩X15 | NE | NE | X4∩X6 | BE | BE | X6∩X15 | BE | NE | X10∩X15 | NE | NE |
| X1∩X16 | NE | BE | X4∩X7 | BE | BE | X6∩X16 | BE | NE | X10∩X16 | NE | NE |
| X2∩X3 | BE | BE | X4∩X8 | BE | NE | X7∩X8 | BE | NE | X11∩X12 | BE | BE |
| X2∩X4 | BE | BE | X4∩X9 | BE | BE | X7∩X9 | BE | BE | X11∩X13 | BE | BE |
| X2∩X5 | BE | BE | X4∩X10 | BE | BE | X7∩X10 | BE | BE | X11∩X14 | BE | NE |
| X2∩X6 | BE | BE | X4∩X11 | BE | BE | X7∩X11 | BE | BE | X11∩X15 | NE | BE |
| X2∩X7 | BE | BE | X4∩X12 | BE | BE | X7∩X12 | BE | BE | X11∩X16 | NE | BE |
| X2∩X8 | BE | NE | X4∩X13 | BE | BE | X7∩X13 | BE | BE | X12∩X13 | BE | BE |
| X2∩X9 | BE | BE | X4∩X14 | BE | NE | X7∩X14 | BE | NE | X12∩X14 | NE | NE |
| X2∩X10 | BE | BE | X4∩X15 | BE | NE | X7∩X15 | BE | NE | X12∩X15 | BE | BE |
| X2∩X11 | BE | BE | X4∩X16 | NE | BE | X7∩X16 | NE | NE | X12∩X16 | NE | BE |
| X2∩X12 | BE | BE | X5∩X6 | BE | BE | X8∩X9 | BE | NE | X13∩X14 | NE | BE |
| X2∩X13 | BE | BE | X5∩X7 | BE | BE | X8∩X10 | BE | NE | X13∩X15 | BE | BE |
| X2∩X14 | NE | NE | X5∩X8 | BE | NE | X8∩X11 | BE | NE | X13∩X16 | NE | BE |
| X2∩X15 | NE | BE | X5∩X9 | BE | BE | X8∩X12 | BE | NE | X14∩X15 | NE | NE |
| X2∩X16 | NE | BE | X5∩X10 | BE | BE | X8∩X13 | BE | NE | X14∩X16 | NE | NE |
| X3∩X4 | BE | BE | X5∩X11 | BE | BE | X8∩X14 | BE | NE | X15∩X16 | NE | NE |
Tab. 5
County-scale estimation results of OLS, GWR, and MGWR models"
| 变量 | OLS模型 | GWR模型 | MGWR模型 | |||||
|---|---|---|---|---|---|---|---|---|
| 系数 | VIF | 均值 | 带宽 | 均值 | 带宽 | |||
| 常数项 | - | - | -0.013** | 53 | -0.047*** | 44 | ||
| 电商园区距离 | -0.177** | 2.02 | 0.024** | 53 | 0.023** | 79 | ||
| 经济发展水平 | 0.404*** | 3.95 | 0.079** | 53 | 0.236** | 104 | ||
| 人口密度 | 0.155 | 3.80 | 0.300** | 53 | 0.040** | 106 | ||
| 口岸距离 | 0.142 | 3.38 | 0.283** | 53 | 0.397*** | 44 | ||
| 综合保税区距离 | -0.374*** | 3.82 | -0.771** | 53 | -0.918*** | 44 | ||
| AICc | 222.344 | 153.930 | 132.178 | |||||
| RSS | 43.077 | 16.784 | 15.134 | |||||
| R2 | 0.601 | 0.845 | 0.860 | |||||
| 调整后R2 | 0.582 | 0.812 | 0.837 | |||||
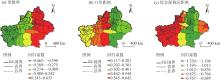
Fig. 4
County-scale spatial distributions of local variable coefficients"
Tab. 6
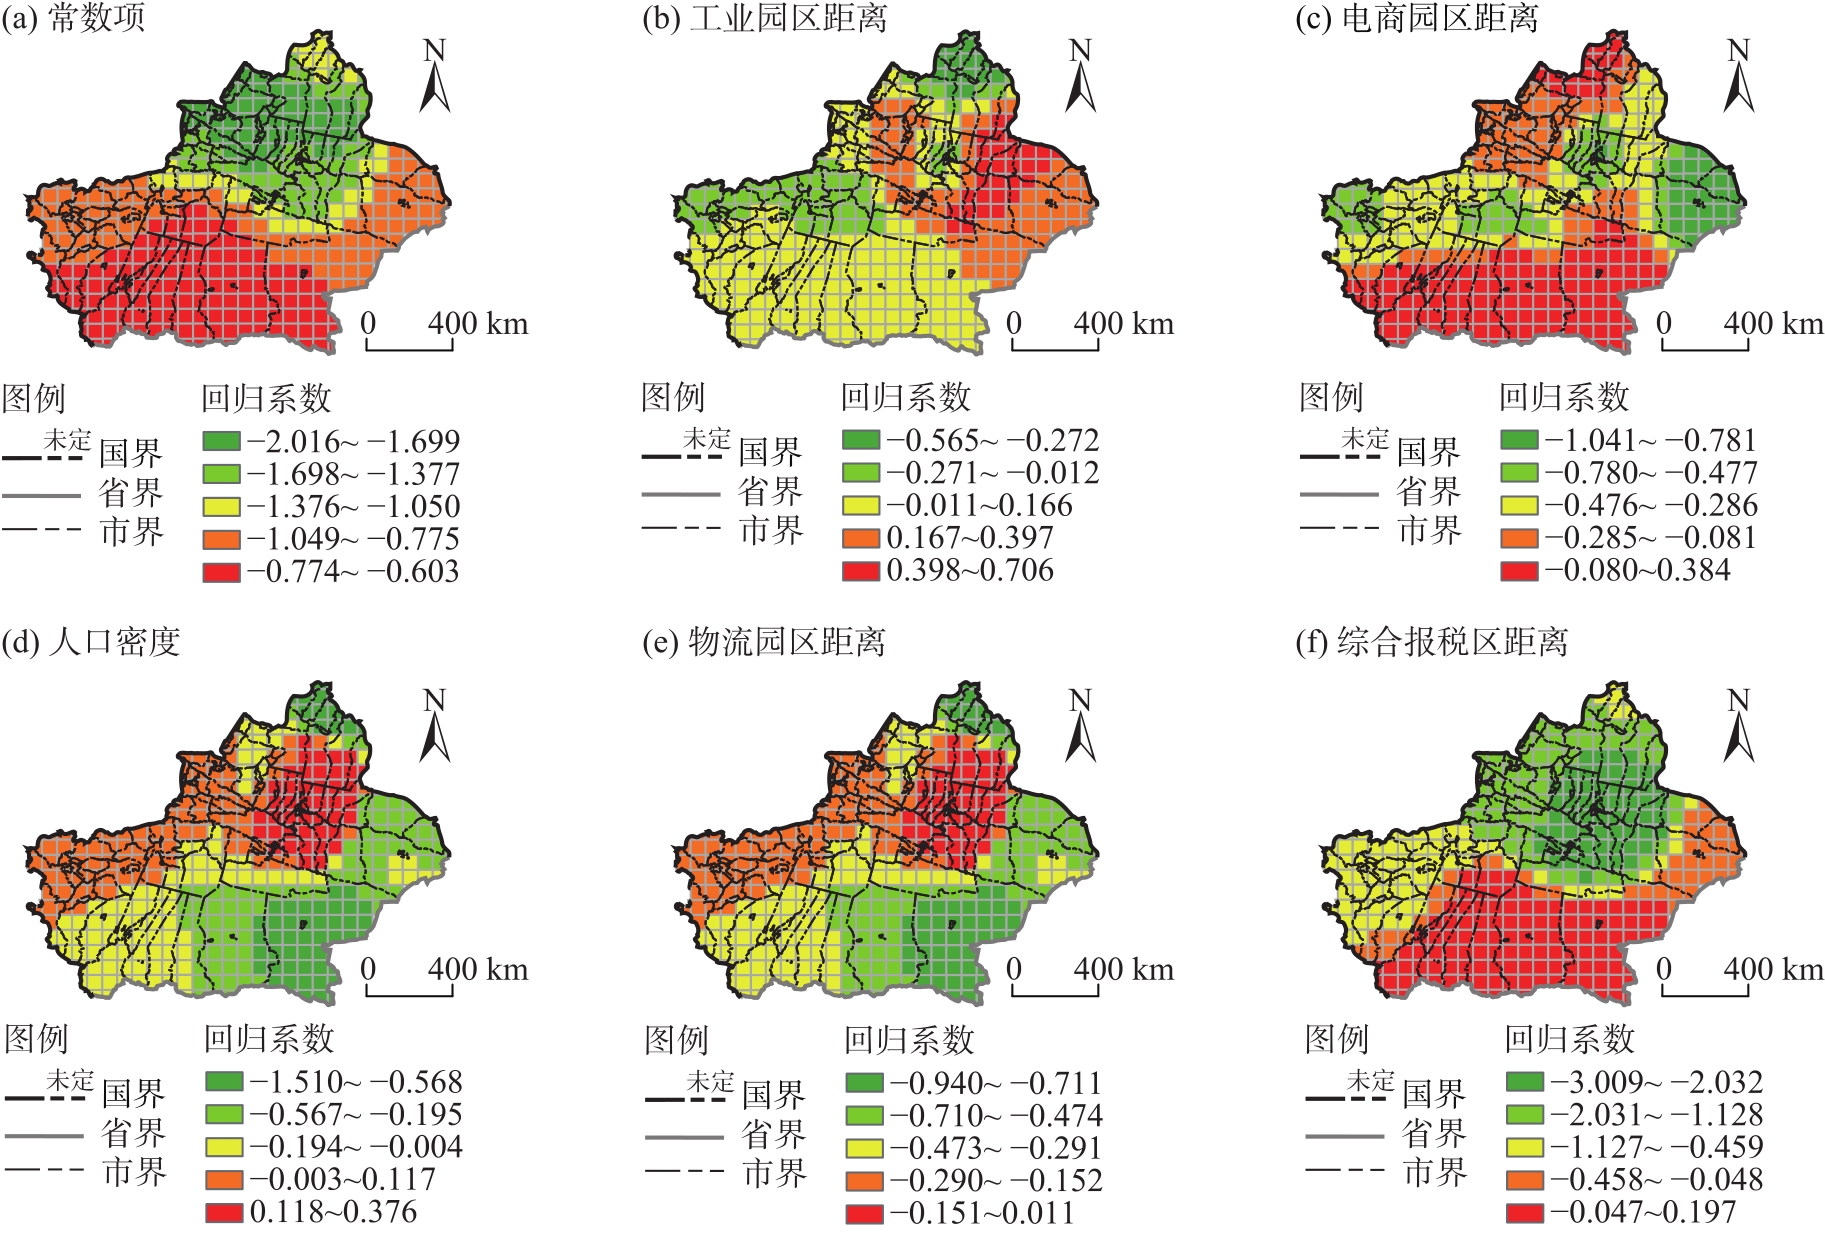
Grid-scale estimation results of OLS, GWR, and MGWR models"
| 变量 | OLS模型 | GWR模型 | MGWR模型 | |||||
|---|---|---|---|---|---|---|---|---|
| 系数 | VIF | 均值 | 带宽 | 均值 | 带宽 | |||
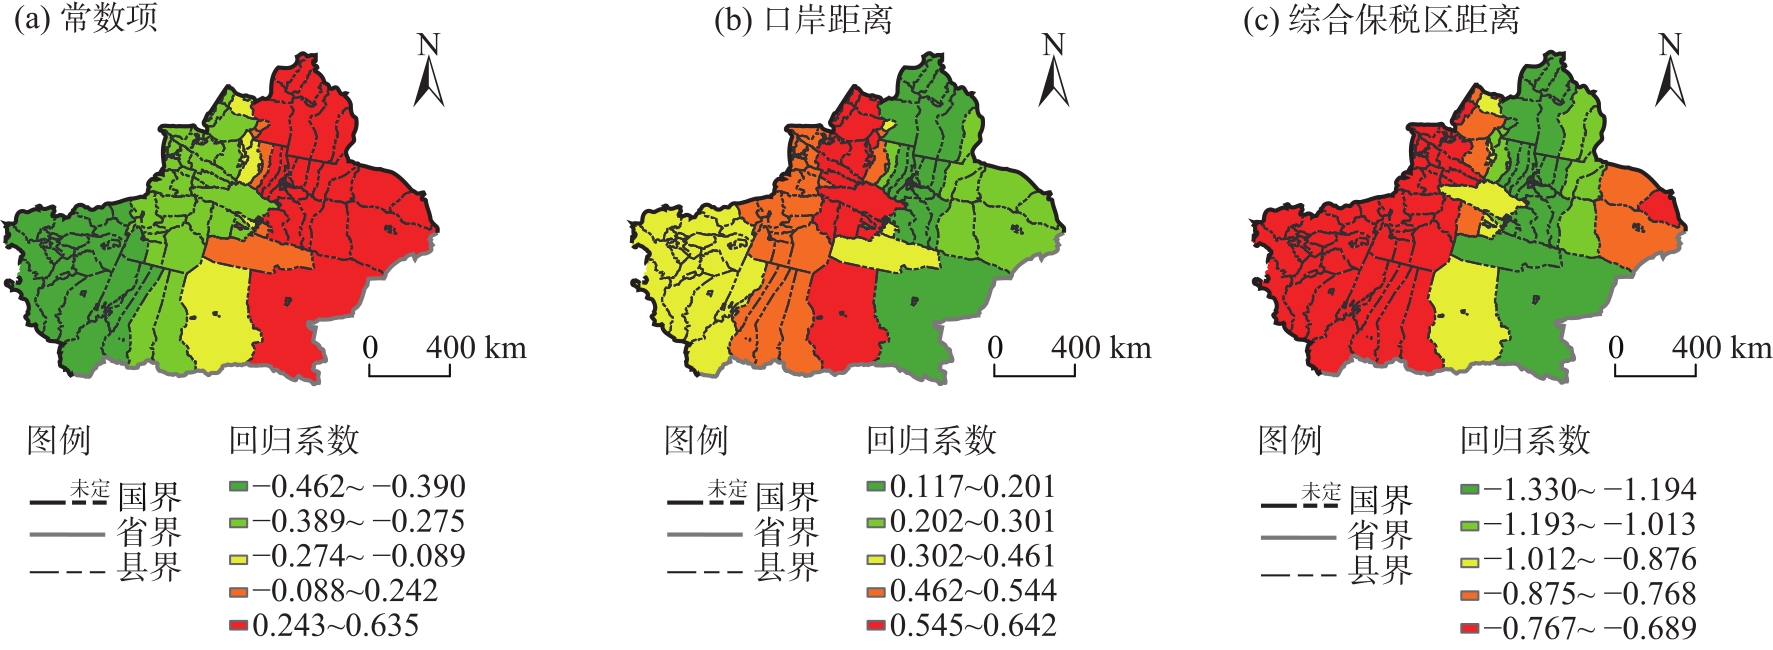
| 常数项 | - | - | -0.896*** | 53 | -1.063*** | 43 | ||
| 工业园区距离 | -0.130* | 3.66 | 0.026*** | 53 | 0.104*** | 43 | ||
| 电商园区距离 | -0.277*** | 4.42 | -0.393*** | 53 | -0.257*** | 43 | ||
| 人口密度 | 0.440*** | 1.16 | 0.242*** | 53 | -0.175*** | 43 | ||
| 物流园区距离 | 0.274*** | 6.98 | -0.159*** | 53 | -0.331*** | 43 | ||
| 综合保税区距离 | -0.260*** | 3.50 | -0.689*** | 53 | -0.828*** | 43 | ||
| AICc | 846.484 | 207.262 | 154.745 | |||||
| RSS | 206.053 | 24.225 | 21.382 | |||||
| R2 | 0.442 | 0.934 | 0.942 | |||||
| 调整后R2 | 0.434 | 0.920 | 0.930 | |||||
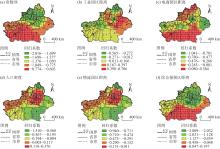
Fig. 5
Spatial distributions of grid-scale variable coefficients"
| [1] | O’Connor K. Global city regions and the location of logistics activity[J]. Journal of Transport Geography, 2010, 18(3): 354-362. |
| [2] | Julie C. Concentration and decentralization: The new geography of freight distribution in US metropolitan areas[J]. Journal of Transport Geography, 2010, 18(3): 363-371. |
| [3] |
王成金, 张梦天. 中国物流企业的布局特征与形成机制[J]. 地理科学进展, 2014, 33(1): 134-144.
doi: 10.11820/dlkxjz.2014.01.015 |
|
[Wang Chengjin, Zhang Mengtian. Spatial pattern and its mechanism of modern logistics companies in China[J]. Progress in Geography, 2014, 33(1): 134-144.]
doi: 10.11820/dlkxjz.2014.01.015 |
|
| [4] | 潘方杰, 王宏志, 宋明洁, 等. 基于GIS的中国A级物流企业时空演变特征及其影响因素[J]. 长江流域资源与环境, 2020, 29(10): 2186-2199. |
| [Pan Fangjie, Wang Hongzhi, Song Mingjie, et al. Study on the spatio-temporal evolutionary characteristics and the influencing factors of A-grade logistics companies in China based on GIS[J]. Resources and Environment in the Yangtze Basin, 2020, 29(10): 2186-2199.] | |
| [5] | Sun B W, Li H M, Zhao Q. Logistics agglomeration and logistics productivity in the USA[J]. The Annals of Regional Science, 2018, 61(2): 273-293. |
| [6] | Rivera L, Sheffi Y, Welsch R. Logistics agglomeration in the US[J]. Transportation Research Part A, 2014, 59(11): 222-238. |
| [7] | 张璐璐, 赵金丽, 宋金平. 京津冀城市群物流企业空间格局演化及影响因素[J]. 经济地理, 2019, 39(3): 125-133. |
| [Zhang Lulu, Zhao Jinli, Song Jinping. Spatial evolution and influencing factors of logistics enterprises in Beijing-Tianjin-Hebei urban agglomeration[J]. Economic Geography, 2019, 39(3): 125-133.] | |
| [8] | 李天宇, 陆林, 张海洲, 等. 长三角城市群A级物流企业空间演化特征及驱动因素[J]. 经济地理, 2021, 41(11): 157-166. |
| [Li Tianyu, Lu Lin, Zhang Haizhou, et al. Evolution characteristics and driving factors of A-level logistics enterprises in the Yangtze River Delta urban agglomeration[J]. Economic Geography, 2021, 41(11): 157-166.] | |
| [9] | Zhang Y W, Kong J, Zhang Y, et al. Case study of stratification, spatial agglomeration, and unequal logistics industry development on western cities in China[J]. Journal of Urban Planning and Development, 2022, 148(2): 1-13. |
| [10] |
李国旗, 金凤君, 陈娱, 等. 基于POI的北京物流业区位特征与分异机制[J]. 地理学报, 2017, 72(6): 1091-1103.
doi: 10.11821/dlxb201706011 |
|
[Li Guoqi, Jin Fengjun, Chen Yu, et al. Location characteristics and differentiation mechanism of logistics industry based on points of interest: A case study of Beijing[J]. Acta Geographica Sinica, 2017, 72(6): 1091-1103.]
doi: 10.11821/dlxb201706011 |
|
| [11] | 张大鹏, 曹卫东, 姚兆钊, 等. 上海大都市区物流企业区位分布特征及其演化[J]. 长江流域资源与环境, 2018, 27(7): 1478-1489. |
| [Zhang Dapeng, Cao Weidong, Yao Zhaozhao, et al. Study on the distribution characteristics and evolution of logistics enterprises in Shanghai metropolitan area[J]. Resources and Environment in the Yangtze Basin, 2018, 27(7): 1478-1489.] | |
| [12] | 千庆兰, 陈颖彪, 李雁, 等. 广州市物流企业空间布局特征及其影响因素[J]. 地理研究, 2011, 30(7): 1254-1261. |
| [Qian Qinglan, Chen Yingbaio, Li Yan, et al. Spatial distribution of logistics enterprises in Guangzhou and its influencing factors[J]. Geographical Research, 2011, 30(7): 1254-1261.] | |
| [13] | 曹卫东. 城市物流企业区位分布的空间格局及其演化——以苏州市为例[J]. 地理研究, 2011, 30(11): 1997-2007. |
| [Cao Weidong. Spatial pattern and location evolution of urban logistics enterprises: Taking Suzhou as an example[J]. Economic Geography, 2011, 30(11): 1997-2007.] | |
| [14] |
张圣忠, 柴廷熠. 西安市物流企业空间格局演化及影响因素分析[J]. 世界地理研究, 2021, 30(6): 1275-1285.
doi: 10.3969/j.issn.1004-9479.2021.06.2020101 |
|
[Zhang Shengzhong, Chai Tingyi. Spatial evolution and influencing factors of logistics enterprises in Xi’an[J]. World Regional Studies, 2021, 30(6): 1275-1285.]
doi: 10.3969/j.issn.1004-9479.2021.06.2020101 |
|
| [15] | 程秀娟, 李晶晶, 杨洁辉, 等. 河南省物流业空间格局——基于百度地图和面板数据[J]. 人文地理, 2018, 33(5): 114-122. |
| [Cheng Xiujuan, Li Jingjing, Yang Jiehui, et al. Spatial patterns of Henan logistics industry based on a geographic analysis of Baidu maps and panel data[J]. Human Geography, 2018, 33(5): 114-122.] | |
| [16] |
蒋天颖, 伍婵提, 陈改改. 浙江省A级物流企业时空格局特征研究[J]. 地理科学, 2017, 37(11): 1720-1727.
doi: 10.13249/j.cnki.sgs.2017.11.014 |
|
[Jiang Tianying, Wu Chanti, Chen Gaigai. Spatio-temporal pattern of Zhejiang A-class logistics enterprise[J]. Scientia Geographica Sinica, 2017, 37(11): 1720-1727.]
doi: 10.13249/j.cnki.sgs.2017.11.014 |
|
| [17] | 陈治亚, 周于轶. 基于POI的物流业空间集聚特征分析——以浙江省为例[J]. 铁道科学与工程学报, 2022, 19(10): 2862-2872. |
| [Chen Zhiya, Zhou Yuyi. Analysis of spatial agglomeration characteristics of logistics industry based on POI: Taking Zhejiang Province as an example[J]. Journal of Railway Science and Engineering, 2022, 19(10): 2862-2872.] | |
| [18] | 李小建. 经济地理学研究中的尺度问题[J]. 经济地理, 2005, 25(4): 433-436. |
| [Li Xiaojian. Scale and economic geography inquiry[J]. Economic Geography, 2005, 25(4): 433-436.] | |
| [19] |
林秋平, 李松芮, 杨上广, 等. 乌鲁木齐市物流企业区位时空演化、影响因素和发展策略研究[J]. 干旱区地理, 2024, 47(7): 1252-1262.
doi: 10.12118/j.issn.1000-6060.2023.574 |
|
[Lin Qiuping, Li Songrui, Yang Shangguang, et al. Spatiotemporal evolution, influencing factors, and development strategies of logistics enterprise location in Urumqi City[J]. Arid Land Geography, 2024, 47(7): 1252-1262.]
doi: 10.12118/j.issn.1000-6060.2023.574 |
|
| [20] |
潘方杰, 万庆, 冯兵, 等. 中国物流企业空间格局及多尺度特征分析[J]. 经济地理, 2021, 41(6): 97-106.
doi: 10.15957/j.cnki.jjdl.2021.06.011 |
|
[Pan Fangjie, Wan Qing, Feng Bin, et al. Multi-scale analysis of spatial pattern characteristic of the logistics companies in China[J]. Economic Geography, 2021, 41(6): 97-106.]
doi: 10.15957/j.cnki.jjdl.2021.06.011 |
|
| [21] | 蒋天颖, 史亚男. 宁波市物流企业空间格局演化及影响因素[J]. 经济地理, 2015, 35(10): 130-138. |
| [Jiang Tianying, Shi Ya’nan. The spatial pattern evolution and influencing factors of logistics enterprises in Ningbo[J]. Economic Geography, 2015, 35(10): 130-138.] | |
| [22] |
王瑞, 蒋天颖, 王帅. 宁波市港口物流企业空间格局及区位选择[J]. 地理科学, 2018, 38(5): 691-698.
doi: 10.13249/j.cnki.sgs.2018.05.006 |
|
[Wang Rui, Jiang Tianying, Wang Shuai. Spatial pattern and location selection of port logistics enterprises in Ningbo[J]. Scientia Geographica Sinica, 2018, 38(5): 691-698.]
doi: 10.13249/j.cnki.sgs.2018.05.006 |
|
| [23] | Liu S J, Zhu C J, He N N, et al. Role of mountains and rivers in the formation of logistics enterprises’ spatial pattern in the central urban areas of Chongqing[J]. Journal of Mountain Science, 2022, 19(7): 2060-2074. |
| [24] |
王劲峰, 徐成东. 地理探测器: 原理与展望[J]. 地理学报, 2017, 72(1): 116-134.
doi: 10.11821/dlxb201701010 |
|
[Wang Jinfeng, Xu Chengdong. Geodetector: Principle and prospective[J]. Acta Geographica Sinica, 2017, 72(1): 116-134.]
doi: 10.11821/dlxb201701010 |
|
| [25] | Fotheringham A S, Yang W B, Kang W. Multiscale geographically weighted regression (MGWR)[J]. Annals of the American Association of Geographers, 2017, 107(6): 1247-1265. |
| [26] | Yu H C, Fotheringham A S, Li Z Q, et al. Inference in multiscale geographically weighted regression[J]. Geographical Analysis, 2020, 52(1): 87-106. |
| [27] | Yang R, Xu Q, Long H L. Spatial distribution characteristics and optimized reconstruction analysis of China’s rural settlements during the process of rapid urbanization[J]. Journal of Rural Studies, 2016, 47: 413-424. |
| [28] |
杨忍, 刘彦随, 龙花楼, 等. 中国村庄空间分布特征及空间优化重组解析[J]. 地理科学, 2016, 36(2): 170-179.
doi: 10.13249/j.cnki.sgs.2016.02.002 |
|
[Yang Ren, Liu Yanshui, Long Hualou, et al. Spatial distribution characteristics and optimized reconstructing analysis of rural settlement in China[J]. Scientia Geographica Sinica, 2016, 36(2): 170-179.]
doi: 10.13249/j.cnki.sgs.2016.02.002 |
|
| [29] |
刘敏, 郝炜. 山西省国家A级旅游景区空间分布影响因素研究[J]. 地理学报, 2020, 75(4): 878-888.
doi: 10.11821/dlxb202004015 |
|
[Liu Min, Hao Wei. Spatial distribution and its influencing factors of national A-level tourist attractions in Shanxi Province[J]. Acta Geographica Sinica, 2020, 75(4): 878-888.]
doi: 10.11821/dlxb202004015 |
|
| [30] |
张佰发, 苗长虹, 冉钊, 等. 核心-边缘视角下的黄河流域县域经济差异研究[J]. 地理学报, 2023, 78(6): 1355-1375.
doi: 10.11821/dlxb202306003 |
|
[Zhang Baifa, Miao Changhong, Ran Zhao, et al. Economic differences among counties in the Yellow River Basin from the core-periphery perspective[J]. Acta Geographica Sinica, 2023, 78(6): 1355-1375.]
doi: 10.11821/dlxb202306003 |
|
| [31] |
周侃, 殷悦, 陈妤凡. 城市群水污染物排放的驱动因素及尺度效应[J]. 地理学报, 2022, 77(9): 2219-2235.
doi: 10.11821/dlxb202209006 |
|
[Zhou Kan, Yin Yue, Chen Yufan. Driving factors and scale effects of water pollutant discharge in the urban agglomeration[J]. Acta Geographica Sinica, 2022, 77(9): 2219-2235.]
doi: 10.11821/dlxb202209006 |
| Viewed | ||||||||||||||||||||||||||||||||||||||||||||||||||
|
Full text 15
|
|
|||||||||||||||||||||||||||||||||||||||||||||||||
|
Abstract 47
|
|
|||||||||||||||||||||||||||||||||||||||||||||||||
Cited |
|
|||||||||||||||||||||||||||||||||||||||||||||||||
| Shared | ||||||||||||||||||||||||||||||||||||||||||||||||||
|
||