Arid Land Geography ›› 2023, Vol. 46 ›› Issue (5): 773-781.doi: 10.12118/j.issn.1000-6060.2022.437
• Biology and Pedology • Previous Articles Next Articles
HAN Yueting( ),LI Jianyong(),LIU Jianbo,YANG Rui,NIU Diyuan
Received:2022-09-04
Revised:2022-11-16
Online:2023-05-25
Published:2023-06-05
HAN Yueting, LI Jianyong, LIU Jianbo, YANG Rui, NIU Diyuan. Indicative study of pollen on vegetation in western Junger Basin[J].Arid Land Geography, 2023, 46(5): 773-781.
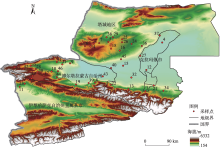
Fig. 1
Distribution of sampling sites of surface pollen in western Junggar Basin"

Tab. 1
Coordinates of sampling points and vegetation cover condition in desert region of western Junggar Basin"
| 样点编号 | 纬度 /N | 经度 /E | 海拔 /m | 群落类型 | 主要植物类型 | 植被盖度/% | 相似 系数 |
|---|---|---|---|---|---|---|---|
| 1 | 44°53′05″ | 80°40′26″ | 2674 | 针茅群落 | 针茅、莎草科、唐松草、菊科、禾本科等 | 96.64 | 0.41 |
| 2 | 44°39′24″ | 81°22′43″ | 2236 | 禾本+地衣+莎草群落 | 禾本科、地衣、藜科、莎草科、景天科等 | 59.01 | 0.54 |
| 3 | 44°57′07″ | 80°22′01″ | 2121 | 戈壁针茅+冷蒿群落 | 锦鸡儿、戈壁针茅、冷蒿、莎草、委陵菜等 | 55.03 | 0.35 |
| 4 | 44°33′47″ | 80°57′33″ | 2098 | 禾本+虎耳草群落 | 禾本科、虎耳草、苜蓿属、蓼科、豆科、茜草科、唐松草、麻黄等 | 49.59 | 0.43 |
| 5 | 44°39′02″ | 80°59′22″ | 2063 | 针茅群落 | 针茅、禾本科、龙胆科、老鹳草、蓝花棘豆、蒿属等 | 93.24 | 0.55 |
| 6 | 44°16′51″ | 80°33′17″ | 1892 | 骆驼刺+针茅群落 | 戈壁针茅、猪毛菜、骆驼刺、冷蒿、藜科、瓦松、菊科等 | 50.61 | 0.66 |
| 7 | 45°44′54″ | 83°04′36″ | 1862 | 蒿属+委陵菜群落 | 委陵菜、蒿属、针茅、锦鸡儿、莎草科、菊科等 | 95.50 | 0.51 |
| 8 | 45°39′22″ | 82°57′24″ | 1855 | 禾本+委陵菜群落 | 禾本科、委陵菜、地衣等 | 94.07 | 0.59 |
| 9 | 45°39′45″ | 82°46′24″ | 1830 | 针茅+蒿属+萎陵菜群落 | 针茅、委陵菜、蒿属、藜科、豆科等 | 48.15 | 0.49 |
| 10 | 45°34′48″ | 83°39′36″ | 1762 | 禾本+菊科群落 | 禾本科、菊科、玄参科、委陵菜、蒿属、锦鸡儿、麻黄等 | 96.32 | 0.34 |
| 11 | 44°47′44″ | 81°09′42″ | 1659 | 禾本+蒿群落 | 大籽蒿、禾本科、锦鸡儿、蒿属、白刺等 | 59.01 | 0.45 |
| 12 | 45°54′00″ | 84°02′24″ | 1580 | 针茅+蒿+委陵菜+麻黄群落 | 锦鸡儿、麻黄、戈壁针茅、莎草、委陵菜、蒿属等 | 55.13 | 0.48 |
| 13 | 45°47′57″ | 84°02′09″ | 1580 | 蒿+委陵菜+麻黄+针茅群落 | 针茅、莎草、委陵菜、蒿属、麻黄、报春花等 | 29.22 | 0.26 |
| 14 | 45°46′06″ | 83°15′26″ | 1577 | 委陵菜+禾本群落 | 委陵菜、禾本科、狗娃花、莎草等 | 61.51 | 0.58 |
| 15 | 45°48′31″ | 83°33′58″ | 1440 | 禾本+委陵菜+蒿属+锦鸡儿群落 | 禾本科、委陵菜、地衣、蒿属、锦鸡儿等 | 62.67 | 0.28 |
| 16 | 44°08′05″ | 84°49′44″ | 1438 | 锦鸡儿+灌木旋花+禾本群落 | 锦鸡儿、蔷薇科、灌木旋花、禾本、蒿属、豆科、荨麻等 | 77.77 | 0.52 |
| 17 | 44°53′24″ | 81°06′17″ | 1437 | 蒿+禾本+锦鸡儿群落 | 禾本科、蒿属、锦鸡儿、麻黄、苋科等 | 48.07 | 0.66 |
| 18 | 45°00′16″ | 80°55′48″ | 1425 | 禾本+狗娃花+灌木旋花群落 | 禾本科、狗娃花、刺柏、锦鸡儿、旋花等 | 45.67 | 0.54 |
| 19 | 45°31′00″ | 83°57′13″ | 1338 | 锦鸡儿+禾本+蒿群落 | 禾本科、蒿属、锦鸡儿、狗娃花、委陵菜、藜科、瓦松等 | 81.44 | 0.54 |
| 20 | 44°12′04″ | 84°15′13″ | 1333 | 莎草群落 | 莎草、荨麻、蒿属、禾本科、骆驼蓬等 | 69.90 | 0.32 |
| 21 | 44°48′21″ | 81°38′19″ | 1300 | 锦鸡儿+小针茅+其他杂草群落 | 锦鸡儿、针茅、藜科、菊科、十字花科、唇形科等 | 63.55 | 0.62 |
| 22 | 44°25′48″ | 83°07′12″ | 1208 | 藜+蒿群落 | 藜科、禾本科、地衣、蒿属等 | 50.53 | 0.49 |
| 23 | 44°21′17″ | 83°39′02″ | 1150 | 蒿属+骆驼刺+猪毛菜群落 | 骆驼刺、针茅、蒿属、藜科、猪毛菜、禾本科等 | 32.76 | 0.74 |
| 24 | 44°23′20″ | 80°43′30″ | 1096 | 苦豆子+水松+菊科群落 | 禾本科、苦豆子、菊科、水松、莎草科等 | 69.73 | 0.32 |
| 25 | 45°07′39″ | 81°49′00″ | 1066 | 针茅群落 | 藜科、旋花科、莎草科、针茅、蒿属、委陵菜等 | 26.98 | 0.49 |
| 26 | 45°44′24″ | 84°21′36″ | 1020 | 蒙古韭+麻黄+禾本+锦鸡儿群落 | 禾本科、蒙古韭、麻黄、狗娃花、锦鸡儿、小蓬菜、蒿属等 | 6.36 | 0.64 |
| 27 | 45°58′12″ | 83°30′36″ | 944 | 藜科群落 | 藜科、禾本科、狗娃花、刺柏、锦鸡儿、卷柏、景天科等 | 37.65 | 0.27 |
| 28 | 44°08′42″ | 85°26′32″ | 915 | 针茅+蒿属+藜群落 | 灌木、蒿属、针茅、藜科、十字花科等 | 43.57 | 0.62 |
| 29 | 44°21′36″ | 82°28′12″ | 875 | 锦鸡儿+梭梭群落 | 锦鸡儿、梭梭、西伯利亚刺柏、猪毛菜、麻黄、藜科、 菊科等 | 27.53 | 0.43 |
| 30 | 44°36′42″ | 81°49′02″ | 874 | 锦鸡儿+麻黄群落 | 锦鸡儿、禾本科、麻黄、葱属、刺柏等 | 30.87 | 0.77 |
| 31 | 44°48′52″ | 81°51′17″ | 870 | 禾本科+藜科+骆驼刺群落 | 锦鸡儿、骆驼刺、藜科、禾本科、骆驼蓬、麻黄、刺柏等 | 33.54 | 0.42 |
| 32 | 45°02′41″ | 82°00′06″ | 763 | 刺藜+白刺+盐爪爪群落 | 刺藜、盐爪爪、白刺、猪毛菜、禾本科、十字花科、菊科等 | 32.78 | 0.39 |
| 33 | 45°40′28″ | 84°42′32″ | 698 | 麻黄+藜+苦荬菜群落 | 麻黄、藜科、苦荬菜、蒙古韭、锦鸡儿等 | 14.60 | 0.39 |
| 34 | 45°04′59″ | 82°16′01″ | 693 | 白刺+刺藜群落 | 猪毛菜、小蓬菜、白刺、刺藜等 | 32.49 | 0.54 |
| 35 | 44°24′36″ | 82°54′00″ | 590 | 藜+小蓬菜群落 | 藜科、禾本科、小蓬菜、灌木旋花等 | 41.32 | 0.53 |
| 36 | 44°19′48″ | 85°06′36″ | 581 | 梭梭+藜科群落 | 梭梭、藜科、麻黄、骆驼刺、针茅、蒿属、禾本科等 | 28.66 | 0.46 |
| 37 | 45°13′09″ | 83°59′58″ | 549 | 蒿+禾本群落 | 梭梭、禾本科、蒿属、小蓬菜、藜科、茜草科等 | 42.43 | 0.59 |
| 38 | 45°58′12″ | 83°43′12″ | 491 | 梭梭群落 | 梭梭、禾本科、狗娃花、莎草等 | 27.59 | 0.67 |
| 39 | 45°20′24″ | 84°39′00″ | 400 | 藜科群落 | 禾本科、藜科、蒿属等 | 40.48 | 0.30 |
| 40 | 46°01′48″ | 85°19′12″ | 356 | 梭梭群落 | 禾本科、梭梭、豆科、茜草科、唐松草、麻黄等 | 9.03 | 0.69 |
| 41 | 44°36′00″ | 84°21′00″ | 306 | 红纱+珍珠梅+白刺群落 | 红纱、珍珠梅、白刺、补血草、藜科等 | 44.49 | 0.37 |
| 42 | 44°51′24″ | 84°51′38″ | 247 | 梭梭+蒿+藜群落 | 梭梭、禾本科、菊科、蒿属、牻牛儿苗科、藜科、骆驼蓬等 | 72.49 | 0.49 |
| 43 | 45°47′24″ | 85°24′00″ | 214 | 柽柳+藜科群落 | 柽柳、藜科、禾本科、苦豆子、菊科、莎草科、麻黄等 | 15.32 | 0.61 |
| 44 | 45°00′00″ | 84°04′12″ | 206 | 梭梭+柽柳群落 | 禾本科、梭梭、柽柳、藜科、骆驼刺等 | 89.05 | 0.42 |
| 45 | 44°38′24″ | 83°22′48″ | 190 | 胡杨+梭梭+柽柳群落 | 梭梭、白刺、胡杨、猪毛菜、柽柳、藜科等 | 40.09 | 0.66 |
| 46 | 44°55′12″ | 83°39′36″ | 188 | 藜科+骆驼刺群落 | 骆驼刺、蒿属、狗娃花、委陵菜、藜科、柽柳等 | 62.45 | 0.41 |
Tab. 2
Correlation coefficient of pollen in western Junggar Basin"
| 组别 | 种属 | 拉丁学名 | A | U | O | CC | R | Mp/% | Ma/% |
|---|---|---|---|---|---|---|---|---|---|
| 第1组 | 藜科 | Chenopodiaceae | 1.00 | 0.00 | 0.00 | 0.71 | 12.50 | 47.89 | 21.20 |
| 第2组 | 蒿属 | Artemisia | 0.39 | 0.00 | 0.61 | 0.57 | 18.93 | 24.84 | 12.67 |
| 麻黄属 | Ephedra | 0.17 | 0.00 | 0.83 | 0.14 | 18.80 | 11.21 | 14.80 | |
| 第3组 | 白刺属 | Nitraria | 0.19 | 0.00 | 0.81 | 0.39 | 0.46 | 0.01 | 0.01 |
| 百合科 | Liliaceae | 0.22 | 0.67 | 0.61 | -0.14 | 1.09 | 0.20 | 2.50 | |
| 唇形科 | Labiatae | 0.24 | 0.57 | 0.65 | 0.13 | 0.38 | 0.27 | 0.16 | |
| 豆科 | Fabaceae | 0.31 | 0.50 | 0.56 | 0.09 | 0.18 | 0.79 | 1.12 | |
| 禾本科 | Poaceae | 1.00 | 0.00 | 0.00 | 0.51 | 0.26 | 8.32 | 3.43 | |
| 菊科 | Asteraceae | 0.07 | 0.88 | 0.87 | -0.29 | 0.44 | 2.31 | 2.87 | |
| 蓼科 | Polygonaceae | 0.28 | 0.48 | 0.62 | -0.32 | 0.34 | 0.19 | 0.34 | |
| 毛茛科 | Ranunculaceae | 0.09 | 0.56 | 0.90 | 0.13 | 3.90 | 3.10 | 4.25 | |
| 蔷薇科 | Rosaceae | 0.27 | 0.54 | 0.60 | 0.12 | 0.94 | 2.65 | 1.45 | |
| 伞形科 | Umbelliferae | 0.26 | 0.63 | 0.54 | 0.08 | 0.20 | 0.27 | 0.36 | |
| 莎草科 | Cyperaceae | 0.28 | 0.57 | 0.56 | -0.12 | 0.45 | 3.43 | 0.98 | |
| 十字花科 | Brassicaceae | 0.26 | 0.42 | 0.67 | 0.28 | 0.53 | 0.43 | 0.64 | |
| 石竹科 | Caryophyllaceae | 0.50 | 0.29 | 0.38 | 0.04 | 0.67 | 0.10 | 0.44 | |
| 旋花科 | Convolvulaceae | 0.38 | 0.60 | 0.11 | 0.11 | 0.47 | 0.56 | 0.38 | |
| 荨麻科 | Urticaceae | 0.05 | 0.88 | 0.93 | -0.34 | 1.23 | 0.84 | 1.88 | |
| 紫草科 | Borraginaceae | 0.53 | 0.43 | 0.11 | 0.17 | 1.57 | 0.32 | 0.98 |
| [1] | 王开发, 王宪曾. 孢粉学概论[M]. 北京: 北京大学出版社, 1983. |
| [Wang Kaifa, Wang Xianceng. An introduction to palynology[M]. Beijing: Peking University Press, 1983. ] | |
| [2] | 李月丛, 许清海, 肖举乐, 等. 中国北方森林植被主要表土花粉类型的对植被的指示性[J]. 第四纪研究, 2005, 25(5): 598-608. |
| [Li Yuecong, Xu Qinghai, Xiao Jule, et al. Indication of some major pollen taxa in surface samples to their parent plants of forest in northern China[J]. Quaternary Sciences, 2005, 25(5): 598-608. ] | |
| [3] | Cushing E J, Wright H E. Introduction in quaternary palaoecology[J]. New Haven and London: Yale University Press, 1967. |
| [4] | Davis M B. On the theory of pollen analysis[J]. Journal of America Science, 1963, 261: 897-912. |
| [5] |
Davis O K. Pollen frequencies reflect vegetation patterns in a Great Basin (USA) mountain range[J]. Review of Palaeobotany and Palynology, 1984, 40: 295-315.
doi: 10.1016/0034-6667(84)90013-7 |
| [6] | 许清海, 李月丛, 阳小兰, 等. 中国北方几种主要花粉类型与植被定量关系[J]. 中国科学, 2007, 37(2): 192-205. |
| [Xu Qinghai, Li Yuecong, Yang Xiaolan, et al. Quantitative relationship between pollen types and vegetation in northern China[J]. Science in China, 2007, 37(2): 192-205. ] | |
| [7] |
李月丛, 许清海, 肖举乐, 等. 中国北方几种灌丛群落表土花粉与植被关系研究[J]. 地理科学, 2007, 27(2): 205-210.
doi: 10.13249/j.cnki.sgs.2007.02.205 |
|
[Li Yuecong, Xu Qinghai, Xiao Jule, et al. Relationship between surface pollen and vegetation in some shrub communities of northern China[J]. Scientia Geographica Sinica, 2007, 27(2): 205-210. ]
doi: 10.13249/j.cnki.sgs.2007.02.205 |
|
| [8] |
李月丛, 许清海, 王学丽, 等. 中国北方森林群落现代花粉与植被和气候的关系[J]. 地理学报, 2008, 63(9): 945-957.
doi: 10.11821/xb200809005 |
|
[Li Yuecong, Xu Qinghai, Wang Xueli, et al. Modern pollen assemblages of the forest communities and their relationships with vegetation and climate in northern China[J]. Acta Geographica Sinica, 2008, 63(9): 945-957. ]
doi: 10.11821/xb200809005 |
|
| [9] | 张东良. 全新世西风模态下中亚干旱区孢粉类型多样性变化特征——以阿尔泰山为例[J]. 干旱区研究, 2022, 39(3): 667-675. |
| [Zhang Dongliang. Changes of pollen taxa diversity in the arid Central Asia under the Holocene westerlies mode: A case study of the Altai Mountains[J]. Arid Zone Research, 2022, 39(3): 667-675. ] | |
| [10] | 李芙蓉. 中国北方表土孢粉组合及其与植被和气候的关系[D]. 兰州: 兰州大学, 2012. |
| [Li Furong. The surface pollen assemblages and their relationships with modern vegetation and climate in north China[D]. Lanzhou: Lanzhou University, 2012. ] | |
| [11] | 刘鸿雁, 李宜垠. 半干旱区气候变化和人类活动的孢粉指示[J]. 古生物学报, 2009, 48(2): 211-221. |
| [Liu Hongyan, Li Yiyin. Pollen indicators of climate change and human activities in the semi-arid region[J]. Acta Palaeontologica Sinica, 2009, 48(2): 211-221. ] | |
| [12] | 程波, 朱艳, 陈发虎, 等. 石羊河流域表土孢粉与植被的关系[J]. 冰川冻土, 2004, 26(1): 81-88. |
| [Cheng Bo, Zhu Yan, Chen Fahu, et al. Relationship between surface pollen and vegetation in Shiyang River Drainage, northwest China[J]. Journal of Glaciology and Geocryology, 2004, 26(1): 81-88. ] | |
| [13] | 赵楠楠, 杨振京, 宁凯, 等. 柴达木盆地表土孢粉与植被的关系[J]. 干旱区研究, 2020, 37(4): 1068-1078. |
| [Zhao Nannan, Yang Zhenjing, Ning Kai, et al. Relationship between surface pollen and vegetation in Qaidam Basin[J]. Arid Zone Research, 2020, 37(4): 1068-1078. ] | |
| [14] |
Fontana S L. Coastal dune vegetation and pollen representation in south Buenos Aires Province, Argentina[J]. Journal of Biogeography, 2005, 32(4): 719-735.
doi: 10.1111/jbi.2005.32.issue-4 |
| [15] |
Marcos M A, Mancini M V. Modern pollen and vegetation relationships in northeastern Patagonia (Golfo San Matías, Río Negro)[J]. Review of Palaeobotany and Palynology, 2012, 171: 19-26.
doi: 10.1016/j.revpalbo.2011.11.007 |
| [16] |
Bunting M J. Pollen-vegetation relationships in non-arboreal moorland taxa[J]. Review of Palaeobotany and Palynology, 2003, 125: 285-298.
doi: 10.1016/S0034-6667(03)00005-8 |
| [17] |
Schofield J E, Edwards K J, Mc Mullen J A. Modern pollen-vegetation relationships in subarctic southern Greenland and the interpretation of fossil pollen data from the Norse landnam[J]. Journal of Biogeography, 2007, 34(3): 473-488.
doi: 10.1111/jbi.2007.34.issue-3 |
| [18] | 吴慧贤, 徐海, 蓝江湖, 等. 北疆表土花粉组合及其与植被和气候的关系[J]. 生态学杂志, 2018, 37(12): 3499-3507. |
| [Wu Huixian, Xu Hai, Lan Jianghu, et al. Pollen assemblages in surface soil and their relationships with vegetation and climate in northern Xinjiang[J]. Chinese Journal of Ecology, 2018, 37(12): 3499-3507. ] | |
| [19] | 李月丛, 许清海, 阳小兰, 等. 中国荒漠区东部花粉对植被的指示性研究[J]. 科学通报, 2005, 50(13): 1356-1364. |
| [Li Yuecong, Xu Qinghai, Yang Xiaolan, et al. Indicative study of pollen on vegetation in eastern deserts of China[J]. Chinese Science Bulletin, 2005, 50(13): 1356-1364. ] | |
| [20] | 伍婧, 马玉贞, 桑艳礼, 等. 宁夏大罗山表土样品中主要花粉类型的代表性[J]. 古生物学报, 2013, 52(1): 57-67. |
| [Wu Jing, Ma Yuzhen, Sang Yanli, et al. Representation of major pollen taxa from surface samples of Daluoshan Mountain, Ningxia[J]. Acta Palaeontologica Sinica, 2013, 52(1): 57-67. ] | |
| [21] | 薛雅倩. 新疆北部表土孢粉空间分布规律及其与植被的关系研究[D]. 石家庄: 河北地质大学, 2020. |
| [Xue Yaqian. Study on the spatial distribution of surface sporopollen and its relationship with vegetation in Northern Xinjiang[D]. Shijiazhuang: Hebei GEO University, 2020. ] | |
| [22] | 陶士臣, 安成邦, 赵家驹, 等. 新疆东部托勒库勒湖流域表土花粉初步分析[J]. 第四纪研究, 2013, 33(3): 545-553. |
| [Tao Shichen, An Chengbang, Zhao Jiaju, et al. The preliminary study of the surface pollen from Tuolekule Lake Basin, eastern Xinjiang, China[J]. Quaternary Sciences, 2013, 33(3): 545-553. ] | |
| [23] | 姚付龙, 马春梅, 朱诚, 等. 中国西天山北坡表土花粉与区域植被的关系[J]. 古生物学报, 2021, 60(3): 471-482. |
| [Yao Fulong, Ma Chunmei, Zhu Cheng, et al. Relationship between surface pollen and vegetation on the northern slope of west Tianshan Mountains, China[J]. Acta Palaeontologica Sinica, 2021, 60(3): 471-482. ] | |
| [24] | 姚付龙, 马春梅, 敬一丹, 等. 新疆赛里木湖流域表土花粉组合与现代植被关系研究[J]. 微体古生物学报, 2018, 35(4): 423-434. |
| [Yao Fulong, Ma Chunmei, Jing Yidan, et al. Relationship between surface pollen assemblage and the vegetation in the Sayram Lake region, northern Xinjiang, China[J]. Acta Micropalaeontologica Sinica, 2018, 35(4): 423-434. ] | |
| [25] |
冯晓华, 阎顺, 倪建. 新疆表土孢粉的植被定量重建[J]. 地理科学, 2011, 31(6): 702-707.
doi: 10.13249/j.cnki.sgs.2011.06.702 |
|
[Feng Xiaohua, Yan Shun, Ni Jian. Pollen-based and quantitative reconstruction of Holocene palaeovegetation of surface soil of Xinjiang[J]. Scientia Geographica Sinica, 2011, 31(6): 702-707. ]
doi: 10.13249/j.cnki.sgs.2011.06.702 |
|
| [26] |
李媛媛, 张芸, 孔昭宸, 等. 新疆阿尔泰红山嘴地区的表土孢粉与现代植被[J]. 植物生态学报, 2021, 45(2): 174-186.
doi: 10.17521/cjpe.2020.0195 |
|
[Li Yuanyuan, Zhang Yun, Kong Zhaochen, et al. Surface sporopollen and modern vegetation in Hongshanzui area, Altai, Xinjiang, China[J]. Chinese Journal of Plant Ecology, 2021, 45(2): 174-186. ]
doi: 10.17521/cjpe.2020.0195 |
|
| [27] |
姚付龙, 张静, 杨海军, 等. 新疆博格达山北坡表土花粉散布特征[J]. 生态环境学报, 2021, 30(3): 466-474.
doi: 10.16258/j.cnki.1674-5906.2021.03.004 |
|
[Yao Fulong, Zhang Jing, Yang Haijun, et al. Surface pollen distribution on the north slope of Bogda Mountain, Xinjiang, China[J]. Ecology and Environmental Sciences, 2021, 30(3): 466-474. ]
doi: 10.16258/j.cnki.1674-5906.2021.03.004 |
|
| [28] | 郎青, 姚付龙, 杨海军. 新疆中天山山间盆地表土花粉谱特征[J]. 生态学杂志, 2020, 39(8): 2518-2527. |
| [Lang Qing, Yao Fulong, Yang Haijun. Surface pollen spectrum in intermountain basin of middle Tianshan, Xinjiang, China[J]. Chinese Journal of Ecology, 2020, 39(8): 2518-2527. ] | |
| [29] |
王力, 张芸, 孔昭宸, 等. 新疆天山南坡吐鲁番地区表土花粉的初步研究[J]. 植物生态学报, 2017, 41(7): 779-786.
doi: 10.17521/cjpe.2017.0019 |
|
[Wang Li, Zhang Yun, Kong Zhaochen, et al. Preliminary study on pollen distribution in the surface soil of the Turpan region in the southern slope of Tianshan Mountains, Xinjiang, China[J]. Chinese Journal of Plant Ecology, 2017, 41(7): 779-786. ]
doi: 10.17521/cjpe.2017.0019 |
|
| [30] | 吴慧贤. 北疆表土花粉组合及其与植被和气候的关系[D]. 北京: 中国科学院大学, 2018. |
| [Wu Huixian. Pollen assemblages of the surface soil and their relationships with the modern vegetation and climate in northern Xinjiang[D]. Beijing: University of Chinese Academy of Sciences, 2018. ] | |
| [31] | 博尔塔拉蒙古自治州地方志编纂委员会. 博尔塔拉蒙古自治州志[M]. 乌鲁木齐: 新疆大学出版社, 1999. |
| [Bortala Mongolian Autonomous Prefecture Local Chronicle Compilation Committee. Records of Bortala Mongolian Autonomous Prefecture[M]. Urumqi: Xinjiang University Press, 1999. ] | |
| [32] | 博尔塔拉蒙古自治州党史研究室. 博尔塔拉年鉴2014—2015[M]. 乌鲁木齐: 新疆人民出版社, 2016. |
| [Bortala Mongolian Autonomous Prefecture CPC History Research Office. Bortala Yearbook: 2014—2015[M]. Urumqi: Xinjiang People’s Publishing House, 2016. ] | |
| [33] |
牛地园, 李建勇, 王宁练, 等. 新疆天山西部表土花粉组合与现代植被和气候的关系[J]. 冰川冻土, 2022, 44(3): 1070-1082.
doi: 10.7522/j.issn.1000-0240.2022.0088 |
|
[Niu Diyuan, Li Jianyong, Wang Ninglian, et al. Relationship between pollen assemblages in surface soil and modern vegetation and climate in the western Tianshan Mountains, Xinjiang[J]. Journal of Glaciology and Geocryology, 2022, 44(3): 1070-1082. ]
doi: 10.7522/j.issn.1000-0240.2022.0088 |
|
| [34] | 段荣蕾, 侯光良, 魏海成, 等. 青藏高原东部高寒草甸区放牧家畜粪花粉组合特征及其环境指示意义[J]. 干旱区地理, 2021, 44(1): 229-239. |
| [Duan Ronglei, Hou Guangliang, Wei Haicheng et al. Characteristics and environmental implications of dung pollen assemblages of grazing livestock in alpine meadow in the eastern Qinghai-Tibetan Plateau[J]. Arid Land Geography, 2021, 44(1): 229-239. ] | |
| [35] | 李宜垠, 张新时, 周广胜. 中国东北样带(NECT)东部森林区的植被与表土花粉的定量关系[J]. 植物学报, 2000, 42(1): 81-88. |
| [Li Yiyin, Zhang Xinshi, Zhou Guangsheng. Study of quantitative relationships between vegetation and pollen in surface samples in the eastern forest area of northeast China transect[J]. Acta Botanica Sinica, 2000, 42(1): 81-88. ] | |
| [36] | 许清海, 曹现勇, 田芳, 等. 中国北方典型草原区花粉产量及其定量重建古植被的作用[J]. 中国科学: 地球科学, 2013, 43(12): 2016-2028. |
| [Xu Qinghai, Cao Xianyong, Tian Fang, et al. Pollen yield and quantitative reconstruction of palaeo-vegetation in typical steppe regions of northern China[J]. Scientia Sinica (Terrae), 2013, 43(12): 2016-2028. ] | |
| [37] |
Dimbleby G W. Pollen analysis of terrestrial soils[J]. New Phytology, 1957, 56: 12-28.
doi: 10.1111/nph.1957.56.issue-1 |
| [38] |
Dimbleby G W. Soil pollen analysis[J]. Soil Science, 1961, 12: 1-11.
doi: 10.1097/00010694-192107000-00001 |
| [39] | 桑艳礼. 甘肃兴隆山国家自然保护区表土花粉组合及统计分析[D]. 兰州: 兰州大学, 2008. |
| [Sang Yanli. Pollen assemblages and numerical analysis of surface samples from National Nature Reserve Area of Xinglong Mountain, Gansu[D]. Lanzhou: Lanzhou University, 2008. ] | |
| [40] |
Brun C, Dessaint F, Richard H, et al. Arable-weed flora and its pollen representation: A case study from the eastern part of France[J]. Review of Palaeobotany and Palynology, 2007, 146(1-4): 29-50.
doi: 10.1016/j.revpalbo.2007.02.001 |
| [41] |
Ge Y W, Li Y C, Bunting M J, et al. Relation between modern pollen rain, vegetation, and climate in northern China: Implications for quantitative vegetation reconstruction in a steppe environment[J]. Science of the Total Environment, 2017, 586: 25-41.
doi: 10.1016/j.scitotenv.2017.02.027 |
| [42] |
Xu Q H, Zhang S R, Gaillard M J, et al. Studies of modern pollen assemblages for pollen dispersal-deposition-preservation process understanding and for pollen-based reconstructions of past vegetation, climate, and human impact: A review based on case studies in China[J]. Quaternary Science Reviews, 2016, 149: 151-166.
doi: 10.1016/j.quascirev.2016.07.017 |
| [43] |
El-Moslinmny A P. The ecological significance of common nonarboreal pollen example from dryland of the Middle East[J]. Review of Palaeobotany and Palynology, 1990, 64: 343-350.
doi: 10.1016/0034-6667(90)90150-H |
| [44] | 孙湘君, 杜乃秋, 翁成郁, 等. 新疆玛纳斯湖盆周围近14000年以来的古植被古环境[J]. 第四纪研究, 1994, 14: 239-248. |
| [Sun Xiangjun, Du Naiqiu, Weng Chengyu, et al. Paleovegetation and paleoenvironment of Manasi Lake, Xinjiang, N W China during the last 14000 years[J]. Quaternary Sciences, 1994, 14: 239-248. ] | |
| [45] | Carrión J S. A taphonomic study of modern pollen assemblages from dung and surface sediments in arid environments of Spain[J]. Review of Palaeobotary and Palynology, 2002, 120: 217-232. |
| [46] | 姚付龙, 夏倩倩, 张静, 等. 西天山南坡表土花粉分析[J]. 应用生态学报, 2019, 30(7): 2301-2308. |
| [Yao Fulong, Xia Qianqian, Zhang Jing, et al. Pollen in surface soil at the southern slope of western Tianshan, China[J]. Chinese Journal of Applied Ecology, 2019, 30(7): 2301-2308. ] | |
| [47] | 杨振京, 张芸, 毕志伟, 等. 新疆天山南坡表土花粉的初步研究[J]. 干旱区地理, 2011, 34(6): 880-889. |
| [Yang Zhenjing, Zhang Yun, Bi Zhiwei, et al. Surface pollen distribution in the southern slope of Tianshan Mountains, Xinjiang[J]. Arid Land Geography, 2011, 34(6): 880-889. ] |
| [1] | CHEN Shujun,XU Guochang,LYU Zhiping,MA Mingyue,LI Hanyu,ZHU Yuyan. Spatiotemporal variations of fractional vegetation cover and its response to climate change and urbanization in China [J]. Arid Land Geography, 2023, 46(5): 742-752. |
| [2] | SUN Nansha,CHEN Qiong,LIU Fenggui,ZHOU Qiang,GUO Yuanyuan. Agricultural drought research in Yellow River-Huangshui River Valley from 2000 to 2020 [J]. Arid Land Geography, 2023, 46(3): 437-447. |
| [3] | GUO Fangjun, MA Quanlin, ZHANG Jinchun, LI Delu, YUAN Hongbo, CHEN Fang, WEI Linyuan, ZHANG Dekui. Vegetation types, distribution and quantitative characteristics in the desert area of Shiyang River Basin [J]. Arid Land Geography, 2023, 46(11): 1848-1857. |
| [4] | WANG Zhen, LI Junli, ZHANG Jiudan, WU Haoru, GUO Xuefei. Influences of ecological water conveyance on Populus euphratica forest restoration in the middle reaches of Tarim River [J]. Arid Land Geography, 2023, 46(1): 94-102. |
| [5] | ZHANG Jiudan, LI Junli, BAO Anming, BAI Jie, LIU Tie, HUANG Yue. Effectiveness assessment of ecological restoration of Populus euphratica forest in the Tarim River Basin during 2013—2020 [J]. Arid Land Geography, 2022, 45(6): 1824-1835. |
| [6] | YUAN Zhihui, YIN Shan, SA Chula, CHI Yongfeng. Effects of urbanization on vegetation phenology in Hohhot City in the recent 20 years [J]. Arid Land Geography, 2022, 45(6): 1890-1898. |
| [7] | GUO Xin, WEI Tianxing, CHEN Yuxuan, SHA Guoliang, REN Kang, YU Huan. Characteristics of soil ecological stoichiometry in typical fallow-restored vegetation in the loess hilly areas [J]. Arid Land Geography, 2022, 45(6): 1899-1907. |
| [8] | ZHANG Libin, HE Mingzhu, ZHANG Kecun, AN Zhishan, WANG Jinguo, HUI Yingxin, JIA Xiaolong. Effect of preliminary vegetation reconstruction on soil microorganism community structure in arid desert area [J]. Arid Land Geography, 2022, 45(6): 1916-1926. |
| [9] | LIU Yuting,ZHANG Qifei,LIU Jingshi,GUAN Hanxiao,MENG Fanxue. Temporal and spatial characteristics of fractional vegetation coverage and its response to climatic factors in southern Xinjiang in recent 20 years: A case of Taxkorgan Tajik Autonomous County [J]. Arid Land Geography, 2022, 45(5): 1481-1489. |
| [10] | HE Junqi,WEI Yan,GAO Wande,CHEN Yunfei,MA Yandong,LIU Xiuhua. Temporal and spatial variation of vegetation NDVI and its response to climatic factors in the southeastern margin of Mu Us Sandy Land [J]. Arid Land Geography, 2022, 45(5): 1523-1533. |
| [11] | SUN Yanhui,ZHANG Dinghai,ZHANG Zhishan. Relationship between soil moisture content and topography-vegetation factors in different types of dunes in the Tengger Desert [J]. Arid Land Geography, 2022, 45(5): 1570-1578. |
| [12] | DAI Yunhao,GUAN Yao,ZHANG Qinkai,SUN Junjie,HE Xinghong. Remote sensing monitoring and temporal and spatial characteristics of soil salinization in Aral Reclamation Area [J]. Arid Land Geography, 2022, 45(4): 1176-1185. |
| [13] | LI Shiyao,CONG Shixiang,WANG Rongrong,YU Hailong,HUANG Juying. Effects of climate change and human activities on net primary productivity of vegetation in Yanchi County [J]. Arid Land Geography, 2022, 45(4): 1186-1199. |
| [14] | CHENG Danni,WANG Yingqi,CHENG Yongxiang,HUANG Jingfeng. Vegetation-water vapor-land surface temperature correlation analysis of typical deserts and oases in Xinjiang [J]. Arid Land Geography, 2022, 45(2): 456-466. |
| [15] | REN Liqing. Spatiotemporal change and driving force of vegetation in Ebinur Lake Basin [J]. Arid Land Geography, 2022, 45(2): 467-477. |
|
||