Arid Land Geography ›› 2024, Vol. 47 ›› Issue (12): 2152-2163.doi: 10.12118/j.issn.1000-6060.2024.142
• Regional Development • Previous Articles Next Articles
WANG Ziyan1( ), NIU Liqin2(), CHENG Zhanhong1
Received:2024-03-04
Revised:2024-05-30
Online:2024-12-25
Published:2025-01-02
Contact:
NIU Liqin
E-mail:wzyyyyyy0906@163.com;nlq1976@126.com
WANG Ziyan, NIU Liqin, CHENG Zhanhong. Temporal and spatial evolution of ecological welfare performance and its influencing factors: A case of Shanxi Province[J].Arid Land Geography, 2024, 47(12): 2152-2163.
Tab. 1
Ecological welfare performance evaluation indicator system"
| 一级指标 | 二级指标 | 三级指标 | 具体指标 |
|---|---|---|---|
| 投入指标 | 资源消耗 | 土地资源消耗 | 人均城市建设面积 |
| 能源资源消耗 | 人均用电量 | ||
| 水资源消耗 | 人均用水量 | ||
| 产出指标 | 环境污染 | 废水排放量 | 人均工业废水排放量 |
| 废气排放量 | 人均工业SO2排放量 | ||
| 固体废弃物排放量 | 人均工业烟粉尘排放量 | ||
| 人类发展 | 经济发展水平 | 人均GDP | |
| 教育发展水平 | 人均高等学校在校生数 | ||
| 健康发展水平 | 人均城市医院病床数 |
Tab. 2
Ecological welfare performance values of 11 prefectures and cities in Shanxi Province from 2006 to 2021"
| 地区 | 2006年 | 2008年 | 2010年 | 2012年 | 2014年 | 2016年 | 2018年 | 2020年 | 2021年 | 均值 | |
|---|---|---|---|---|---|---|---|---|---|---|---|
| 晋北 | 大同市 | 0.362 | 0.408 | 0.458 | 0.578 | 0.395 | 0.313 | 0.301 | 0.545 | 0.473 | 0.431 |
| 朔州市 | 1.818 | 1.673 | 1.208 | 1.086 | 1.152 | 1.077 | 0.665 | 1.055 | 1.064 | 1.191 | |
| 忻州市 | 0.632 | 0.244 | 0.530 | 0.710 | 0.496 | 0.561 | 1.074 | 1.000 | 0.578 | 0.611 | |
| 平均值 | 0.937 | 0.775 | 0.732 | 0.791 | 0.681 | 0.650 | 0.680 | 0.867 | 0.705 | 0.744 | |
| 晋中 | 太原市 | 1.700 | 1.658 | 1.616 | 1.602 | 1.461 | 1.441 | 1.544 | 1.487 | 1.388 | 1.556 |
| 阳泉市 | 0.582 | 0.471 | 0.837 | 0.699 | 0.577 | 0.417 | 0.293 | 0.358 | 0.445 | 0.507 | |
| 晋中市 | 0.334 | 0.367 | 0.481 | 0.468 | 0.556 | 0.752 | 0.817 | 0.756 | 0.804 | 0.572 | |
| 吕梁市 | 0.134 | 0.150 | 0.279 | 0.186 | 0.212 | 0.178 | 0.177 | 0.320 | 0.376 | 0.207 | |
| 平均值 | 0.687 | 0.661 | 0.803 | 0.739 | 0.701 | 0.697 | 0.708 | 0.730 | 0.753 | 0.711 | |
| 晋南 | 运城市 | 0.246 | 0.185 | 0.452 | 0.238 | 0.291 | 0.239 | 0.295 | 0.408 | 0.429 | 0.293 |
| 临汾市 | 0.230 | 0.245 | 0.277 | 0.404 | 0.303 | 0.266 | 0.324 | 0.369 | 0.350 | 0.302 | |
| 平均值 | 0.238 | 0.215 | 0.364 | 0.321 | 0.297 | 0.253 | 0.310 | 0.389 | 0.389 | 0.297 | |
| 晋东南 | 长治市 | 0.356 | 0.339 | 0.583 | 1.154 | 1.007 | 0.554 | 0.862 | 1.051 | 1.053 | 0.767 |
| 晋城市 | 0.293 | 1.023 | 1.098 | 0.759 | 1.069 | 1.734 | 1.038 | 1.041 | 1.047 | 1.051 | |
| 平均值 | 0.324 | 0.681 | 0.840 | 0.956 | 1.038 | 1.144 | 0.950 | 1.046 | 1.050 | 0.909 | |
| 均值 | 0.608 | 0.615 | 0.711 | 0.717 | 0.684 | 0.685 | 0.672 | 0.763 | 0.728 | 0.681 | |
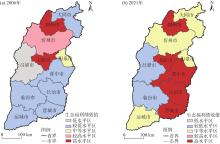
Fig. 1
Spatial distribution of ecological welfare performance in Shanxi Province in 2006 and 2021"

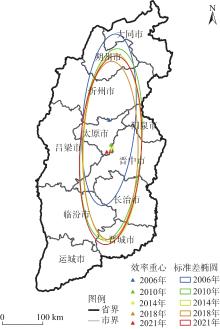
Fig. 2
Standard deviation ellipse and center of gravity of ecological welfare performance in Shanxi Province"
Tab. 3
Markov transfer probability matrix for ecological welfare performance in Shanxi Province"
| 空间滞后 | 效率类型 | Ⅰ | Ⅱ | Ⅲ | Ⅳ | 观测值 |
|---|---|---|---|---|---|---|
| 无 | Ⅰ | 0.7727 | 0.2045 | 0.0227 | 0.0000 | 44 |
| Ⅱ | 0.1282 | 0.6154 | 0.2308 | 0.0256 | 39 | |
| Ⅲ | 0.0238 | 0.1667 | 0.6429 | 0.1667 | 42 | |
| Ⅳ | 0.0000 | 0.0250 | 0.1250 | 0.8500 | 40 | |
| Ⅰ | Ⅰ | 0.6667 | 0.0000 | 0.3333 | 0.0000 | 3 |
| Ⅱ | 0.0000 | 0.0000 | 1.0000 | 0.0000 | 1 | |
| Ⅲ | 0.0000 | 0.0000 | 0.0000 | 1.0000 | 1 | |
| Ⅳ | 0.0000 | 0.0000 | 0.0000 | 1.0000 | 2 | |
| Ⅱ | Ⅰ | 1.0000 | 0.0000 | 0.0000 | 0.0000 | 4 |
| Ⅱ | 0.0000 | 0.0000 | 1.0000 | 0.0000 | 1 | |
| Ⅲ | 0.0000 | 0.2500 | 0.2500 | 0.5000 | 4 | |
| Ⅳ | 0.0000 | 0.0000 | 0.1250 | 0.8750 | 24 | |
| Ⅲ | Ⅰ | 0.7778 | 0.2222 | 0.0000 | 0.0000 | 36 |
| Ⅱ | 0.1471 | 0.6176 | 0.2059 | 0.0294 | 34 | |
| Ⅲ | 0.0270 | 0.1622 | 0.7027 | 0.1081 | 37 | |
| Ⅳ | 0.0000 | 0.0714 | 0.1429 | 0.7857 | 14 | |
| Ⅳ | Ⅰ | 0.0000 | 1.0000 | 0.0000 | 0.0000 | 1 |
| Ⅱ | 0.0000 | 1.0000 | 0.0000 | 0.0000 | 3 | |
| Ⅲ | 0.0000 | 0.0000 | 0.0000 | 0.0000 | 0 | |
| Ⅳ | 0.0000 | 0.0000 | 0.0000 | 0.0000 | 0 |
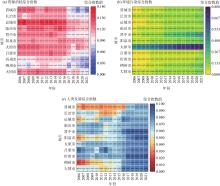
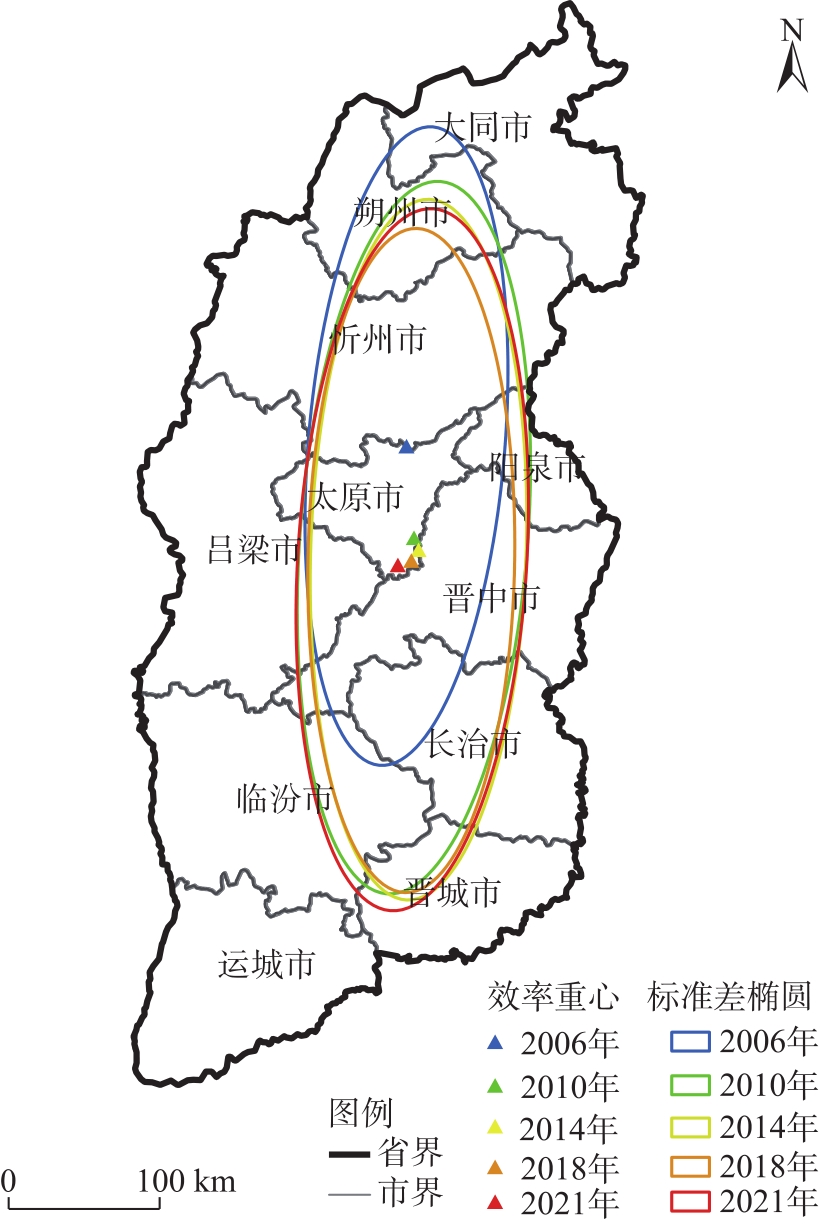
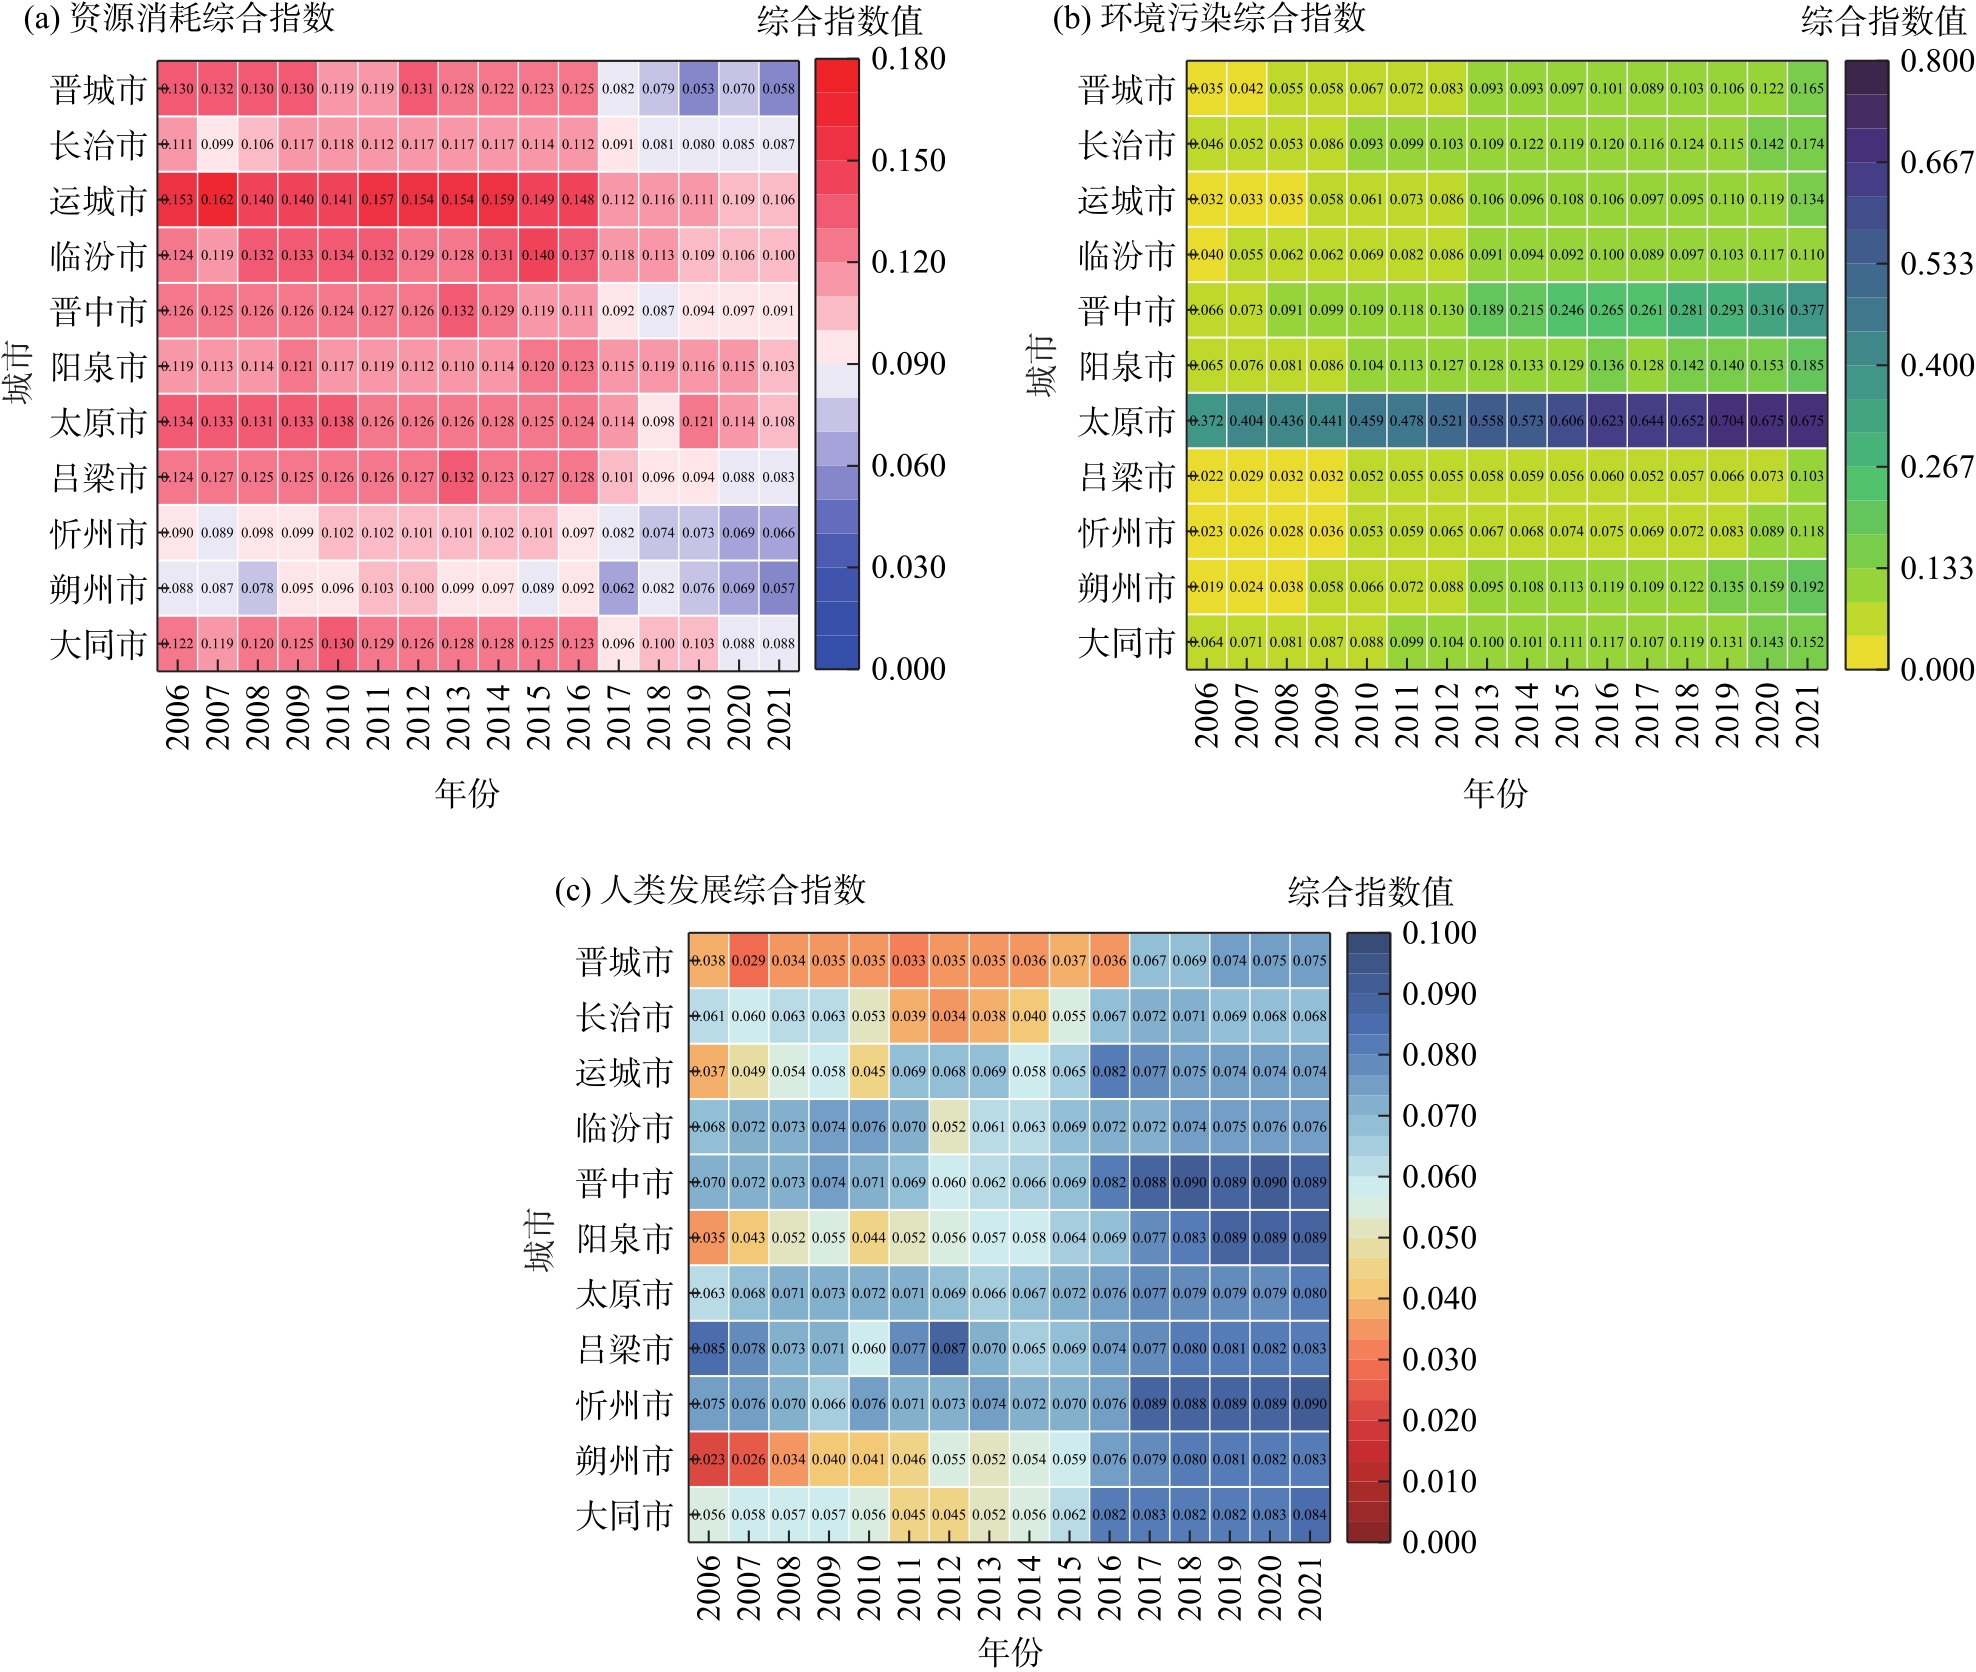
Fig. 3
Composite indices from 2006 to 2021"
Tab. 4
Gini coefficient decomposition of ecological welfare performance"
| 年份 | 总体基 尼系数 | 区域内差异 | 区域间差异 | |||||||
|---|---|---|---|---|---|---|---|---|---|---|
| 晋北 | 晋中 | 晋南 | 晋东南 | 晋中-晋北 | 晋南-晋北 | 晋南-晋中 | ||||
| 2006 | 0.437 | 0.345 | 0.450 | 0.017 | 0.048 | 0.423 | 0.595 | 0.541 | ||
| 2007 | 0.392 | 0.305 | 0.439 | 0.139 | 0.059 | 0.398 | 0.566 | 0.531 | ||
| 2008 | 0.440 | 0.410 | 0.437 | 0.070 | 0.251 | 0.436 | 0.565 | 0.546 | ||
| 2009 | 0.366 | 0.251 | 0.416 | 0.046 | 0.195 | 0.367 | 0.477 | 0.490 | ||
| 2010 | 0.307 | 0.228 | 0.340 | 0.120 | 0.153 | 0.319 | 0.336 | 0.413 | ||
| 2011 | 0.323 | 0.106 | 0.390 | 0.063 | 0.018 | 0.340 | 0.561 | 0.498 | ||
| 2012 | 0.311 | 0.143 | 0.379 | 0.130 | 0.103 | 0.312 | 0.423 | 0.458 | ||
| 2013 | 0.324 | 0.208 | 0.363 | 0.046 | 0.005 | 0.319 | 0.436 | 0.484 | ||
| 2014 | 0.321 | 0.247 | 0.336 | 0.010 | 0.015 | 0.326 | 0.392 | 0.447 | ||
| 2015 | 0.356 | 0.282 | 0.366 | 0.038 | 0.186 | 0.354 | 0.427 | 0.476 | ||
| 2016 | 0.387 | 0.261 | 0.370 | 0.027 | 0.258 | 0.350 | 0.440 | 0.507 | ||
| 2017 | 0.368 | 0.317 | 0.402 | 0.037 | 0.145 | 0.391 | 0.398 | 0.463 | ||
| 2018 | 0.340 | 0.253 | 0.408 | 0.024 | 0.046 | 0.371 | 0.382 | 0.464 | ||
| 2019 | 0.338 | 0.101 | 0.375 | 0.026 | 0.086 | 0.356 | 0.131 | 0.392 | ||
| 2020 | 0.269 | 0.131 | 0.334 | 0.025 | 0.002 | 0.302 | 0.381 | 0.350 | ||
| 2021 | 0.258 | 0.186 | 0.282 | 0.051 | 0.001 | 0.265 | 0.288 | 0.330 | ||
| 年份 | 区域间差异 | 贡献率/% | ||||||||
| 晋东南-晋北 | 晋中-晋东南 | 晋南-晋东南 | 区域内差异 | 区域间差异 | 超变密度 | |||||
| 2006 | 0.486 | 0.458 | 0.153 | 24.705 | 55.150 | 20.145 | ||||
| 2007 | 0.286 | 0.361 | 0.431 | 24.702 | 43.444 | 31.853 | ||||
| 2008 | 0.406 | 0.408 | 0.519 | 25.151 | 33.196 | 41.653 | ||||
| 2009 | 0.253 | 0.368 | 0.481 | 24.199 | 34.935 | 40.865 | ||||
| 2010 | 0.225 | 0.297 | 0.395 | 24.816 | 35.661 | 39.524 | ||||
| 2011 | 0.090 | 0.354 | 0.615 | 18.678 | 58.346 | 22.975 | ||||
| 2012 | 0.157 | 0.319 | 0.497 | 22.425 | 44.686 | 32.888 | ||||
| 2013 | 0.207 | 0.325 | 0.573 | 20.339 | 50.618 | 29.043 | ||||
| 2014 | 0.252 | 0.315 | 0.555 | 20.148 | 51.087 | 28.765 | ||||
| 2015 | 0.303 | 0.324 | 0.559 | 22.793 | 44.108 | 33.099 | ||||
| 2016 | 0.374 | 0.390 | 0.638 | 21.380 | 51.743 | 26.877 | ||||
| 2017 | 0.315 | 0.345 | 0.467 | 24.428 | 33.239 | 42.332 | ||||
| 2018 | 0.216 | 0.325 | 0.508 | 23.097 | 42.969 | 33.934 | ||||
| 2019 | 0.450 | 0.347 | 0.548 | 18.593 | 67.294 | 14.113 | ||||
| 2020 | 0.097 | 0.302 | 0.458 | 20.045 | 54.365 | 25.590 | ||||
| 2021 | 0.202 | 0.258 | 0.459 | 20.540 | 54.926 | 24.534 | ||||
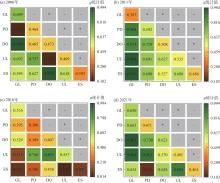
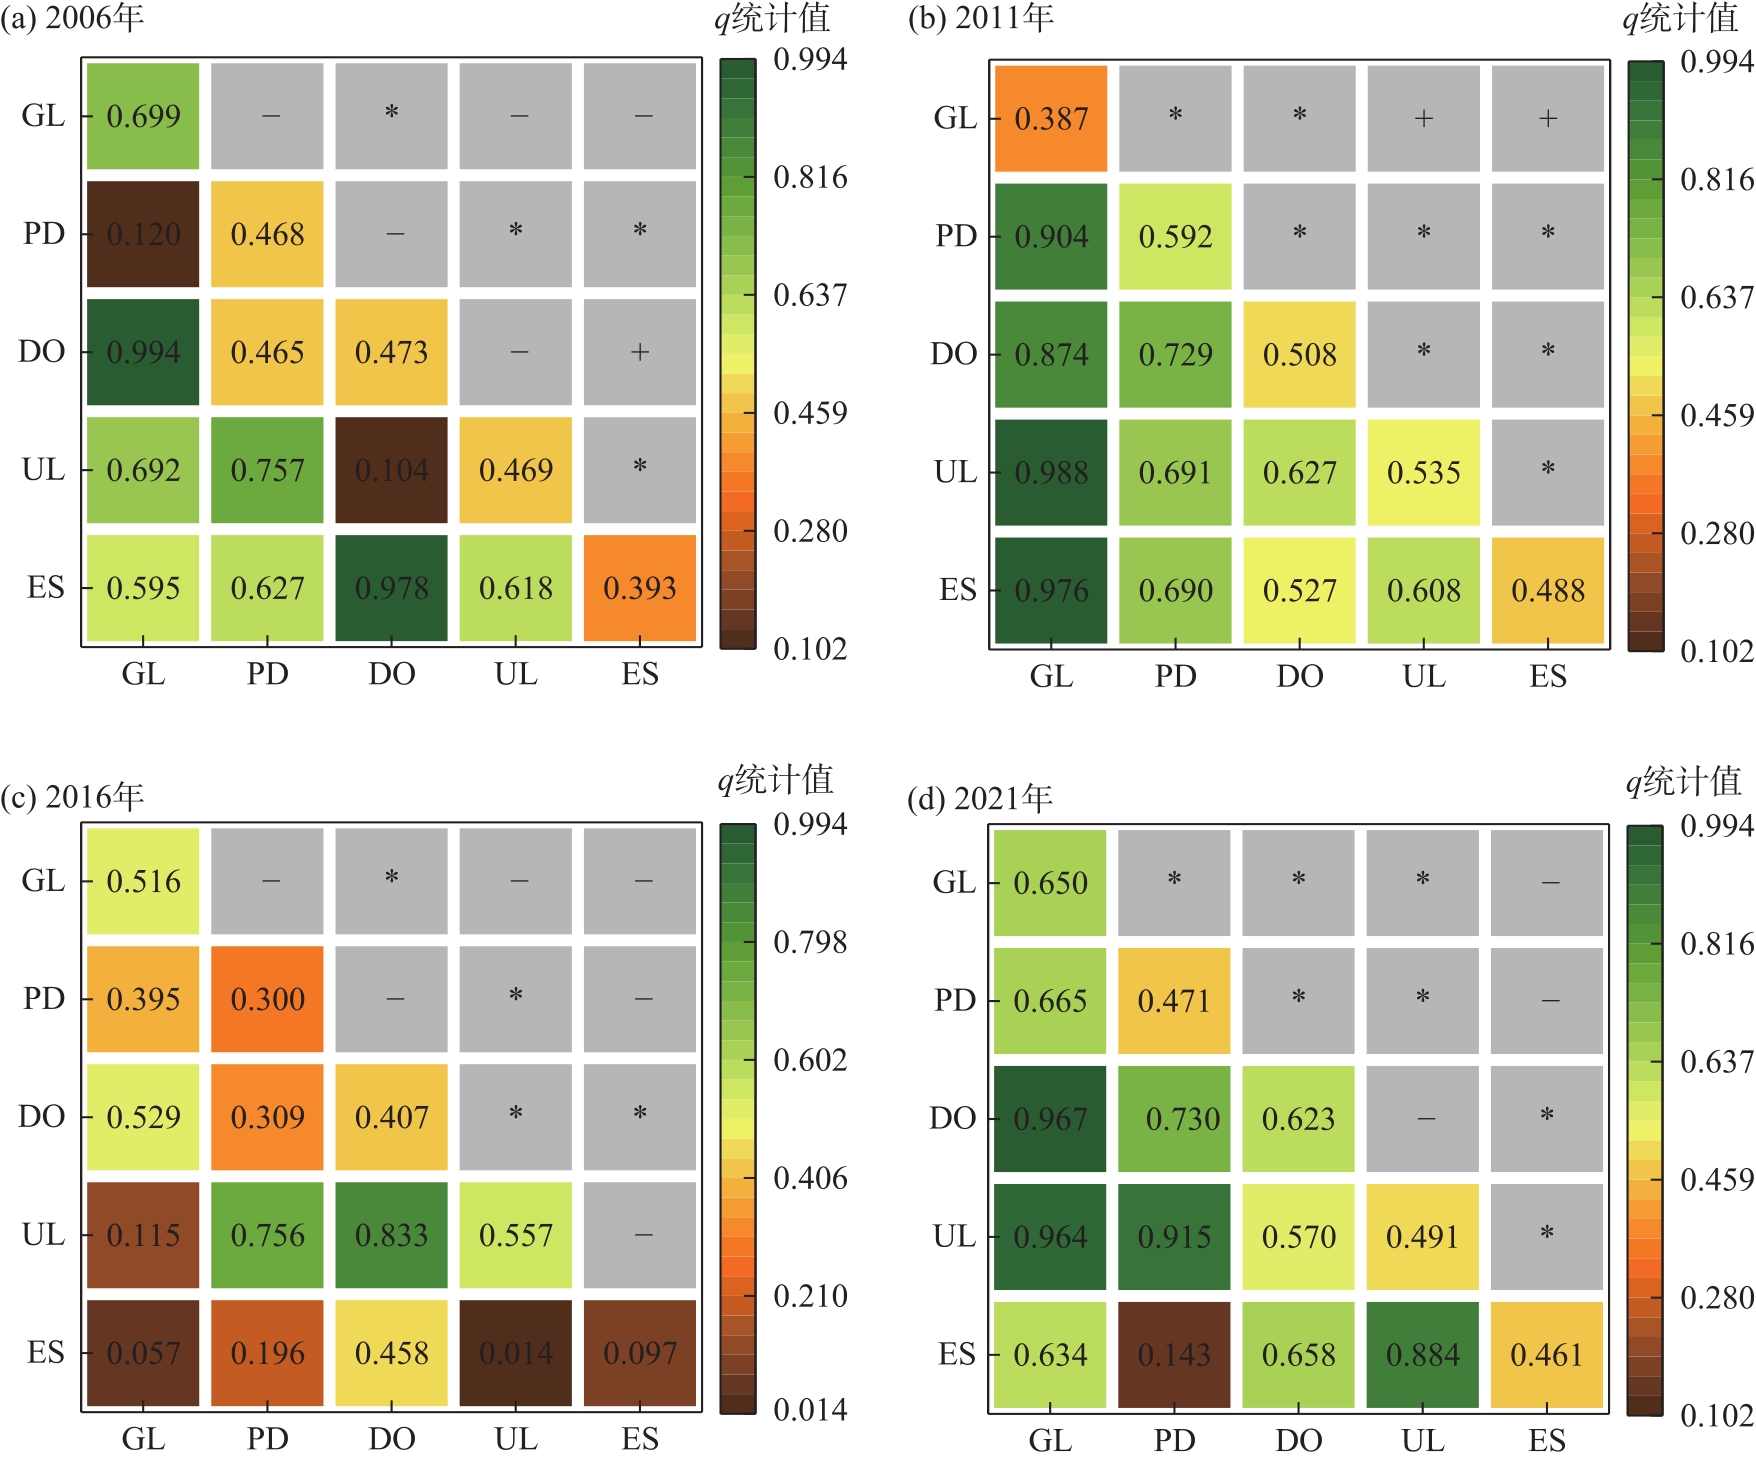
Fig. 4
Detection map of ecological welfare performance drivers"
| [1] |
王圣云, 罗玉婷, 韩亚杰, 等. 中国人类福祉地区差距演变及其影响因素: 基于人类发展指数(HDI)的分析[J]. 地理科学进展, 2018, 37(8): 1150-1158.
doi: 10.18306/dlkxjz.2018.08.014 |
|
[Wang Shengyun, Luo Yuting, Han Yajie, et al. Regional difference and determinants of human well-being in China: Based on the analysis of human development index[J]. Progress in Geography, 2018, 37(8): 1150-1158.]
doi: 10.18306/dlkxjz.2018.08.014 |
|
| [2] | 徐成龙, 庄贵阳. 新型城镇化下城镇可持续发展的内涵解析与差异化特征探讨[J]. 生态经济, 2021, 37(1): 77-82. |
| [Xu Chenglong, Zhuang Guiyang. Exploration on the connotation and differentiation of urban sustainable development under new-type urbanization[J]. Ecological Economy, 2021, 37(1): 77-82.] | |
| [3] |
赵林, 曹乃刚, 高晓彤, 等. 环渤海地区生态福利绩效水平时空特征及其影响因素[J]. 经济地理, 2024, 44(3): 178-188.
doi: 10.15957/j.cnki.jjdl.2024.03.018 |
|
[Zhao Lin, Cao Naigang, Gao Xiaotong, et al. Spatial-temporal pattern of ecological well-being performance level and its influencing factors in Bohai Sea Rim Region[J]. Economic Geography, 2024, 44(3): 178-188.]
doi: 10.15957/j.cnki.jjdl.2024.03.018 |
|
| [4] |
董洁芳, 张凯莉, 屈学书, 等. 黄河流域城市生态福利绩效测算及驱动因素研究[J]. 干旱区地理, 2023, 46(5): 834-845.
doi: 10.12118/j.issn.1000-6060.2022.383 |
|
[Dong Jiefang, Zhang Kaili, Qu Xueshu, et al. Measurement and influencing factors of ecological well-being performance of cities in Yellow River Basin[J]. Arid Land Geography, 2023, 46(5): 834-845.]
doi: 10.12118/j.issn.1000-6060.2022.383 |
|
| [5] | Daly H E. The world dynamics of economic growth: The economics of the steady state[J]. The American Economic Review, 1974, 64(2): 15-21. |
| [6] | Rees W E. Ecological footprints and appropriated carrying capacity: What urban economics leaves out[J]. Environment & Urbanization, 1992, 4(2): 121-130. |
| [7] | Mark N, Simms A, Thompson S, et al. The unhappy planet index: An index of human well-being and environmental impact[M]. London: New Economics Foundation, 2006, 68. |
| [8] | Abdallah S, Thompson S, Michaelson J, et al. The happy planet index 2.0: Why good lives don’t have to cost the earth[M]. London: New Economics Foundation, 2009, 33. |
| [9] | 诸大建. 生态经济学: 可持续发展的经济学和管理学[J]. 中国科学院院刊, 2008, 23(6): 520-530. |
| [Zhu Dajian. Ecological economics: Economics and management of sustainable development[J]. Bulletin of Chinese Academy of Sciences, 2008, 23(6): 520-530.] | |
| [10] |
王圣云, 段练成. 中国生态福利绩效时空格局演变及其驱动效应分析[J]. 地理科学进展, 2023, 42(4): 617-628.
doi: 10.18306/dlkxjz.2023.04.001 |
|
[Wang Shengyun, Duan Liancheng. Evolution of spatio-temporal patterns of ecological well-being performance in China and its driving effects[J]. Progress in Geography, 2023, 42(4): 617-628.]
doi: 10.18306/dlkxjz.2023.04.001 |
|
| [11] | Dietz T, Rosa E A, York R. Environmentally efficient well-being: Is there a Kuznets curve?[J]. Applied Geography, 2010, 10(11): 21-28. |
| [12] | 龙亮军, 王霞. 上海市生态福利绩效评价研究[J]. 中国人口·资源与环境, 2017, 27(2): 84-92. |
| [Long Liangjun, Wang Xia. A study on Shanghai’s ecological well-being performance[J]. China Population, Resources and Environment, 2017, 27(2): 84-92.] | |
| [13] | 魏鹏, 李莉, 李润, 等. 地方政府竞争、环境规制与生态福利绩效[J]. 统计与决策, 2022, 38(22): 164-169. |
| [Wei Peng, Li Li, Li Run, et al. Local government competition, environmental regulation, and ecological welfare performance[J]. Statistics and Decision, 2022, 38(22): 164-169.] | |
| [14] | 谭中明, 康勤, 董蕴仪. 绿色金融支持下的生态福利绩效影响及其空间效应研究[J]. 金融理论与实践, 2023(5): 80-92. |
| [Tan Zhongming, Kang Qin, Dong Yunyi. Research on the impact of ecological welfare performance and its spatial effect supported by green finance[J]. Financial Theory and Practice, 2023(5): 80-92.] | |
| [15] | 朱金鹤, 庞婉玉. 数字经济发展对生态福利绩效的影响[J]. 统计与决策, 2022, 38(24): 79-83. |
| [Zhu Jinhe, Pang Wanyu. The impact of the development of digital economy on the performance of ecological welfare[J]. Statistics and Decision, 2022, 38(24): 79-83.] | |
| [16] |
李成宇, 张士强, 张伟, 等. 中国省际生态福利绩效测算及影响因素研究[J]. 地理科学, 2019, 39(12): 1875-1883.
doi: 10.13249/j.cnki.sgs.2019.12.005 |
|
[Li Chengyu, Zhang Shiqiang, Zhang Wei, et al. Measurement and influencing factors of inter-provincial ecological well-being performance in China[J]. Scientia Geographica Sinica, 2019, 39(12): 1875-1883.]
doi: 10.13249/j.cnki.sgs.2019.12.005 |
|
| [17] |
李在军, 胡美娟. 江苏省生态福利绩效时空演化及影响机制研究[J]. 世界地理研究, 2023, 32(3): 124-135.
doi: 10.3969/j.issn.1004-9479.2023.03.2020926 |
|
[Li Zaijun, Hu Meijuan. Spatial-temporal evolution and formation mechanism of ecological well-being performance in Jiangsu Province[J]. World Regional Studies, 2023, 32(3): 124-135.]
doi: 10.3969/j.issn.1004-9479.2023.03.2020926 |
|
| [18] |
龙亮军, 王霞, 郭兵. 基于改进DEA模型的城市生态福利绩效评价研究——以我国35个大中城市为例[J]. 自然资源学报, 2017, 32(4): 595-605.
doi: 10.11849/zrzyxb.20160515 |
|
[Long Liangjun, Wang Xia, Guo Bing. Evaluation of urban ecological well-being performance based on revised DEA model: A case study of 35 major cities in China[J]. Journal of Natural Resources, 2017, 32(4): 595-605.]
doi: 10.11849/zrzyxb.20160515 |
|
| [19] | 马超, 冯印成, 赵康, 等. 我国矿产资源型城市“无废城市”建设路径探索[J]. 中国环境科学, 2024, 44(9): 5077-5084. |
| [Ma Chao, Feng Yincheng, Zhao Kang, et al. Exploring the construction path of “Zero-waste City” in mineral resource-based cities in China[J]. China Environment Science, 2024, 44(9): 5077-5084.] | |
| [20] |
刘秀丽, 黎文涛, 郭丕斌, 等. 区位导向性政策能否促进资源型城市绿色转型?——以山西“综改区”设立为例[J]. 自然资源学报, 2024, 39(1): 84-103.
doi: 10.31497/zrzyxb.20240105 |
|
[Liu Xiuli, Li Wentao, Guo Pibin, et al. Can location-oriented policies promote the green transformation of resource-based cities? Taking the establishment of “Comprehensive Reform Zone” in Shanxi as an example[J]. Journal of Natural Resources, 2024, 39(1): 84-103.]
doi: 10.31497/zrzyxb.20240105 |
|
| [21] | 徐志雄, 徐维祥, 刘程军. 城市生态福利绩效的动态演进及其影响因子探析——以黄河流域地级及以上城市为例[J]. 城市问题, 2021(7): 52-60. |
| [Xu Zhixiong, Xu Weixiang, Liu Chengjun. Exploring the dynamic evolution of urban ecological welfare performance and its influencing factors: Taking prefecture-level and above cities in the Yellow River Basin as an example[J]. Urban Problems, 2021(7): 52-60.] | |
| [22] | 张善余. 人口地理学概论[M]. 上海: 华东师范大学出版社, 2004: 265-323. |
| [Zhang Shanyu. Introduction to population geography[M]. Shanghai: East China Normal University Press, 2004: 265-323.] | |
| [23] | 秦志琴. 山西省迁移人口空间格局变化及其经济因素分析[J]. 地域研究与开发, 2015, 34(1): 166-171. |
| [Qin Zhiqin. Migration distribution and its economic factors in Shanxi Province[J]. Areal Areal Research and Development, 2015, 34(1): 166-171.] | |
| [24] | Tone K. A slacks-based measure of efficiency in data envelopment analysis[J]. European Journal of Operational Research, 2001, 130(3): 498-509. |
| [25] | Tone K. A slacks-based measure of super-efficiency in data envelopment analysis[J]. European Journal of Operational Research, 2002, 143(1): 32-41. |
| [26] |
任贵秀, 刘凯. 黄河流域绿色创新的时空演化特征及影响因素分析[J]. 干旱区地理, 2024, 47(1): 158-169.
doi: 10.12118/j.issn.1000-6060.2023.313 |
|
[Ren Guixiu, Liu Kai. Spatiotemporal evolution characteristics and influencing factors of green innovation in the Yellow River Basin[J]. Arid Land Geography, 2024, 47(1): 158-169.]
doi: 10.12118/j.issn.1000-6060.2023.313 |
|
| [27] | Dagum C. A new approach to the decomposition of the Gini income inequality ratio[J]. Empirical Economics, 1997, 22(4): 515-531. |
| [28] |
王劲峰, 徐成东. 地理探测器: 原理与展望[J]. 地理学报, 2017, 72(1): 116-134.
doi: 10.11821/dlxb201701010 |
|
[Wang Jinfeng, Xu Chengdong. Geodetector: Principle and prospective[J]. Acta Geographica Sinica, 2017, 72(1): 116-134.]
doi: 10.11821/dlxb201701010 |
|
| [29] |
臧漫丹, 高易, 李金. 行政等级与城市规模对生态福利绩效的影响研究[J]. 自然资源学报, 2022, 37(12): 3201-3216.
doi: 10.31497/zrzyxb.20221212 |
|
[Zang Mandan, Gao Yi, Li Jin. The influence of administrative hierarchy and urban scale on ecological well-being performance[J]. Journal of Natural Resources, 2022, 37(12): 3201-3216.]
doi: 10.31497/zrzyxb.20221212 |
|
||