Arid Land Geography ›› 2022, Vol. 45 ›› Issue (6): 1847-1859.doi: 10.12118/j.issn.1000-6060.2022.119
• Earth Information Sciences • Previous Articles Next Articles
Mihray MOYIDIN1( ),Mamat SAWUT1,2,3(),LI Jinzhao1
Received:2022-03-23
Revised:2022-05-16
Online:2022-11-25
Published:2023-02-01
Contact:
SAWUT Mamat
E-mail:mihray_m@163.com;korxat@xju.edu.cn
Mihray MOYIDIN, Mamat SAWUT, LI Jinzhao. Extraction of cotton planting area based on Sentinel-2 time series data and phenological characteristics[J].Arid Land Geography, 2022, 45(6): 1847-1859.
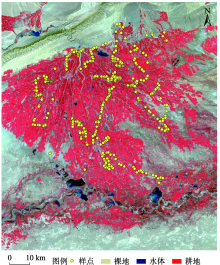
Fig. 1
Schematic diagram of the study area and sample distribution"

Tab. 1
Basic parameters of remote sensing data"
| 卫星名称 | 获取时间 | 影像数量 | 波段数 | 空间分辨率/m |
|---|---|---|---|---|
| Sentinel-2 | 2018年1—12月 | 12 | 12 | 10 |
| 2019年1—12月 | 12 | 12 | 10 | |
| 2020年1—12月 | 12 | 12 | 10 |
Tab. 2
Indices and calculating formulas of vegetation"
| 特征 | 指数全称 | 计算公式 |
|---|---|---|
| 光谱特征 | 归一化植被指数(NDVI) | (B8-B4)/(B8+B4) |
| 红边特征 | 红边1归一化植被指数(RENDVI705) | (B8-B5)/(B8+B5) |
| 红边2归一化植被指数(RENDVI740) | (B8-B6)/(B8+B6) | |
| 红边3归一化植被指数(RENDVI783) | (B8-B7)/(B8+B7) |
Tab. 3
Phenological characteristics"
| 物候特征 | 特征含义 |
|---|---|
| 生长季开始 | 左边NDVI增加到用户定义的拟合函数值的时刻 |
| 生长季结束 | 右边NDVI减少到用户定义的拟合函数值的时刻 |
| 生长季长度 | 生长结束与生长季开始的时间差值 |
| 生长季基值 | 拟合函数左右2部分NDVI最小值的平均值 |
| 生长季中期 | 左边增加到80%和右边降低到80%的平均时间 |
| 拟合函数最大值 | NDVI最大值 |
| 生长季振幅 | 最大值和基值之间均值的差 |
| 生长季左导数 | NDVI增加到左边振幅80%的时间 |
| 生长季右导数 | NDVI减少到右边振幅80%的时间 |
| 生长季大积分 | 从生长季开始到生长季结束的区域面积 |
| 生长季小积分 | NDVI拟合曲线与生长季开始到结束的分量 |
Tab. 4
Combination characteristics of data types used in crop classification"
| 方案 | 特征集 | 波段数目 |
|---|---|---|
| A | 重构后的NDVI时序数据(NDVI Fit) | 36 |
| B | 重构后的RENDVI783时序数据(RENDVI783 Fit) | 36 |
| C | 重构后的RENDVI783 11个物候特征(RENDVI783 Ph) | 11 |
| D | 物候特征优选组合 | 6 |
| E | 重构后的RENDVI783时序数据+11个物候特征(RENDVI783 Fit+RENDVI783 Ph) | 47 |
| F | 重构后的RENDVI783时序数据+物候特征优选组合 | 42 |
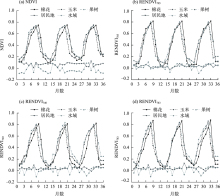
Fig. 2
Curves of typical ground object"

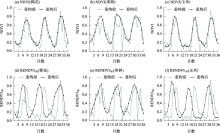
Fig. 3
Crop NDVI and RENDVI783 time curves before and after S-G filtering"
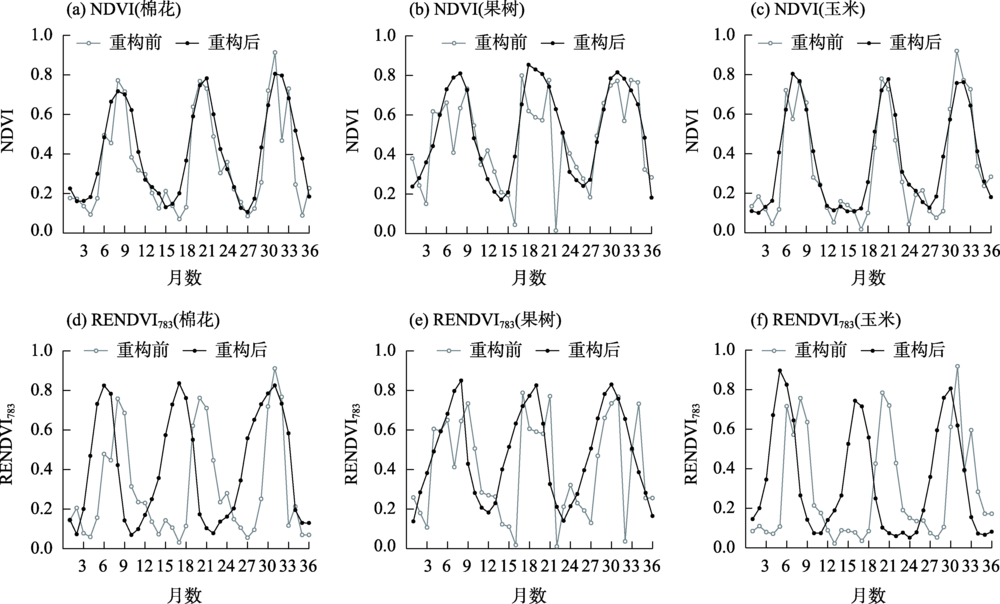
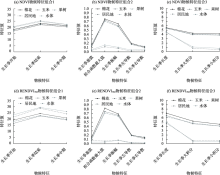
Fig. 4
Different phenological eigenvalues of the same crop in NDVI and RENDVI783"

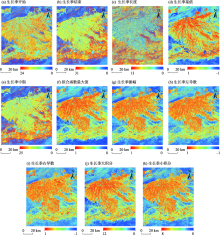
Fig. 5
Phenological feature image"
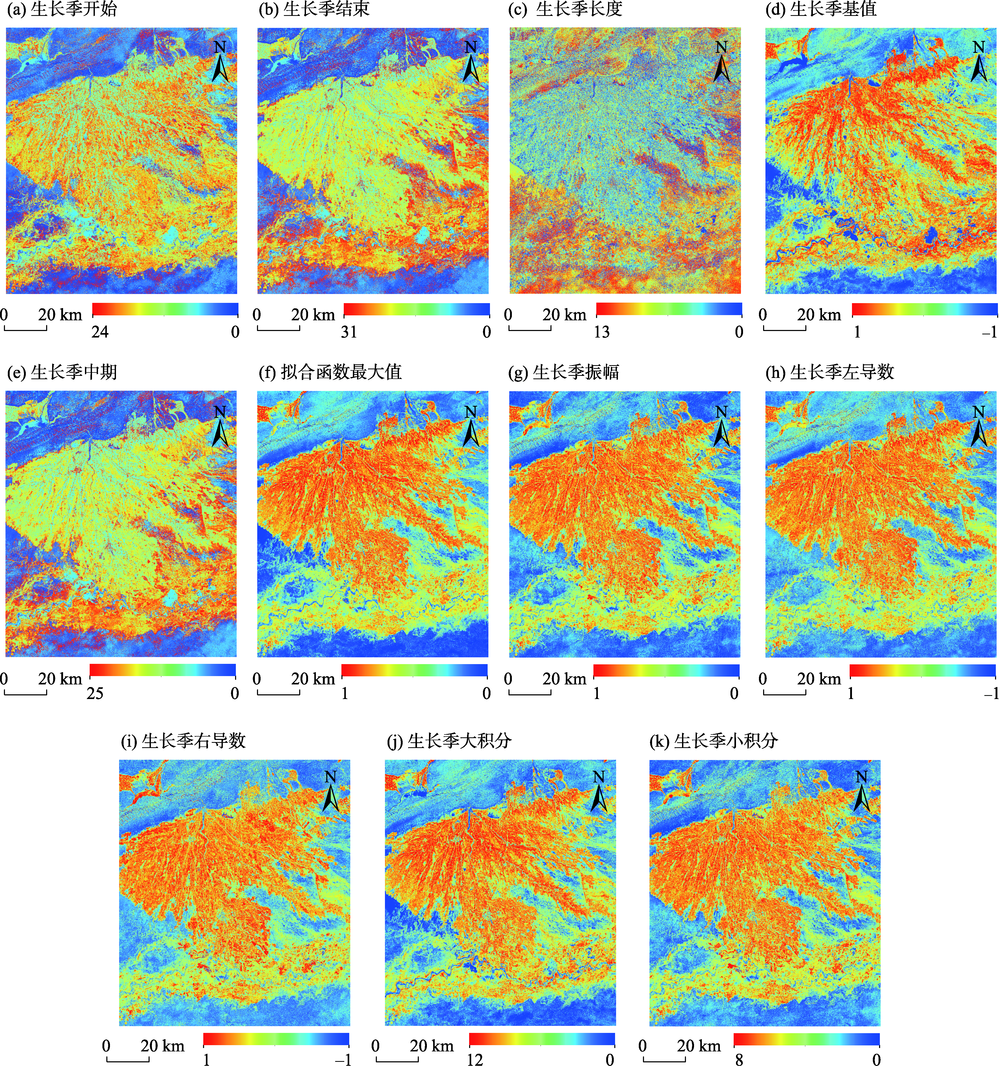
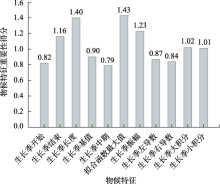
Fig. 6
Importance ordering of feature variables of RENDVI783 time-series phenology"
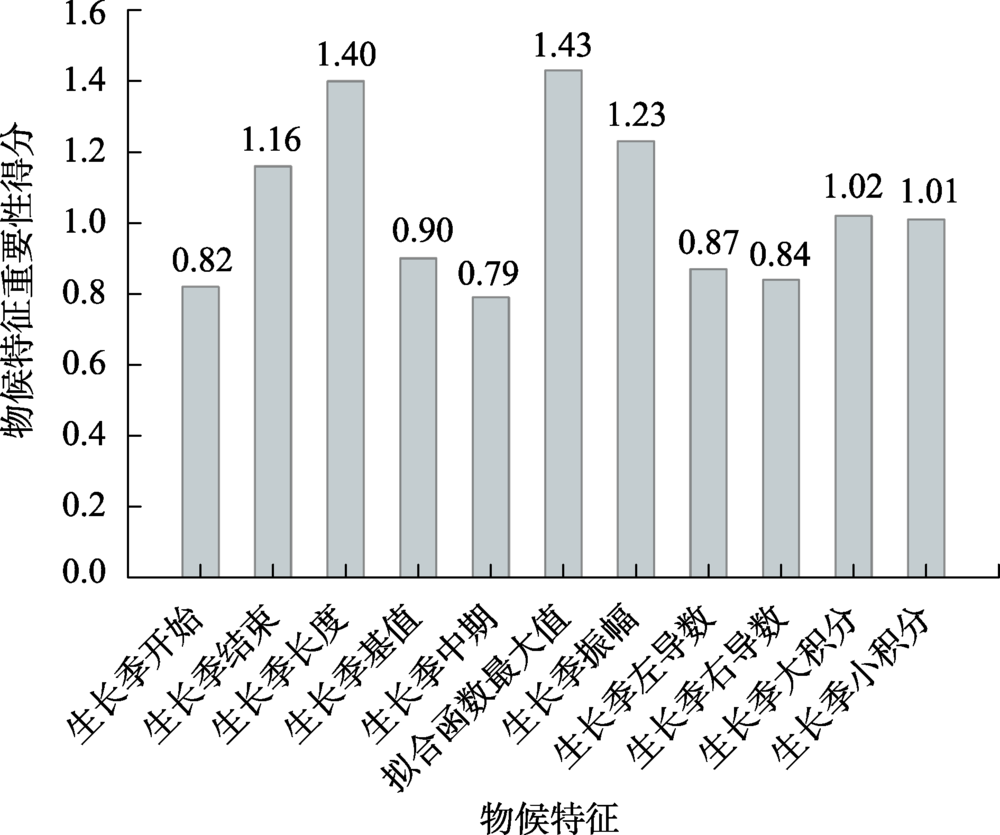
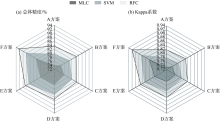
Fig. 7
Precision radar map of three classification methods and different classification plans"

Tab. 5
Comparison of cotton classification accuracy of three classification methods and different plans /%"
| 分类方法 | 分类精度 | A方案 | B方案 | C方案 | D方案 | E方案 | F方案 |
|---|---|---|---|---|---|---|---|
| MLC | 制图精度 | 79.92 | 82.06 | 79.36 | 82.89 | 85.05 | 86.66 |
| 用户精度 | 71.70 | 78.39 | 76.54 | 78.51 | 81.92 | 80.59 | |
| SVM | 制图精度 | 83.01 | 85.03 | 86.11 | 90.09 | 89.33 | 90.88 |
| 用户精度 | 76.22 | 78.21 | 79.55 | 82.56 | 84.17 | 88.44 | |
| RFC | 制图精度 | 87.14 | 89.07 | 90.54 | 91.07 | 87.09 | 88.89 |
| 用户精度 | 79.66 | 82.32 | 83.38 | 85.41 | 89.36 | 94.12 |
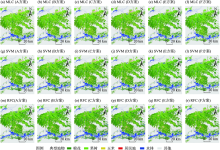
Fig. 8
Comparison of different dataset classification results"

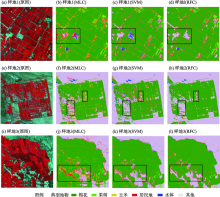
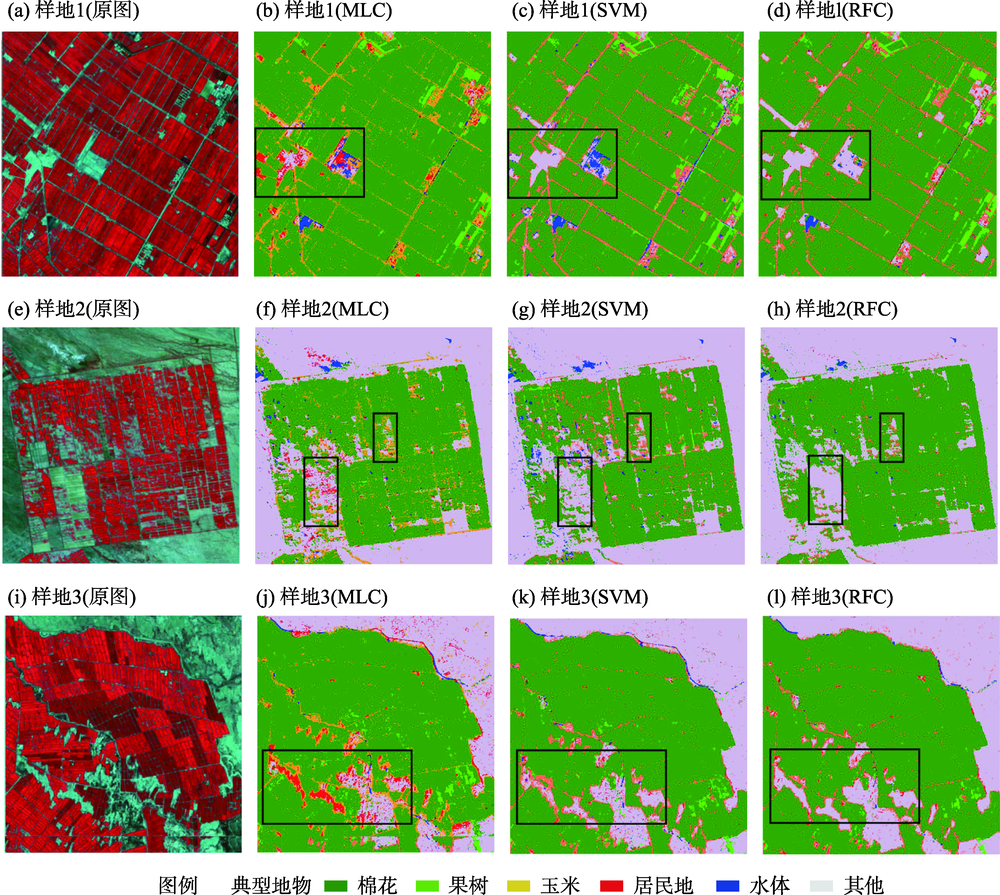
Fig. 9
Partial graph of classification results of three different classification methods"
| [1] | 王晓伟, 苗红萍, 刘卫东, 等. 目标价格对新疆地方棉区棉花规模的调控效应研究[J]. 中国农业资源与区划, 2017, 38(6): 150-156. |
| [Wang Xiaowei, Miao Hongping, Liu Weidong, et al. The regulatory role of target price on cotton scale in Xinjiang local cotton region[J]. Chinese Journal of Agricultural Resources and Regional Planning, 2017, 38(6): 150-156.] | |
| [2] | 王琼, 王克如, 李少昆. HJ卫星数据在棉花种植面积提取中的应用研究[J]. 棉花学报, 2012, 24(6): 503-510. |
| [Wang Qiong, Wang Keru, Li Shaokun. Cotton planting area extraction based on multi-temporal HJ remote sensing[J]. Cotton Science, 2012, 24(6): 503-510.] | |
| [3] | 平跃鹏, 臧淑英. 基于MODIS时间序列及物候特征的农作物分类[J]. 自然资源学报, 2016, 31(3): 503-513. |
| [Ping Yuepeng, Zang Shuying. Crop identification based on MODIS NDVI time-series data and phenological characteristics[J]. Journal of Natural Resources, 2016, 31(3): 503-513.] | |
| [4] | 熊元康, 张清凌. 基于NDVI时间序列影像的天山北坡经济带农业种植结构提取[J]. 干旱区地理, 2019, 42(5): 1105-1114. |
| [Xiong Yuankang, Zhang Qingling. Cropping structure extraction with NDVI time-series images in the northern Tianshan economic belt[J]. Arid Land Geography, 2019, 42(5): 1105-1114.] | |
| [5] | 黄青, 王利民, 滕飞. 利用MODIS_NDVI数据提取新疆棉花播种面积信息及长势监测方法研究[J]. 干旱地区农业研究, 2011, 29(2): 213-217. |
| [Huang Qing, Wang Limin, Teng Fei. MODIS-NDVI-based monitoring of cotton planting areas and growth conditions in Xinjiang[J]. Agricultural Research in the Arid Areas, 2011, 29(2): 213-217.] | |
| [6] | 白燕英, 高聚林, 张宝林. 基于Landsat8影像时间序列NDVI的作物种植结构提取[J]. 干旱区地理, 2019, 42(4): 893-901. |
| [Bai Yanying, Gao Julin, Zhang Baolin. Extraction of crop planting structure based on time-series NDVI of Landsat8 images[J]. Arid Land Geography, 2019, 42(4): 893-901.] | |
| [7] | 李美丽, 尹礼昌, 张园, 等. 基于MODIS-EVI的西南地区植被覆盖时空变化及驱动因素研究[J]. 生态学报, 2021, 41(3): 1138-1147. |
| [Li Meili, Yin Lichang, Zhang Yuan, et al. Spatio-temporal dynamics of fractional vegetation coverage based on MODIS-EVI and its driving factors in southwest China[J]. Acta Ecologica Sinica, 2021, 41(3): 1138-1147.] | |
| [8] | 谢登峰, 张锦水, 潘耀忠, 等. Landsat 8和MODIS融合构建高时空分辨率数据识别秋粮作物[J] .遥感学报, 2015, 19(5): 791-805. |
| [Xie Dengfeng, Zhang Jinshui, Pan Yaozhong, et al. Fusion of MODIS and Landsat 8 images to generate high spatial-temporal resolution data for mapping autumn crop distribution[J]. Journal of Remote Sensing, 2015, 19(5): 791-805.] | |
| [9] | 柳文杰, 曾永年, 张猛. 融合时间序列环境卫星数据与物候特征的水稻种植区提取[J]. 遥感学报, 2018, 22(3): 381-391. |
| [Liu Wenjie, Zeng Yongnian, Zhang Meng. Mapping rice paddy distribution by using time series HJ blend data and phenological parameters[J]. Journal of Remote Sensing, 2018, 22(3): 381-391.] | |
| [10] | 黄林生, 江静, 黄文江, 等. Sentinel-2影像和BP神经网络结合的小麦条锈病监测方法[J]. 农业工程学报, 2019, 35(17): 178-185. |
| [Huang Linsheng, Jiang Jing, Huang Wenjiang, et al. Wheat yellow rust monitoring method based on Sentinel-2 image and BPNN model[J]. Transactions of the Chinese Society of Agricultural Engineering, 2019, 35(17): 178-185.] | |
| [11] | Sonobe R, Yamaya Y, Tani H, et al. Assessing the suitability of data from Sentinel-1A and 2A for crop classification[J]. Giscience & Remote Sensing, 2017, 54(6): 918-938. |
| [12] | 易秋香. 棉花不同生长阶段Sentinel-2卫星植被指数变化特征[J]. 中国棉花, 2019, 46(8): 13-18. |
| [Yi Qiuxiang. The change features of Sentinel-2 vegetation indices with cotton growth[J]. China Cotton, 2019, 46(8): 13-18.] | |
| [13] | 张磊, 宫兆宁, 王启为, 等. Sentinel-2影像多特征优选的黄河三角洲湿地信息提取[J]. 遥感学报, 2019, 23(2): 313-326. |
| [Zhang Lei, Gong Zhaoning, Wang Qiwei, et al. Wetland mapping of Yellow River Delta wetlands based on multi-feature optimization of Sentinel-2 images[J]. Journal of Remote Sensing, 2019, 23(2): 313-326.] | |
| [14] |
何云, 黄翀, 李贺, 等. 基于Sentinel-2A影像特征优选的随机森林土地覆盖分类[J]. 资源科学, 2019, 41(5): 992-1001.
doi: 10.18402/resci.2019.05.15 |
|
[He Yun, Huang Chong, Li He, et al. Land-cover classification of random forest based on Sentinel-2A image feature optimization[J]. Resources Science, 2019, 41(5): 992-1001.]
doi: 10.18402/resci.2019.05.15 |
|
| [15] | 马依拉·热合曼, 买买提·沙吾提, 尼格拉·塔什甫拉提, 等. 基于遥感与GIS的渭—库绿洲生态系统服务价值时空变化研究[J]. 生态学报, 2018, 38(16): 5938-5951. |
| [Reheman Mayila, Sawuti Mamat, Taxipulati Nigela, et al. The ecosystem service value spatial-temporal changes in the Ugan-Kuqa River Delta Oasis based on RS and GIS[J]. Acta Ecologica Sinica, 2018, 38(16): 5938-5951.] | |
| [16] | 安赛日丁·艾尔肯, 买买提·沙吾提, 李金朝. 基于冠层光谱特征的长绒棉叶绿素含量估算[J]. 激光与光电子学进展, 2022, 59(5): 1-11. |
| [Arkin Ansardin, Sawut Mamat, Li Jinzhao. Estimation of chlorophyll content of long-staple cotton based on canopy spectrum characteristics[J]. Laser & Optoelectronics Progress, 2022, 59(5): 1-11.] | |
| [17] | 曹霖. 基于Sentinel-2影像的延庆区森林蓄积量遥感估测研究[D]. 北京: 北京林业大学, 2019. |
| [Cao Lin. Estimation of forest stock volume in Yanqing District based on Sentinel-2 image[D]. Beijing: Beijing Forestry University, 2019.] | |
| [18] |
Sharma L K, Bu H G, Denton A, et al. Active-optical sensors using red NDVI compared to red edge NDVI for prediction of corn grain yield in north Dakota, U.S.A[J]. Sensors, 2015, 15(11): 27832-27853.
doi: 10.3390/s151127832 pmid: 26540057 |
| [19] | 刘德强. 基于MODIS时间序列数据的广西壮族自治区作物分类研究[D]. 南宁: 广西师范学院, 2017. |
| [Liu Deqiang. Study on crop classification of Guangxi Zhuang Autonomous Region on MODIS time series data[D]. Nanning: Guangxi Teacher Education University, 2017.] | |
| [20] | 宋春桥, 柯灵红, 游松财, 等. 基于TIMESAT的3种时序NDVI拟合方法比较研究——以藏北草地为例[J]. 遥感技术与应用, 2011, 26(2): 147-155. |
| [Song Chunqiao, Ke Linghong, You Songcai, et al. Comparison of three NDVI time-series fitting methods based on TIMESAT: Taking the grass land in northern Tibet as case[J]. Remote Sensing Technology and Application, 2011, 26(2): 147-155.] | |
| [21] | 孟祥珍, 刘丹, 黄可, 等. 基于植被物候特征的互花米草提取方法研究——以长三角湿地为例[J]. 海洋通报, 2021, 40(5): 591-600. |
| [Meng Xiangzhen, Liu Dan, Huang Ke, et al. Extraction method of Spartina alterniflora based on vegetation phenology characteristics: A case study of wetlands in the Changjiang River Delta[J]. Marine Science Bulletin, 2021, 40(5): 591-600.] | |
| [22] | 张磊, 宫兆宁, 王启为, 等. Sentinel-2影像多特征优选的黄河三角洲湿地信息提取[J]. 遥感学报, 2019, 23(2): 313-326. |
| [Zhang Lei, Gong Zhaoning, Wang Qiwei, et al. Wetland mapping of Yellow River Delta wetlands based on multi-feature optimization of Sentinel-2 images[J]. Journal of Remote Sensing, 2019, 23(2): 313-326.] | |
| [23] | 孙琳, 宋爱红, 高文秀. 基于最大似然法和SVM法的太湖流域HJ-1B影像分类[J]. 测绘信息与工程, 2012, 37(3): 30-33. |
| [Sun Lin, Song Aihong, Gao Wenxiu. Land use/cover classification in Taihu Lake Basin with HJ-1B image: Comparing maximum likelihood classification and support vector machine methods[J]. Journal of Geomatics, 2012, 37(3): 30-33.] | |
| [24] | Pal M, Foody G M. Feature selection for classification of hyperspectral data by SVM[J]. IEEE Transactions on Geoscience & Remote Sensing, 2010, 48(5): 2297-2307. |
| [25] |
王利民, 刘佳, 杨玲波, 等. 随机森林方法在玉米-大豆精细识别中的应用[J]. 作物学报, 2018, 44(4): 569-580.
doi: 10.3724/SP.J.1006.2018.00569 |
|
[Wang Limin, Liu Jia, Yang Lingbo, et al. Application of random forest method in maize-soybean accurate identification[J]. Acta Agronomica Sinica, 2018, 44(4): 569-580.]
doi: 10.3724/SP.J.1006.2018.00569 |
|
| [26] | 郝鹏宇. 基于多时相遥感数据的农作物分类研究[D]. 北京: 中国科学院大学, 2017. |
| [Hao Pengyu. Crop classification using time-series remote sensing data[D]. Beijing: University of Chinese Academy of Sciences, 2017.] | |
| [27] | 伊尔潘·安尼瓦尔, 买买提·沙吾提, 买合木提·巴拉提. 基于GF-2影像和Unet模型的棉花分布识别[J/OL]. 自然资源遥感.[2022-04-26]. http://kns.cnki.net/kcms/detail/10.1759.P.20211109.1111.006.html. |
| [Anwar Erpan, Sawut Mamat, Balati Maihemuti. Cotton distribution recognition based on GF-2 image and Unet medel[J/OL]. Remote Sensing for Natural Resources.[2022-04-26]. http://kns.cnki.net/kcms/detail/10.1759.P.20211109.1111.006.html. ] | |
| [28] | 韩振锋. 融合环境卫星和MODIS数据的甘蔗种植区提取[D]. 南宁: 南宁师范大学, 2019. |
| [Han Zhenfeng. Sugarcane extraction based on fused HJ satellite and MODIS data[D]. Nanning: Nanning Normal University, 2019.] | |
| [29] | 陈波, 王加胜. 基于Landsat影像的马龙区水稻种植区遥感提取与分析[J]. 江苏科技信息, 2021, 38(5): 56-58. |
| [Chen Bo, Wang Jiasheng. Remote sensing extraction and analysis of rice planting areas in Malong District based on Landsat images[J]. 2021, 38(5): 56-58.] | |
| [30] | 彭壮壮, 武永斌, 朱梦豪, 等. 基于时序Sentinel-2影像的农作物分类研究[J]. 测绘与空间地理信息, 2021, 44(12): 81-84. |
| [Peng Zhuangzhuang, Wu Yongbin, Zhu Menghao, et al. Research on crop classification based on time series Sentinel-2 images[J]. Geomatics & Spatial Information Technology, 2021, 44(12): 81-84.] | |
| [31] | 周增光, 唐娉. 基于质量权重的Savitzky-Golay时间序列滤波方法[J]. 遥感技术与应用, 2013, 28(2): 232-239. |
| [Zhou Zengguang, Tang Ping. VI-quality-based Savitzky-Golay method for time series data[J]. Remote Sensing Technology and Application, 2013, 28(2): 232-239.] | |
| [32] | 姚茂林, 江洪, 张丽玉. 基于Sentinel-2影像红边光谱指数与特征优选的竹林提取研究[J/OL]. 海南大学学报(自然科学版).[2022-04-25]. http://kns.cnki.net/kcms/detail/46.1013.N.20220421.1203.002.html. |
| [Yao Maolin, Jiang Hong, Zhang Liyu. Bamboo extraction using improved spectral indices and random forest gini index[J/OL]. Natural Science Journal of Hainan University.[2022-04-25]. http://kns.cnki.net/kcms/detail/46.1013.N.20220421.1203.002.html. ] | |
| [33] |
古丽努尔·依沙克, 买买提·沙吾提, 马春玥. 基于多时相双极化SAR数据的作物种植面积提取[J]. 作物学报, 2020, 46(7): 1099-1111.
doi: 10.3724/SP.J.1006.2020.94134 |
|
[Ishake Gulnur, Shawuti Mamat, Ma Chunyue. Extraction of crop acreage based on multi-temporal and dual-polarization SAR data[J]. Acta Agronomica Sinica, 2020, 46(7): 1099-1111.]
doi: 10.3724/SP.J.1006.2020.94134 |
| [1] | XIONG Yuan-kang, ZHANG Qing-ling. Cropping structure extraction with [WTHX]NDVI[WTHZ] timeseries images in the northern Tianshan Economic Belt [J]. Arid Land Geography, 2019, 42(5): 1105-1114. |
|
||