Arid Land Geography ›› 2024, Vol. 47 ›› Issue (6): 932-941.doi: 10.12118/j.issn.1000-6060.2023.302
• Climatology and Hydrology • Previous Articles Next Articles
JIAO Meiling( ), HAN Jing, CAO Yanchao, WANG Juan, QIN Tuo, HE Tao
Received:2023-06-21
Revised:2023-09-04
Online:2024-06-25
Published:2024-07-09
JIAO Meiling, HAN Jing, CAO Yanchao, WANG Juan, QIN Tuo, HE Tao. Characteristics of air pollution and meteorological factors in Qingyang City[J].Arid Land Geography, 2024, 47(6): 932-941.
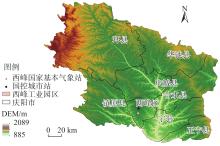
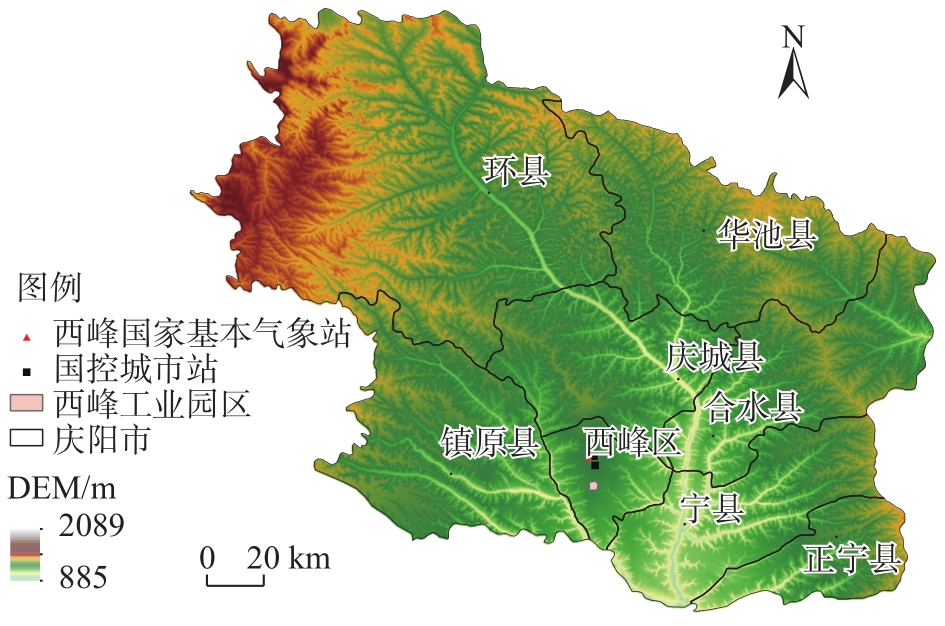
Fig. 1
Schematic diagram of the research area"
Tab. 1
AQI index grading standards"
| 污染级别 | AQI指数范围 |
|---|---|
| 优 | 0~50 |
| 良 | 51~100 |
| 轻度污染 | 101~150 |
| 中度污染 | 151~200 |
| 重度污染 | 201~300 |
| 严重污染 | >300 |
Tab. 2
National standard for pollutant concentration limits (class II, zone II)"
| 污染物 | 浓度限值 | |
|---|---|---|
| 24 h平均 | 年平均 | |
| SO2/μg·m-3 | 150 | 60 |
| NO2/μg·m-3 | 80 | 40 |
| PM10/μg·m-3 | 150 | 70 |
| PM2.5/μg·m-3 | 75 | 35 |
| O3/μg·m-3 | 160 | - |
| CO/mg·m-3 | 4 | - |
Tab. 3
Annual days and compliance rates of AQI classification in Qingyang City"
| 年份 | 空气质量级别/d | AQI 达标率/% | |||||
|---|---|---|---|---|---|---|---|
| 优 | 良 | 轻度污染 | 中度污染 | 重度污染 | 严重污染 | ||
| 2015 | 86 | 210 | 58 | 9 | 1 | 1 | 80.9 |
| 2016 | 56 | 266 | 30 | 11 | 2 | 1 | 88.0 |
| 2017 | 43 | 275 | 29 | 12 | 3 | 2 | 87.1 |
| 2018 | 56 | 265 | 29 | 8 | 3 | 4 | 87.9 |
| 2019 | 35 | 272 | 40 | 14 | 2 | 2 | 84.9 |
| 2020 | 55 | 257 | 49 | 4 | 1 | 0 | 85.2 |
| 2021 | 89 | 249 | 16 | 8 | 1 | 2 | 92.6 |
| 平均 | 62 | 254 | 36 | 9 | 2 | 2 | 86.6 |
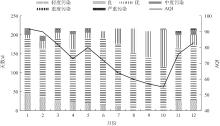
Fig. 2
Monthly changes of AQI and days of pollutants occurrence classification in Qingyang City"
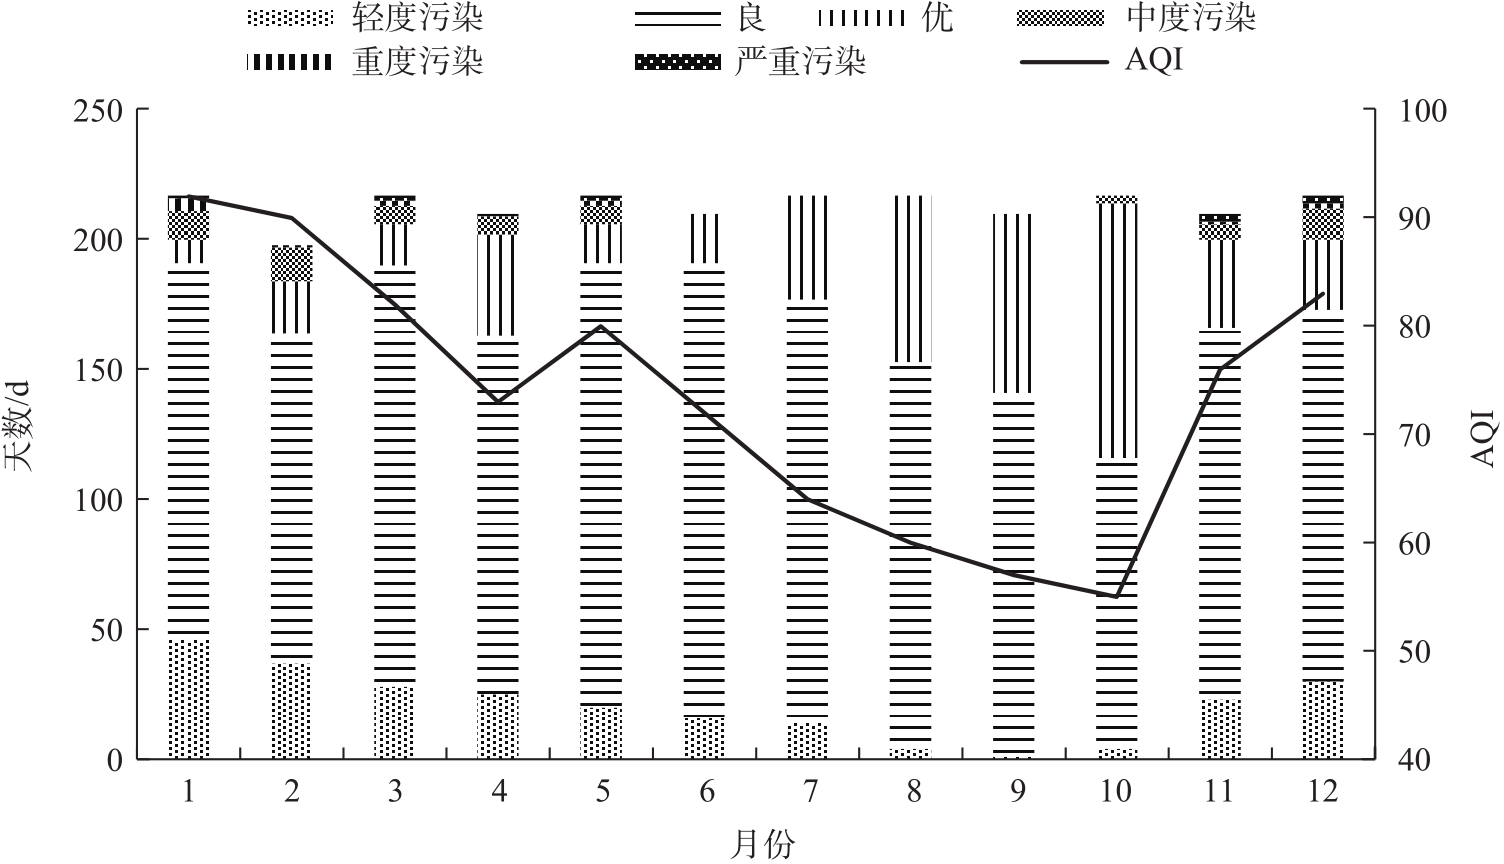

Fig. 3
Days of primary pollutants occurrence in each season in Qingyang City"
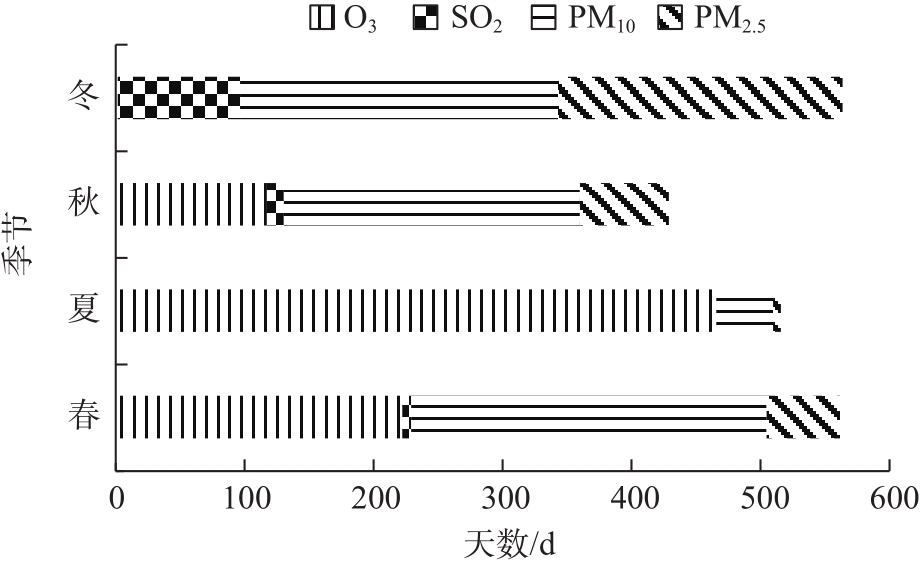
Fig. 4
Annual changes in the concentration of six pollutants in Qingyang City"

Fig. 5
Monthly changes in the concentration of six pollutants in Qingyang City"
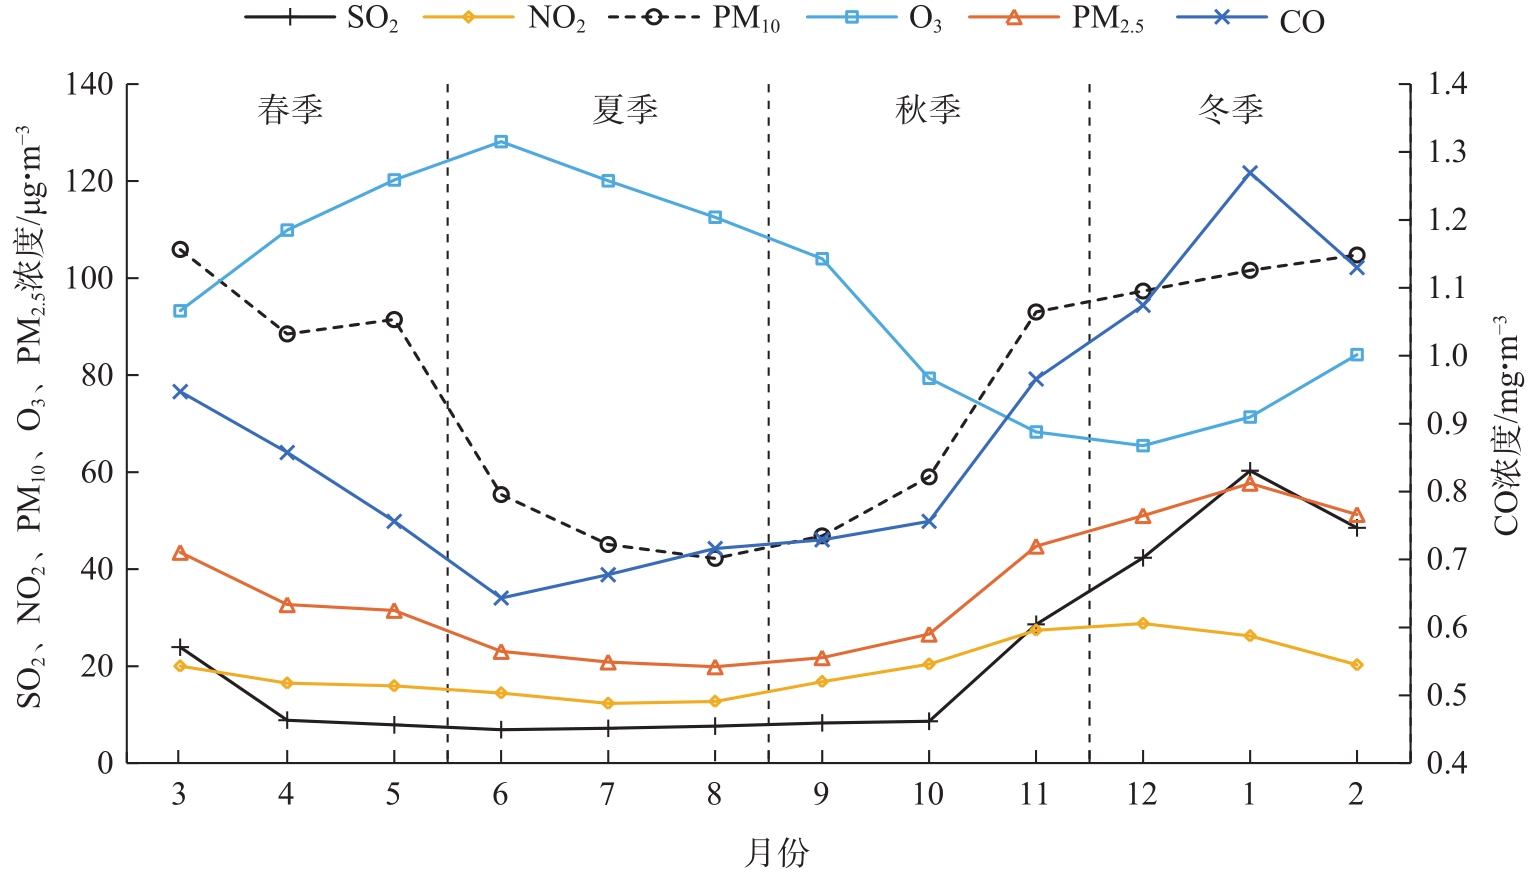

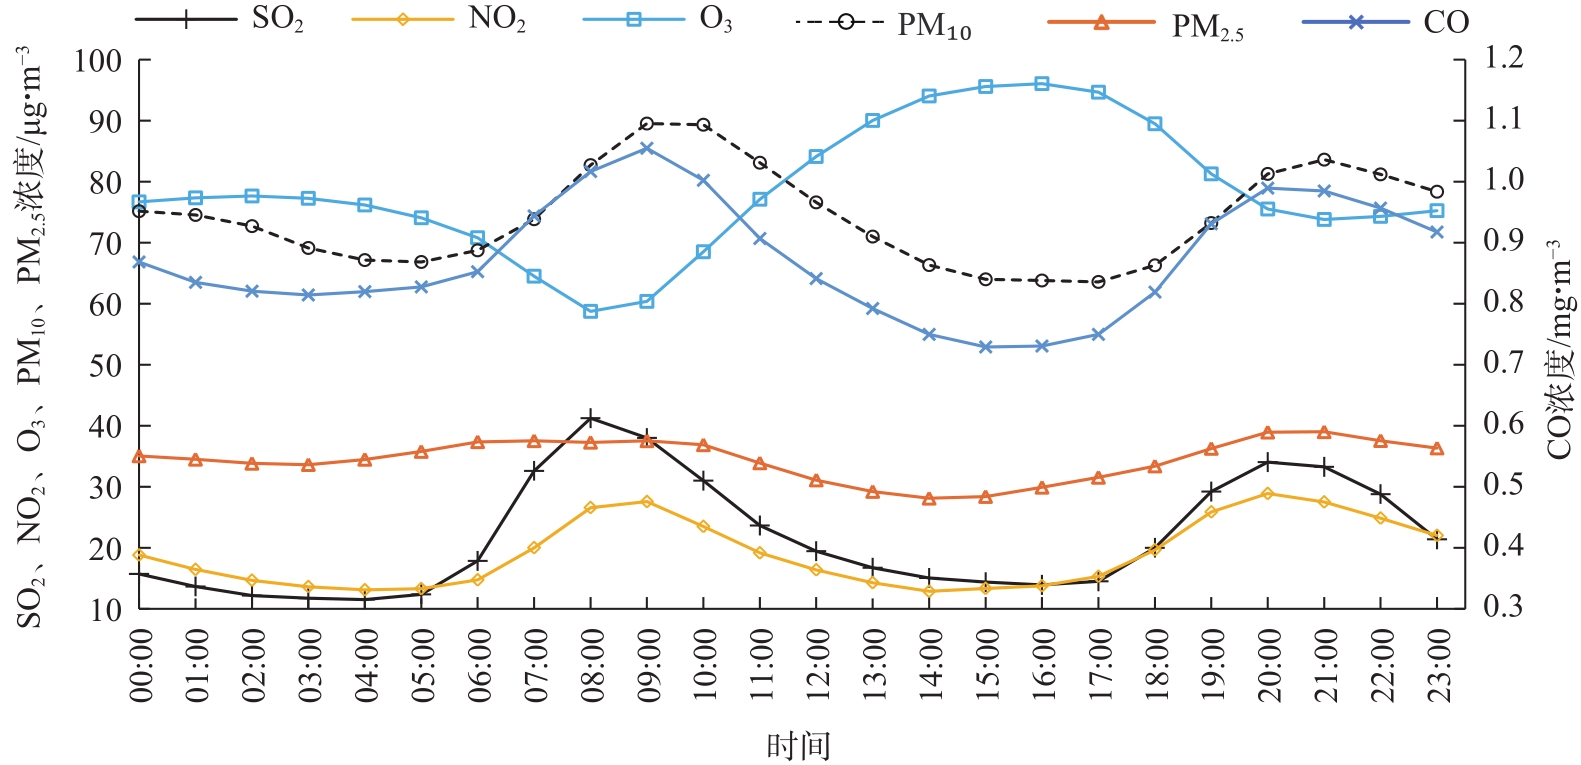
Fig. 6
Daily changes in the concentration of six pollutants in Qingyang City"
Tab. 4
Correlation between six air pollutants and meteorological factors in Qingyang City"
| 污染物 | 气压 | 降水量 | 气温 | 相对湿度 | 日照时数 | 最大风速 |
|---|---|---|---|---|---|---|
| SO2 | 0.430** | -0.391** | -0.584** | -0.301** | -0.039 | 0.263* |
| NO2 | 0.676** | -0.553** | -0.708** | -0.254* | -0.203 | 0.378** |
| PM10 | 0.417** | -0.624** | -0.624** | -0.567** | 0.068 | 0.454** |
| CO | 0.402** | -0.370** | -0.558** | -0.200 | -0.110 | 0.295** |
| O3 | -0.821** | -0.412** | 0.818** | -0.060 | 0.491** | -0.318** |
| PM2.5 | 0.570** | -0.671** | -0.791** | -0.445** | -0.100 | 0.374** |
Tab. 5
Daily mean of meteorological elements at different concentration levels of PM10, PM2.5 and O3"
| 污染物 | 时段 | 气象要素 | |||||||
|---|---|---|---|---|---|---|---|---|---|
| 气压/hPa | 气温/℃ | 相对湿度/% | 最大风速/m·s-1 | 主要风向(频率/%) | 分量风向(频率/%) | ||||
| PM10 | 3—4月超标日 | 856.4 | 10.8 | 44 | 5.6 | N(61) | N(25) | NW(34) | NE(2) |
| 3—4月达标日 | 858.4 | 9.2 | 53 | 4.4 | S(45) | S(21) | SE(11) | SW(13) | |
| 11月—翌年5月超标日 | 858.7 | 6.2 | 48 | 5.1 | N(46) | N(20) | NW(25) | NE(1) | |
| 11月—翌年5月达标日 | 860.4 | 5.0 | 52 | 4.2 | S(40) | S(15) | SE(10) | SW(15) | |
| PM2.5 | 12月—翌年1月超标日 | 860.9 | -1.1 | 61 | 3.7 | S(50) | S(19) | SE(14) | SW(17) |
| 12月—翌年1月达标日 | 863.5 | -2.4 | 47 | 4.0 | N(40) | N(13) | NW(20) | NE(7) | |
| 11月—翌年5月超标日 | 857.8 | 5.2 | 60 | 4.1 | S(55) | S(20) | SE(17) | SW(18) | |
| 11月—翌年5月达标日 | 860.5 | 5.0 | 50 | 4.3 | N(40) | N(13) | NW(22) | NE(5) | |
| O3 | 6—7月超标日 | 852.1 | 23.5 | 49 | 4.2 | S(86) | S(37) | SE(13) | SW(36) |
| 6—7月达标日 | 852.9 | 21.2 | 64 | 4.4 | S(60) | S(25) | SE(13) | SW(22) | |
| 4—8月超标日 | 852.6 | 22.7 | 43 | 4.3 | S(81) | S(31) | SE(17) | SW(33) | |
| 4—8月达标日 | 854.8 | 18.4 | 60 | 4.6 | S(51) | S(24) | SE(10) | SW(17) | |
Tab. 6
Meteorological indicators for exceeding daily concentrations of PM10, PM2.5 and O3"
| 污染物 | 气温 /℃ | 相对湿度 /% | 气压 /hPa | 最大风速 /m·s-1 | 盛行风向 /分量风向 |
|---|---|---|---|---|---|
| PM10 | 10~20 | 20~50 | 850~863 | ≥4 | N/NW |
| PM2.5 | -5~3 | 40~80 | 854~867 | 2~6 | S/SW |
| O3 | 19~26 | 25~60 | 851~858 | 3~5 | S/SW |
| [1] | 李惠娟, 周德群, 魏永杰. 我国城市PM2.5污染的健康风险及经济损失评价[J]. 环境科学, 2018, 39(8): 3467-3475. |
| [Li Huijuan, Zhou Dequn, Wei Yongjie. An assessment of PM2.5related health risks and associated economic losses in Chinese cities[J]. Environmental Science, 2018, 39(8): 3467-3475.] | |
| [2] | Chen W Q, Zheng R S, Baade P D, et al. Cancer statistics in China, 2015[J]. CA: A Cancer Journal for Clinicians, 2016, 66(2): 115-132. |
| [3] | WHO. Ambient air pollution: A global assessment of exposure and burden of disease[Z]. Geneva, Switzerland: World Health Organization, 2016: 44. |
| [4] | Lin H, Guo Y, Ruan Z, et al. Ambient PM2.5 and O3 and their combined effects on prevalence of presbyopia among the elderly: A cross-sectional study in six low- and middle-income countries[J]. Science of the Total Environment, 2019, 655: 168-173. |
| [5] | Gao J, Woodward A, Vardoulakis S, et al. Haze, public health and mitigation measures in China: A review of the current evidence for further policy response[J]. Science of the Total Environment, 2017, 578: 148-157. |
| [6] | 王冠岚, 薛建军, 张建忠. 2014年京津冀空气污染时空分布特征及主要成因分析[J]. 气象与环境科学, 2016, 39(1): 34-42. |
| [Wang Guanlan, Xue Jianjun, Zhang Jianzhong. Analysis of spatial-temporal distribution characteristics and main cause of air pollution in Beijing-Tianjin-Hebei region in 2014[J]. Meteorological and Environmental Sciences, 2016, 39(1): 34-42.] | |
| [7] | 佘倩楠, 徐茜, 周陶冶, 等. 长三角地区2015年大气重污染特征及其影响因素[J]. 环境科学学报, 2018, 38(8): 3185-3196. |
| [She Qiannan, Xu Qian, Zhou Taoye, et al. Characteristics of heavy air pollution episode and its impacting factors in the Yangtze River Delta during 2015[J]. Acta Scientiae Circumstantiae, 2018, 38(8): 3185-3196.] | |
| [8] | 赖安琪, 陈晓阳, 刘一鸣, 等. 珠江三角洲高质量浓度PM2.5和O3复合污染特征[J]. 中山大学学报(自然科学版), 2018, 57(4): 30-36. |
| [Lai Anqi, Chen Xiaoyang, Liu Yiming, et al. Characteristics of complex pollution with high concentrations of PM2.5 and O3 over the Pearl River Delta, China[J]. Acta Scientiarum Naturalium Universitatis Sunyatseni, 2018, 57(4): 30-36.] | |
| [9] | 郑小华, 李明星, 刘慧, 等. 汾渭平原空气质量的时空特征及其与气象因子的关系[J]. 环境科学学报, 2020, 40(11): 4113-4121. |
| [Zheng Xiaohua, Li Mingxing, Liu Hui, et al. Spatiotemporal characteristics of air quality and their relationships with meteorological factors over the Fenwei Plain[J]. Acta Scientiae Circum- stantiae, 2020, 40(11): 4113-4121.] | |
| [10] |
Wang W, Primbs T, Tao S, et al. Atmospheric particulate matter pollution during the 2008 Beijing Olympics[J]. Environmental Science and Technology, 2009, 43(14): 5314-5320.
doi: 10.1021/es9007504 pmid: 19708359 |
| [11] | Roustan Y, Pausader M, Seigneur C. Estimating the effect of on-road vehicle emission controls on future air quality in Paris, France[J]. Atmospheric Environment, 2010, 45(37): 6828-6836. |
| [12] | 董建红, 张志斌, 刘奔腾, 等. “三生”空间视角下西北地区生态环境质量分异机制的地理探测[J]. 干旱区地理, 2023, 46(4): 515-526. |
| [Dong Jianhong, Zhang Zhibin, Liu Benteng, et al. Geographical exploration of the spatial differentiation mechanism of eco-environmental quality in northwest China from the perspective of “production-living-ecological”space[J]. Arid Land Geography, 2023, 46(4): 515-526.] | |
| [13] | 罗逸臻, 黄远程, 王涛. 关中平原城市群生态环境质量时空变化特征及其驱动力[J]. 地球科学与环境学报, 2023, 45(6): 1316-1329. |
| [Luo Yizhen, Huang Yuancheng, Wang Tao. Spatial-temporal variation characteristics of ecological environment quality and their driving forces in Guanzhong Plain urban agglomeration, China[J]. Journal of Earth Sciences and Environment, 2023, 45(6): 1316-1329.] | |
| [14] | 李淑婷, 李霞, 毛列尼·阿依提看, 等. 2017—2019年中天山北坡城市群大气污染及污染天气类型特征[J]. 干旱区地理, 2022, 45(4): 1082-1092. |
| [Li Shuting, Li Xia, Ayikan Mauren, et al. Characteristics of air pollution and its polluted weather types of urban agglomeration on the north slope of the middle Tianshan Mountains from 2017 to 2019[J]. Arid Land Geography, 2022, 45(4): 1082-1092.] | |
| [15] | 张小娟, 李莉, 王红丽, 等. 2010—2016年上海城区臭氧长时间序列变化特征初探[J]. 环境科学学报, 2019, 39(1): 86-94. |
| [Zhang Xiaojuan, Li Li, Wang Hongli, et al. Preliminary study on the long-term trends of ozone in urban Shanghai from 2010 to 2016[J]. Acta Scientiae Circumstantiae, 2019, 39(1): 86-94.] | |
| [16] |
臧星华, 鲁垠涛, 姚宏, 等. 中国主要大气污染物的时空分布特征研究[J]. 生态环境学报, 2015, 24(8): 1322-1329.
doi: 10.16258/j.cnki.1674-5906.2015.08.010 |
| [Zang Xinghua, Lu Yintao, Yao Hong, et al. The temporal and spatial distribution characteristics of main air pollutants in China[J]. Ecology and Environmental Sciences, 2015, 24(8): 1322-1329.] | |
| [17] | 王磊, 刘端阳, 韩桂荣, 等. 南京地区近地面臭氧浓度与气象条件关系研究[J]. 环境科学学报, 2018, 38(4): 1285-1296. |
| [Wang Li, Liu Ruiyang, Han Guirong, et al. Study on the relationship between surface ozone concentrations and meteorological conditions in Nanjing, China[J]. Acta Scientiae Circumstantiae, 2018, 38(4): 1285-1296.] | |
| [18] | Zhu X, Ma Z, Li Z, et al. Impacts of meteorological conditions on nocturnal surface ozone enhancement during the summertime in Beijing[J]. Atmospheric Environment, 2020, 225: 117368, doi: 10.1016/j.atmosenv.2020.117368. |
| [19] | Edwards M P, Aikin C K, Dube P W, et al. Transition from high- to low-NOx control of night-time oxidation in the southeastern US[J]. Nature Geoscience, 2017, 10(7): 490-495. |
| [20] | 齐冰, 牛彧文, 杜荣光, 等. 杭州市近地面大气臭氧浓度变化特征分析[J]. 中国环境科学, 2017, 37(2): 443-451. |
| [Qi Bing, Niu Yuwen, Du Rongguang, et al. Characteristics of surface ozone concentration in urban site of Hangzhou[J]. China Environmental Science, 2017, 37(2): 443-451.] | |
| [21] | 杨婧, 朱海斌, 刘建军, 等. 气象条件对银川市区近地面臭氧质量浓度的影响[J]. 干旱气象, 2021, 39(2):302-308, 325. |
| [Yang Jing, Zhu Haibin, Liu Jianjun, et al. Study on the effects of meteorological conditions on ozone mass concentration near surface in Yinchuan[J]. Journal of Arid Meteorology, 2021, 39(2): 302-308, 325.] | |
| [22] | 刘超, 董俊玲, 田力, 等. 2017年郑州市臭氧浓度特征及气象因素分析[J]. 气象与环境科学, 2022, 45(4): 33-38. |
| [Liu Chao, Dong Junling, Tian Li, et al. Analysis of ozone concentration characteristics and meteorological factors in Zhengzhou in 2017[J]. Meteorological and Environmental Sciences, 2022, 45(4): 33-38.] | |
| [23] | 岳岩裕, 吴翠红, 许可, 等. 武汉城市圈臭氧污染特征及气象因子影响分析[J]. 气象与环境科学, 2021, 44(3): 16-23. |
| [Yue Yanyu, Wu Cuihong, Xu Ke, et al. Analysis of ozone pollution characteristics and meteorological impact factors in Wuhan metropolitan area[J]. Meteorological and Environmental Sciences, 2021, 44(3): 16-23.] | |
| [24] | 吕长春. 自贡市臭氧浓度变化特征及其与气象因素的相关性研究[J]. 气象与环境科学, 2021, 44(3): 47-53. |
| [Lü Changchun. Variation characteristics of ozone concentration and its correlation with meteorological elements in Zigong City[J]. Meteorological and Environmental Sciences, 2021, 44(3): 47-53.] | |
| [25] | 李伟杰, 赵胡笳, 陈权亮, 等. 2020年1—3月四川地区大气污染物变化特征分析[J]. 气象与环境学报, 2022, 38(1): 15-22. |
| [Li Weijie, Zhao Hujia, Chen Quanliang, et al. Variation characteristics of air pollctants in Sichuan region during January-March of 2020[J]. Journal of Meteorology and Environment, 2022, 38(1): 15-22.] | |
| [26] | 郭安可, 殷小鸽, 王治民, 等. 工业园区大气污染过程与气象风场响应关系研究[J]. 气象与环境学报, 2022, 38(1): 23-32. |
| [Guo Anke, Yin Xiaoge, Wang Zhimin, et al. A study on the response relationship between air pollution process and meteorological wind field in an industrial park[J]. Journal of Meteorology and Environment, 2022, 38(1): 23-32.] | |
| [27] |
杨宇, 何唯, 李鹏, 等. 中国城市化与PM2.5浓度时空动态及作用机理——基于胡焕庸线变迁的视角[J]. 资源科学, 2022, 44(10): 2100-2113.
doi: 10.18402/resci.2022.10.12 |
| [Yang Yu, He Wei, Li Peng, et al. Spatiotemporal dynamics and mechanisms in urbanization and PM2.5 concentration in China: A perspective based on the transition of Hu Huanyong line[J]. Resources Science, 2022, 44(10): 2100-2113.] |
|
||