干旱区地理 ›› 2025, Vol. 48 ›› Issue (4): 704-716.doi: 10.12118/j.issn.1000-6060.2024.396 cstr: 32274.14.ALG2024396
邓光耀1,2( ), 沈迎辰1()
收稿日期:2024-06-26
修回日期:2024-09-16
出版日期:2025-04-25
发布日期:2025-04-18
通讯作者:
沈迎辰(2000-),女,硕士研究生,主要从事资源环境统计研究. E-mail: 18993766832@163.com作者简介:邓光耀(1985-),男,教授,硕士生导师,主要从事资源环境统计研究. E-mail: dgy203316@163.com
基金资助:
DENG Guangyao1,2(), SHEN Yingchen1()
Received:2024-06-26
Revised:2024-09-16
Published:2025-04-25
Online:2025-04-18
摘要:
基于熵权-TOPSIS法测算2008—2022年全国生态韧性,采用修正的引力模型、社会网络分析和指数随机图模型探究生态韧性网络关联特征及其影响因子。研究表明:(1) 样本期内全国生态韧性整体表现为上升趋势,展现出不断优化的态势。(2) 2008—2022年全国生态韧性关联强度显著提升,展现出较复杂、多线程的空间网络结构。(3) 网络中的“中心行动者”包括北京、上海、江苏、浙江和广东。西北、东北、黄河中下游以及中部平原是网络中的“边缘行动者”。(4) 净受益板块包括京津和长三角;经纪人板块由浙江和珠三角地区组成;净溢出板块集中在东北、黄河中下游和部分西部地区;双向溢出板块主要包括长江中下游以及西南地区。(5) 指数随机图模型(ERGM)估计结果显示:经济水平、科技创新以及水源条件对网络存在一定程度的影响,并且网络受到地理邻近效应的影响显著。研究成果可为提升生态韧性空间关联网络的联系及稳定性提供科学依据。
邓光耀, 沈迎辰. 中国生态韧性关联网络的特征及影响因素研究[J]. 干旱区地理, 2025, 48(4): 704-716.
DENG Guangyao, SHEN Yingchen. Characterization and influencing factors of ecological resilience linkage networks in China[J]. Arid Land Geography, 2025, 48(4): 704-716.
表1
生态韧性综合评价指标体系"
| 一级指标 | 二级指标 | 单位 | 属性 |
|---|---|---|---|
| 抵抗力 | SO2排放量 | 104 t | - |
| 人口密度 | km2·人-1 | - | |
| 人均GDP | 元·人-1 | + | |
| 生活垃圾清运量 | 104 t | - | |
| 适应力 | 天然气供气量 | 108 m3 | - |
| 生活垃圾无害化处理率 | % | + | |
| 排水管道长度 | 104 km | + | |
| 城市污水日处理能力 | 104 t | + | |
| 恢复力 | 环保占财政支出的比例 | % | + |
| 建成区绿化覆盖率 | % | + | |
| 人均水资源占有量 | m3·人-1 | + | |
| 人均公园绿地面积 | m3·人-1 | + |
表2
块模型板块属性分类标准"
| 位置内部关系比例 | 位置接收到的关系比例 | |
|---|---|---|
| ≈0 | >0 | |
| ≥(gk-1)/(g-1) | 双向溢出板块 | 净受益板块 |
| <(gk-1)/(g-1) | 净溢出板块 | 经纪人板块 |
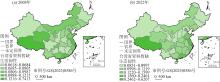
图1
2008年和2022年生态韧性可视化"

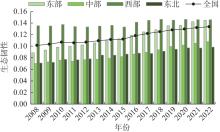
图2
2008—2022中国生态韧性变动趋势"
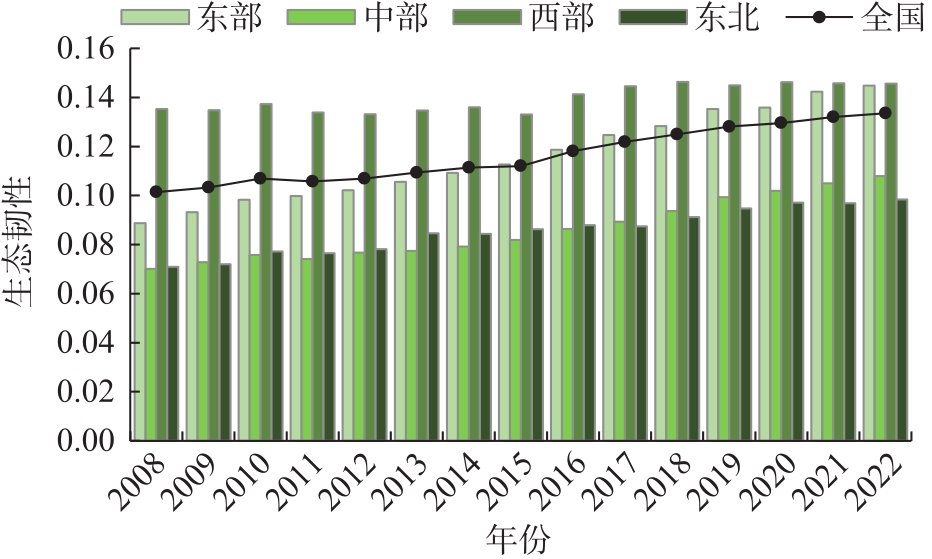
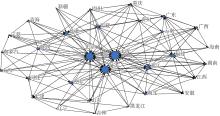
图3
生态韧性空间关联网络"
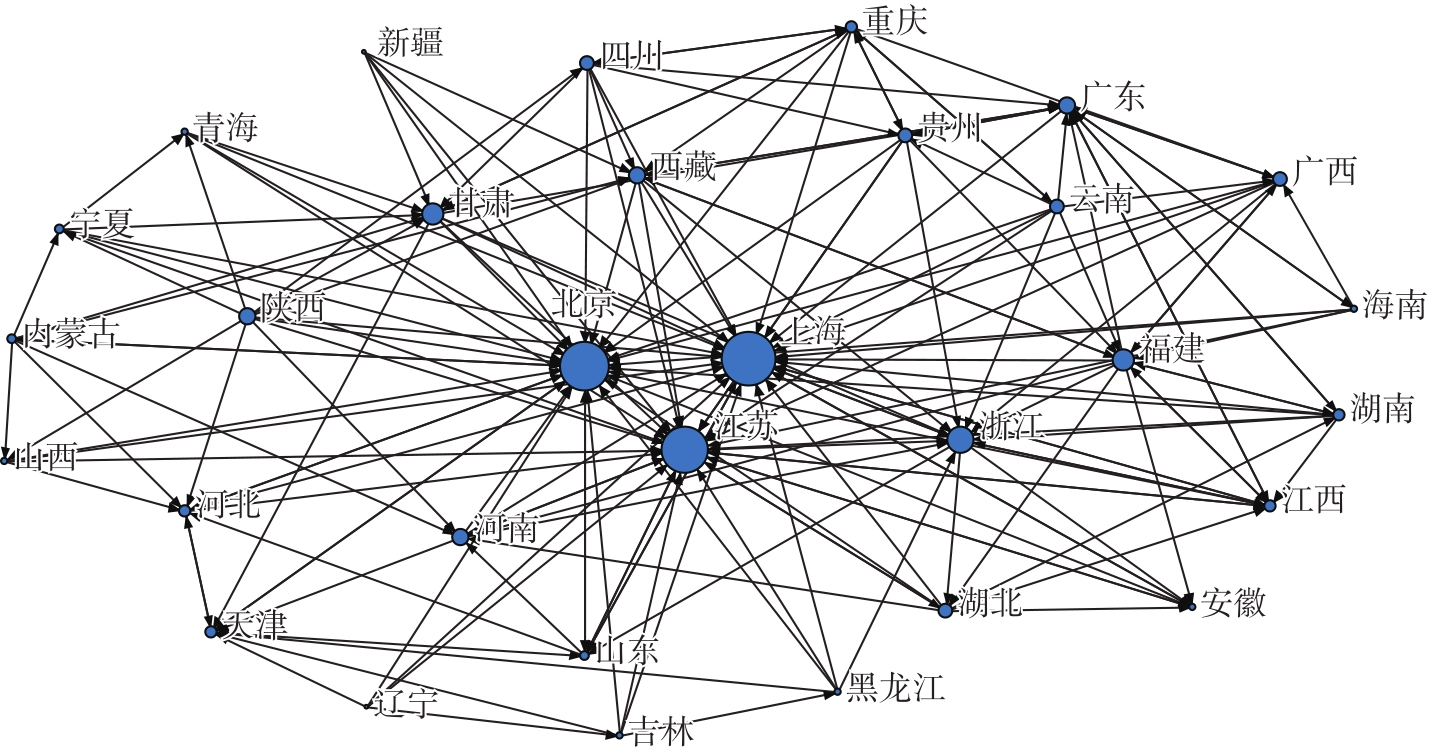
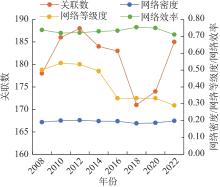
图4
生态韧性关联网络整体特征"
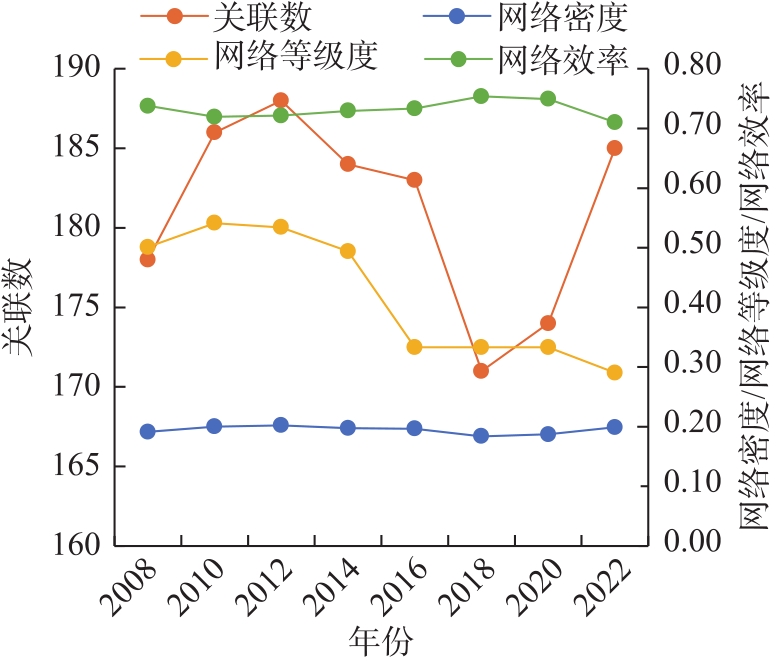
表3
生态韧性网络中心度"
| 省份 | 度数中心度 | 接近中心度 | 中介中心度 | |||||||
|---|---|---|---|---|---|---|---|---|---|---|
| 出度 | 入度 | 中心度 | 排名 | 中心度 | 排名 | 中心度 | 排名 | |||
| 北京 | 4(5) | 25(26) | 83.33*(86.67*) | 2(2) | 85.71*(88.24*) | 2(2) | 19.57*(17.65*) | 1(2) | ||
| 天津 | 3(3) | 7(21) | 26.67(17.65*) | 16(4) | 57.69(76.92*) | 16(4) | 0.85(9.73*) | 11(4) | ||
| 河北 | 4(3) | 6(2) | 26.67(10.00) | 17(31) | 57.69(52.63) | 17(31) | 0.61(0.02) | 12(30) | ||
| 山西 | 4(4) | 2(1) | 20.00(16.67) | 24(23) | 55.56(54.55) | 24(23) | 0.10(0.05) | 26(26) | ||
| 内蒙古 | 7(3) | 1(2) | 23.33(13.33) | 21(30) | 56.60(53.57) | 21(30) | 0.53(0.02) | 13(31) | ||
| 辽宁 | 5(5) | 0(2) | 16.67(20.00) | 30(16) | 54.55(55.56) | 30(16) | 0.07(0.15) | 28(22) | ||
| 吉林 | 5(5) | 1(1) | 20.00(16.67) | 25(24) | 55.56(54.55) | 25(24) | 0.13(0.10) | 25(23) | ||
| 黑龙江 | 5(6) | 1(0) | 20.00(20.00) | 26(17) | 55.56(55.56) | 26(17) | 0.24(0.22) | 21(10) | ||
| 上海 | 5(8) | 26(28) | 90.00*(93.33*) | 1(1) | 90.91*(93.75*) | 1(1) | 18.87*(19.97*) | 2(1) | ||
| 江苏 | 6(4) | 23(23) | 80.00*(76.67*) | 3(3) | 83.33*(81.08*) | 3(3) | 13.12*(11.20*) | 3(3) | ||
| 浙江 | 5(4) | 12(19) | 50.00*(63.33*) | 4(5) | 66.67*(73.17*) | 4(5) | 2.91*(6.56*) | 5(5) | ||
| 安徽 | 3(4) | 5(4) | 20.00(16.67) | 27(25) | 55.56(54.55) | 27(25) | 0.08(0.05) | 29(27) | ||
| 福建 | 10(7) | 7(2) | 43.33*(23.33) | 5(10) | 63.83*(56.60) | 5(10) | 1.93(0.18) | 6(12) | ||
| 江西 | 6(6) | 7(5) | 26.67(20.00) | 18(18) | 57.69(55.56) | 18(18) | 0.21(0.17) | 22(13) | ||
| 山东 | 5(4) | 5(4) | 23.33(16.67) | 22(26) | 56.60(54.55) | 22(26) | 0.27(0.05) | 20(28) | ||
| 河南 | 5(6) | 6(0) | 33.33(20.00) | 10(19) | 60.00(55.56) | 10(19) | 1.51(0.20) | 8(11) | ||
| 湖北 | 7(6) | 3(1) | 30.00(20.00) | 11(20) | 58.82(55.56) | 11(20) | 0.27(0.16) | 19(14) | ||
| 湖南 | 7(6) | 3(1) | 26.67(20.00) | 19(21) | 57.69(55.56) | 19(21) | 0.21(0.16) | 23(15) | ||
| 广东 | 7(8) | 10(14) | 36.67*(50.00*) | 7(6) | 61.22*(66.67*) | 7(6) | 1.33(3.49*) | 9(6) | ||
| 广西 | 6(5) | 5(1) | 30.00(16.67) | 12(27) | 58.82(54.54) | 12(27) | 0.48(0.09) | 14(24) | ||
| 海南 | 6(5) | 1(1) | 20.00(16.67) | 28(28) | 55.56(54.55) | 28(28) | 0.11(0.09) | 27(25) | ||
| 重庆 | 8(9) | 4(3) | 26.67(33.33*) | 20(7) | 57.69(60.00) | 20(7) | 0.35(0.35) | 17(9) | ||
| 四川 | 8(7) | 2(1) | 30.00(23.03) | 13(11) | 58.82(56.60) | 13(11) | 0.38(0.16) | 16(16) | ||
| 贵州 | 7(7) | 4(2) | 30.00(23.03) | 14(12) | 58.82(56.60) | 14(12) | 0.45(0.16) | 15(17) | ||
| 云南 | 9(7) | 1(1) | 30.00(23.03) | 15(13) | 58.82(56.60) | 15(13) | 0.34(0.16) | 18(18) | ||
| 西藏 | 6(6) | 7(9) | 36.67*(33.33*) | 8(8) | 61.22*(60.00) | 8(8) | 1.68(0.91) | 7(8) | ||
| 陕西 | 11(6) | 0(0) | 36.67*(20.00) | 9(22) | 61.24*(55.56) | 9(22) | 1.04(0.16) | 10(19) | ||
| 甘肃 | 7(10) | 7(2) | 43.33*(33.33*) | 6(9) | 63.83*(60.00) | 6(9) | 3.09*(1.27) | 4(7) | ||
| 青海 | 4(7) | 2(1) | 20.00(23.33) | 29(14) | 55.56(56.60) | 29(14) | 0.02(0.16) | 31(20) | ||
| 宁夏 | 5(5) | 2(1) | 23.33(16.67) | 23(29) | 56.60(54.55) | 23(29) | 0.21(0.05) | 24(29) | ||
| 新疆 | 5(7) | 0(0) | 16.67(23.33) | 31(15) | 54.55(56.60) | 31(15) | 0.04(0.16) | 30(21) | ||
| 2008年均值 | 5.74 | 5.74 | 30.97 | - | 60.53 | - | 2.38 | - | ||
| 2022年均值 | 5.98 | 5.97 | 33.55 | - | 61.06 | - | 2.29 | - | ||
表4
各板块包含省份"
| 板块类型 | 板块成员 | |
|---|---|---|
| 2008年 | 2022年 | |
| 净受益板块 | 北京、天津、上海 | 北京、天津、江苏、上海 |
| 经纪人板块 | 广东、浙江、江苏 | 广东、浙江、福建 |
| 双向溢出板块 | 吉林、内蒙古、河北、黑龙江、山西、宁夏、辽宁、山东 | 湖南、湖北、海南、广西、贵州、云南、西藏、安徽、甘肃、江西、黑龙江、河南 |
| 净溢出板块 | 江西、福建、湖北、湖南、安徽、广西、海南、重庆、河南、贵州、云南、西藏、陕西、甘肃、青海、四川、新疆 | 吉林、内蒙古、河北、四川、山西、辽宁、青海、山东、新疆、宁夏、陕西、重庆 |
表5
生态韧性关联网络的结构板块特征分析"
| 接收关系数 | 溢出关系数 | 期望内部关系/% | 实际内部关系/% | 板块类型 | |||
|---|---|---|---|---|---|---|---|
| 板块内 | 板块间 | 板块内 | 板块间 | ||||
| 3(2) | 67(73) | 3(2) | 15(14) | 10.00(6.67) | 16.67(12.50) | 净受益(净受益) | |
| 2(0) | 27(56) | 2(0) | 20(16) | 6.67(6.67) | 13.04(15.79) | 经纪人(经纪人) | |
| 14(3) | 11(10) | 14(3) | 46(32) | 36.67(23.33) | 35.21(42.86) | 净溢出(双向溢出) | |
| 8(13) | 42(21) | 8(13) | 66(98) | 36.67(53.33) | 37.14(31.94) | 双向溢出(净溢出) | |
表6
生态韧性关联网络密度矩阵与像矩阵"
| 板块类型 | 2008年 | 2022年 | |||||||
|---|---|---|---|---|---|---|---|---|---|
| 净受益板块 | 经纪人板块 | 双向溢出 板块 | 净溢出 板块 | 净受益板块 | 经纪人板块 | 双向溢出 板块 | 净溢出 板块 | ||
| 净受益板块 | 0.333* | 0.222* | 0.250* | 0.118 | 0.250* | 0.167 | 0.125 | 0.146 | |
| 经纪人板块 | 0.333* | 0.000 | 0.000 | 0.255* | 0.250* | 0.333* | 0.444* | 0.028 | |
| 双向溢出板块 | 1.000* | 0.250* | 0.054 | 0.015 | 0.750* | 0.028 | 0.061 | 0.021 | |
| 净溢出板块 | 0.902* | 0.941* | 0.029 | 0.048 | 0.813* | 0.667* | 0.139 | 0.106 | |
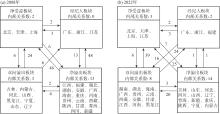
图5
空间关联网络板块传递关系"
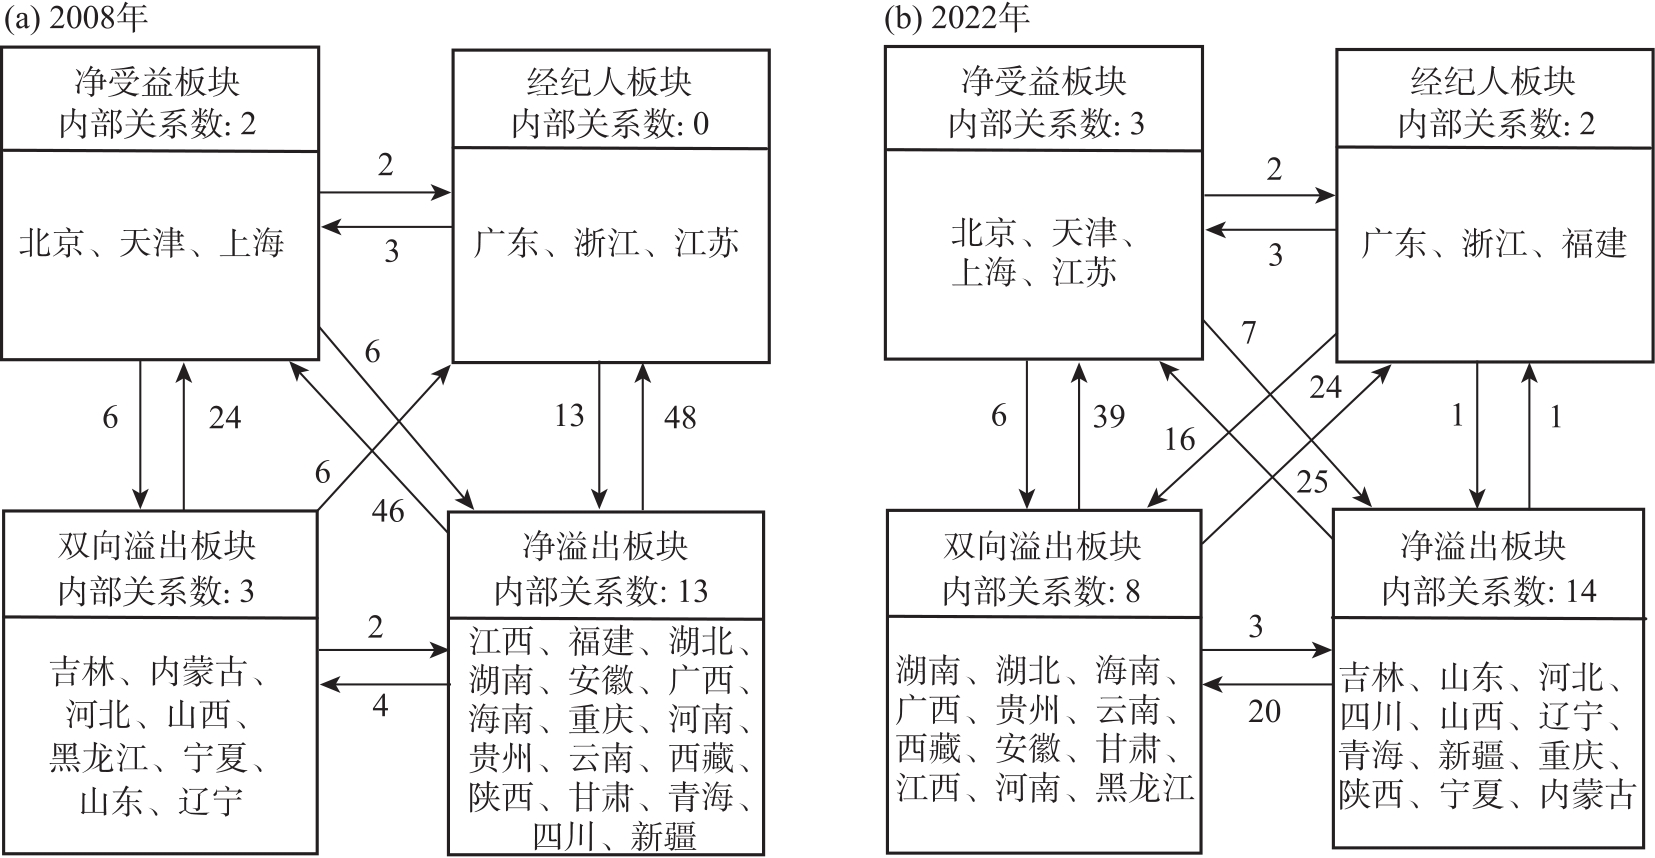
表7
生态韧性空间关联网络形成机制的ERGM变量说明"
| 变量 | Statnet命名 | 示意图 | 假设检验 |
|---|---|---|---|
| 弧 | edgs |  | 作为常数项 |
| 聚集性 | gwesp |  | 省份间是否更倾向于形成聚集性关系? |
| 连通性 | twopath |  | 省份间是否更倾向于同时具有较多的发出关系和接受关系? |
| 互惠性 | mutual |  | 省份间是否更倾向于产生双向连接关系? |
| 循环性 | ctriple |  | 省份间是否更倾向于形成三角传递关系? |
| 发出效应 | nodeocov |  | 某省份的某属性是否有助于省份间形成生态韧性发出关系? |
| 接收效应 | nodeicov |  | 某省份的某属性是否有助于省份间形成生态韧性接收关系? |
| 异配性 | absdiff |  | 属性不同的省份间是否更容易产生生态韧性关联关系? |
| 协变量 | edgecov |  | 易受外部因素影响的省份间是否容易形成生态韧性关联关系? |
表8
生态韧性关联网络ERGM测算结果"
| 变量 | 2008年 | 2018年 | 2022年 | ||
|---|---|---|---|---|---|
| 内生结构变量 | 弧 | -0.03560(1.50821) | -12.96136***(2.55731) | -4.58599***(1.31614) | |
| 互惠性 | -0.64707(0.43934) | 3.41428***(0.82754) | -0.21304(0.36259) | ||
| 循环性 | 0.29589(0.15803) | -0.73799*(0.30617) | 0.09619(0.16100) | ||
| 连通性 | -0.27853***(0.02802) | -0.24761***(0.06760) | -0.18525***(0.03662) | ||
| 聚集性 | 0.60557**(0.20100) | 0.35872*(0.16391) | 0.59681**(0.21516) | ||
| 节点属性变量 | 经济水平 | 发出 | -0.00010***(0.00002) | -0.00002(0.00002) | 0.00001(0.00000) |
| 接收 | -0.00008***(0.00002) | 0.00005***(0.00001) | 0.00001*(0.00000) | ||
| 异配性 | -0.00003(0.00002) | 0.00013***(0.00002) | 0.00002***(0.00000) | ||
| 产业结构 | 发出 | -1.93089(1.51183) | 8.93571**(3.24577) | 1.67448(1.44393) | |
| 接收 | -1.13910(1.39266) | -2.03466(3.21436) | 2.63409(1.34963) | ||
| 异配性 | -0.23310(1.70209) | 3.42066(3.79303) | -2.39421(1.74771) | ||
| 人口聚集 | 发出 | -0.00000(0.00009) | -0.00010(0.00015) | -0.00019(0.00010) | |
| 接收 | -0.00010(0.00009) | -0.00012(0.00016) | -0.00029**(0.00010) | ||
| 异配性 | 0.00008(0.00011) | -0.00018(0.00019) | 0.00042**(0.00013) | ||
| 科技创新 | 发出 | 172.03707***(31.21705) | -0.46555(19.29724) | 10.24441(9.33152) | |
| 接收 | 135.90264***(28.24969) | 35.94049*(16.29313) | 32.01858***(7.48612) | ||
| 异配性 | 72.22745**(26.72037) | 15.86065(15.82177) | -1.85766(8.38751) | ||
| 水源条件 | 发出 | -0.00023**(0.00008) | 0.00022**(0.00007) | 0.00008(0.00005) | |
| 接收 | -0.00024**(0.00008) | 0.00023**(0.00007) | 0.00008(0.00005) | ||
| 异配性 | 0.00024**(0.00008) | -0.00020**(0.00007) | -0.00008(0.00005) | ||
| 网络协变量 | D[0, 500] | 2.37400***(0.47656) | 5.84127***(0.93572) | 1.38020**(0.43050) | |
| D(500, 1000] | 1.66963***(0.40035) | 3.2055***(0.82822) | 1.39678**(0.38373) | ||
| D(1000, 1500] | 0.95255*(0.38667) | 0.59663(0.70357) | 0.38667(0.36235) | ||
| D(1500, 2000] | 0.30065(0.39134) | -0.42366(0.76625) | -0.19214(0.39528) | ||
| AIC | -568.24507 | -982.78652 | -541.78844 | ||
| BIC | -452.20064 | -866.74209 | -425.74401 | ||
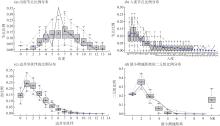
图6
GOF检验结果 注:NR为数据中没有在横坐标尾端范围内的值。原有观测网络特征统计量由黑实线表示,仿真网络在95%置信区间下的测度结果表示为虚线及箱线图。"

| [1] |
赵领娣, 孙兆旭. 海岸带城市经济发展质量与生态韧性协同发展演化及空间收敛特征[J]. 经济地理, 2023, 43(7): 119-129, 240.
doi: 10.15957/j.cnki.jjdl.2023.07.012 |
|
[Zhao Lingdi, Sun Zhaoxu. Evolution of coordinated development between economic development quality and ecological resilience in coastal cities and its spatial convergence features[J]. Economic Geography, 2023, 43(7): 119-129, 240.]
doi: 10.15957/j.cnki.jjdl.2023.07.012 |
|
| [2] |
肖沁霖, 邓宗兵, 王炬, 等. 中国生态文明发展的空间关联网络及其空间收敛特征[J]. 资源科学, 2023, 45(6): 1123-1138.
doi: 10.18402/resci.2023.06.03 |
|
[Xiao Qinlin, Deng Zongbing, Wang Ju, et al. Spatial correlation network and spatial convergence of eco-civilization development in China[J]. Resources Science, 2023, 45(6): 1123-1138.]
doi: 10.18402/resci.2023.06.03 |
|
| [3] | Holling C S. Resilience and stability of ecological systems[J]. Annual Review of Ecology and Systematics, 1973, 4(1): 1-23. |
| [4] | Li D, Yang W P, Huang R Y. The multidimensional differences and driving forces of ecological environment resilience in China[J]. Environmental Impact Assessment Review, 2023, 98: 106954, doi: 10.1016/j.eiar.2022.106954. |
| [5] |
刘海龙, 王改艳, 张鹏航, 等. 汾河流域新型城镇化与生态韧性耦合协调时空演变及协调影响力研究[J]. 自然资源学报, 2024, 39(3): 640-667.
doi: 10.31497/zrzyxb.20240309 |
|
[Liu Hailong, Wang Gaiyan, Zhang Penghang, et al. Spatio-temporal evolution and coordination influence of coupling coordination between new urbanization and ecological resilience in Fenhe River Basin[J]. Journal of Natural Resources, 2024, 39(3): 640-667.]
doi: 10.31497/zrzyxb.20240309 |
|
| [6] | 贺小荣, 石彩霞, 彭坤杰. 长江中游城市群新型城镇化与生态韧性的时空适配及互动响应[J]. 长江流域资源与环境, 2024, 33(4): 699-714. |
| [He Xiaorong, Shi Caixia, Peng Kunjie. Spatial-temporal adaptation and interactive response of new-type urbanization and ecological resilience in the middle reaches of the Yangtze River[J]. Resources and Environment in the Yangtze Basin, 2024, 33(4): 699-714.] | |
| [7] | 吕添贵, 胡晗, 付舒斐, 等. 长三角地区城市生态韧性时空分异特征及影响因素[J]. 地域研究与开发, 2023, 42(1): 54-60. |
| [Lü Tiangui, Hu Han, Fu Shufei, et al. Spatio-temporal differentiation and influencing factors of urban ecological resilience in the Yangtze River Delta[J]. Areal Research and Development, 2023, 42(1): 54-60.] | |
| [8] |
李志远, 冯学钢, 何静, 等. 中国旅游生态韧性空间关联网络结构及其驱动因素[J]. 地理研究, 2024, 43(5): 1146-1165.
doi: 10.11821/dlyj020230737 |
| [Li Zhiyuan, Feng Xuegang, He Jing, et al. Spatial correlation network structure and driving factors of tourism ecological resilience in China[J]. Geographical Research, 2024, 43(5): 1146-1165.] | |
| [9] | 姚鸣奇, 张卓群, 郑艳, 等. 海绵城市试点建设提高了生态韧性吗?——一项准自然实验[J]. 城市发展研究, 2023, 30(4): 25-33. |
| [Yao Mingqi, Zhang Zhuoqun, Zheng Yan, et al. Does sponge city construction improve ecological resilience?: A quasi-natural experiment[J]. Urban Development Studies, 2023, 30(4): 25-33.] | |
| [10] | 蒋文鑫, 吴军, 徐建刚. 城市生态韧性与经济发展水平耦合协调关系研究——以江苏省为例[J]. 资源开发与市场, 2023, 39(3): 299-308, 318. |
| [Jiang Wenxin, Wu Jun, Xu Jiangang. Study on the coupling coordination between urban ecological resilience and economic development level: Taking Jiangsu Province as an example[J]. Research Development & Market, 2023, 39(3): 299-308, 318.] | |
| [11] | 陶洁怡, 董平, 陆玉麒. 长三角地区生态韧性时空变化及影响因素分析[J]. 长江流域资源与环境, 2022, 31(9): 1975-1987. |
| [Tao Jieyi, Dong Ping, Lu Yuqi. Spatial-temporal analysis and influencing factors of ecological resilience in the Yangtze River Delta[J]. Resources and Environment in the Yangtze Basin, 2022, 31(9): 1975-1987.] | |
| [12] |
任洪杰, 李辉尚. 中国乡村生态韧性的时空演变特征及影响因素探究[J]. 干旱区地理, 2024, 47(11): 1915-1923.
doi: 10.12118/j.issn.1000-6060.2023.707 |
|
[Ren Hongjie, Li Huishang. Spatial and temporal evolution characteristics and influencing factors of rural ecological resilience in China[J]. Arid Land Geography, 2024, 47(11): 1915-1923.]
doi: 10.12118/j.issn.1000-6060.2023.707 |
|
| [13] | 孟海星, 沈清基. 城市生态空间防灾韧性: 概念辨析、影响因素与提升策略[J]. 城乡规划, 2021(3): 28-34. |
| [Meng Haixing, Shen Qingji. Disaster resilience of urban ecological space: Concepts, influencing factors, and strategies[J]. Urban and Rural Planning, 2021(3): 28-34.] | |
| [14] |
邵帅, 徐俐俐, 杨莉莉. 千里“碳缘”一线牵: 中国区域碳排放空间关联网络的结构特征与形成机制[J]. 系统工程理论与实践, 2023, 43(4): 958-983.
doi: 10.12011/SETP2022-1418 |
| [Shao Shuai, Xu Lili, Yang Lili. Structural characteristics and formation mechanism of carbon emission spatial association networks within China[J]. Systems Engineering-Theory & Practice, 2023, 43(4): 958-983.] | |
| [15] |
刘玒玒, 刘书芳. 祁连山地区复合生态系统韧性时空演化及障碍因子识别[J]. 干旱区地理, 2024, 47(2): 237-247.
doi: 10.12118/j.issn.1000-6060.2023.214 |
|
[Liu Honghong, Liu Shufang. Spatiotemporal evolution and obstacle identification of complex ecosystem resilience in the Qilian Mountain area[J]. Arid Land Geography, 2024, 47(2): 237-247.]
doi: 10.12118/j.issn.1000-6060.2023.214 |
|
| [16] |
王松茂, 宁文萍, 牛金兰, 等. 黄河流域城市生态韧性时空分异及收敛研究——基于七大城市群61个城市的实证分析[J]. 干旱区地理, 2024, 47(1): 93-103.
doi: 10.12118/j.issn.1000-6060.2023.323 |
|
[Wang Songmao, Ning Wenping, Niu Jinlan, et al. Spatiotemporal differentiation and convergence of urban ecological resilience in the Yellow River Basin: An empirical analysis based on 61 cities in seven major urban agglomerations[J]. Arid Land Geography, 2024, 47(1): 93-103.]
doi: 10.12118/j.issn.1000-6060.2023.323 |
|
| [17] |
周成, 赵亚玲, 张旭红, 等. 黄河流域城市生态韧性与效率时空演化特征及协调发展分析[J]. 干旱区地理, 2023, 46(9): 1514-1523.
doi: 10.12118/j.issn.1000-6060.2022.633 |
|
[Zhou Cheng, Zhao Yaling, Zhang Xuhong, et al. Spatiotemporal evolutionary characteristics and coordinated development of urban ecological resilience and efficiency in the Yellow River Basin[J]. Arid Land Geography, 2023, 46(9): 1514-1523.]
doi: 10.12118/j.issn.1000-6060.2022.633 |
|
| [18] | Song Q, Zhong S Y, Chen J Y, et al. Spatio-temporal evolution of city resilience in the Yangtze River Delta, China, from the perspective of statistics[J]. Sustainability, 2023, 15(2): 1538, doi: 10.3390/SU/50521538. |
| [19] | Rezvani S M H S, de Almeida N M, Falcao M F, et al. Enhancing urban resilience evaluation systems through automated rational and consistent decision-making simulations[J]. Sustainable Cities and Society, 2022, 78: 103612, doi: 10.1016/j.scs.2021.103612. |
| [20] | 芦风英, 庞智强, 邓光耀. 乡村振兴水平测度及空间关联效应研究——以甘肃省为例[J]. 统计与决策, 2022, 38(23): 63-68. |
| [Lu Fengying, Pang Zhiqiang, Deng Guangyao. Measurement on rural revitalization level and spatial correlation effect: A case study of Gansu Province[J]. Statistics and Decision, 2022, 38(23): 63-68.] | |
| [21] | 郭成玉, 滕玉成, 臧文杰. 政府数字化转型对经济高质量发展的影响——基于中国城市的实证检验[J]. 经济问题探索, 2024(4): 71-86. |
| [Guo Chengyu, Teng Yucheng, Zang Wenjie. The impact of government digital transformation on high-quality economic development: An empirical testing on Chinese cities[J]. Inquiry into Economic Issues, 2024(4): 71-86.] | |
| [22] |
赵林, 曹乃刚, 韩增林, 等. 中国生态福利绩效空间关联网络演变特征与形成机制[J]. 自然资源学报, 2022, 37(12): 3183-3200.
doi: 10.31497/zrzyxb.20221211 |
|
[Zhao Lin, Cao Naigang, Han Zenglin, et al. Evolution characteristics and formation mechanism of spatial correlation network of ecological well-being performance in China[J]. Journal of Natural Resources, 2022, 37(12): 3183-3200.]
doi: 10.31497/zrzyxb.20221211 |
|
| [23] |
赵林, 高晓彤, 刘焱序, 等. 中国包容性绿色效率空间关联网络结构演变特征分析[J]. 经济地理, 2021, 41(9): 69-78, 90.
doi: 10.15957/j.cnki.jjdl.2021.09.008 |
|
[Zhao Lin, Gao Xiaotong, Liu Yanxu, et al. Evolution characteristics of spatial correlation network of inclusive green efficiency in China[J]. Economic Geography, 2021, 41(9): 69-78, 90.]
doi: 10.15957/j.cnki.jjdl.2021.09.008 |
|
| [24] | 刘军. 整体网分析讲义: UCINET软件实用指南[M]. 北京: 格致出版社, 2009. |
| [Liu Jun. Lectures on whole network approach: A practical guide to UCINET[M]. Beijing: Truth & Wisdom Press, 2009.] | |
| [25] | 杨青, 郭露, 刘星星, 等. 基于模体结构与指数随机图的中国省域交通碳排放空间关联格局的驱动要素研究[J]. 中国环境科学, 2024, 44(2): 1171-1184. |
| [Yang Qing, Guo Lu, Liu Xingxing, et al. Driving characteristics of the spatial correlation pattern of carbon emissions from provincial transportation in China[J]. China Environmental Science, 2024, 44(2): 1171-1184.] | |
| [26] | 王松茂, 牛金兰. 黄河流域城市生态韧性时空演变及其影响因素[J]. 生态学报, 2023, 43(20): 8309-8320. |
| [Wang Songmao, Niu Jinlan. Spatio-temporal evolution and influencing factors of urban ecological resilience in the Yellow River Basin[J]. Acta Ecologica Sinica, 2023, 43(20): 8309-8320.] | |
| [27] |
张明斗, 任衍婷, 周亮. 黄河流域城市生态韧性时空演变特征及影响因素分析[J]. 干旱区地理, 2024, 47(3): 445-454.
doi: 10.12118/j.issn.1000-6060.2023.381 |
|
[Zhang Mingdou, Ren Yanting, Zhou Liang. Spatiotemporal evolution characteristics and influencing factors of urban ecological resilience in the Yellow River Basin[J]. Arid Land Geography, 2024, 47(3): 445-454.]
doi: 10.12118/j.issn.1000-6060.2023.381 |
|
| [28] | 刘华军, 刘传明, 杨骞. 环境污染的空间溢出及其来源——基于网络分析视角的实证研究[J]. 经济学家, 2015(10): 28-35. |
| [Liu Huajun, Liu Chuanming, Yang Qian. Spatial spillover and source of environment pollution: Empirical study on the perspective of network analysis[J]. Economist, 2015(10): 28-35.] | |
| [29] | 贾建琦, 赵林, 高晓彤, 等. 环渤海地区包容性绿色增长效率的空间关联网络结构及其影响因素[J]. 地理与地理信息科学, 2021, 37(5): 46-54. |
| [Jia Jianqi, Zhao Lin, Gao Xiaotong, et al. Spatial correlation network structure of inclusive green growth efficiency and its influencing factors in Bohai Rim region[J]. Geography and Geo-information Science, 2021, 37(5): 46-54.] |
| [1] | 李维露, 张明斗. 黄河流域城市人口集聚与土地生态韧性的协同性研究[J]. 干旱区地理, 2025, 48(4): 728-738. |
| [2] | 郑孟林, 赵勇, 杨霞. 1961—2022年中国西北干旱区夏季降水变化特征[J]. 干旱区地理, 2025, 48(3): 367-379. |
| [3] | 付晓, 黄颖敏. 主体功能视角下中国革命老区高质量发展空间格局及影响因素[J]. 干旱区地理, 2025, 48(3): 517-527. |
| [4] | 王宁宁, 王勤升, 肖可. 中国式现代化与新基建共生关系演化研究[J]. 干旱区地理, 2025, 48(1): 105-118. |
| [5] | 付伟, 巩海秀, 陈建成. 中国家庭消费间接碳排放空间关联结构演变——基于社会网络分析法[J]. 干旱区地理, 2025, 48(1): 119-129. |
| [6] | 张傲翔, 苗成林, 陈峥妍. 黄河流域城市生态韧性、社会网络及其影响因素分析[J]. 干旱区地理, 2025, 48(1): 130-142. |
| [7] | 朱磊, 李燕楠, 徐佳慧, 胡静, 朱芳, 梁茫茫. 中国冰雪旅游地空间分布格局及成因[J]. 干旱区地理, 2024, 47(8): 1399-1410. |
| [8] | 朱瑷嫒, 殷颂葵, 刘琼慧. 中国西北地区农业生态效率时空分异及影响因素研究[J]. 干旱区地理, 2024, 47(7): 1210-1219. |
| [9] | 张明斗, 任衍婷, 周亮. 黄河流域城市生态韧性时空演变特征及影响因素分析[J]. 干旱区地理, 2024, 47(3): 445-454. |
| [10] | 唐宇, 薛东前, 宋永永, 叶昊, 王莎. 中国夜间文旅消费集聚区空间格局及影响机理[J]. 干旱区地理, 2024, 47(3): 485-495. |
| [11] | 史玉芳, 牛玉. 关中平原城市群韧性空间关联网络及其影响因素研究[J]. 干旱区地理, 2024, 47(2): 270-280. |
| [12] | 周霞, 王佳. 中国省域经济韧性与生态效率测度及其协同演化分析[J]. 干旱区地理, 2024, 47(2): 319-331. |
| [13] | 李春华, 朱飙, 杨金虎, 刘晨汐, 段欣妤, 黄鹏程. 中国区域气候干湿与土壤湿度变化特征及其差异性分析[J]. 干旱区地理, 2024, 47(10): 1674-1687. |
| [14] | 史维良, 李博雅. 黄河流域三大城市群城市韧性空间网络结构研究[J]. 干旱区地理, 2024, 47(10): 1767-1780. |
| [15] | 王松茂, 宁文萍, 牛金兰, 安康. 黄河流域城市生态韧性时空分异及收敛研究——基于七大城市群61个城市的实证分析[J]. 干旱区地理, 2024, 47(1): 93-103. |
|
||