干旱区地理 ›› 2026, Vol. 49 ›› Issue (4): 713-726.doi: 10.12118/j.issn.1000-6060.2025.240 cstr: 32274.14.ALG2025240
陈文宣1( ), 陈钰1(), 王生隆2
收稿日期:2025-05-06
修回日期:2025-06-16
出版日期:2026-04-25
发布日期:2026-04-28
通讯作者:
陈钰(1975-),女,副教授,硕士研究生导师,主要从事经济学方面的研究. E-mail: cy@gsau.edu.cn作者简介:陈文宣(2002-),女,硕士研究生,主要从事农业碳排放测算方面的研究. E-mail: 1073325120056@st.gsau.edu.cn
基金资助:
CHEN Wenxuan1(), CHEN Yu1(), WANG Shenglong2
Received:2025-05-06
Revised:2025-06-16
Published:2026-04-25
Online:2026-04-28
摘要:
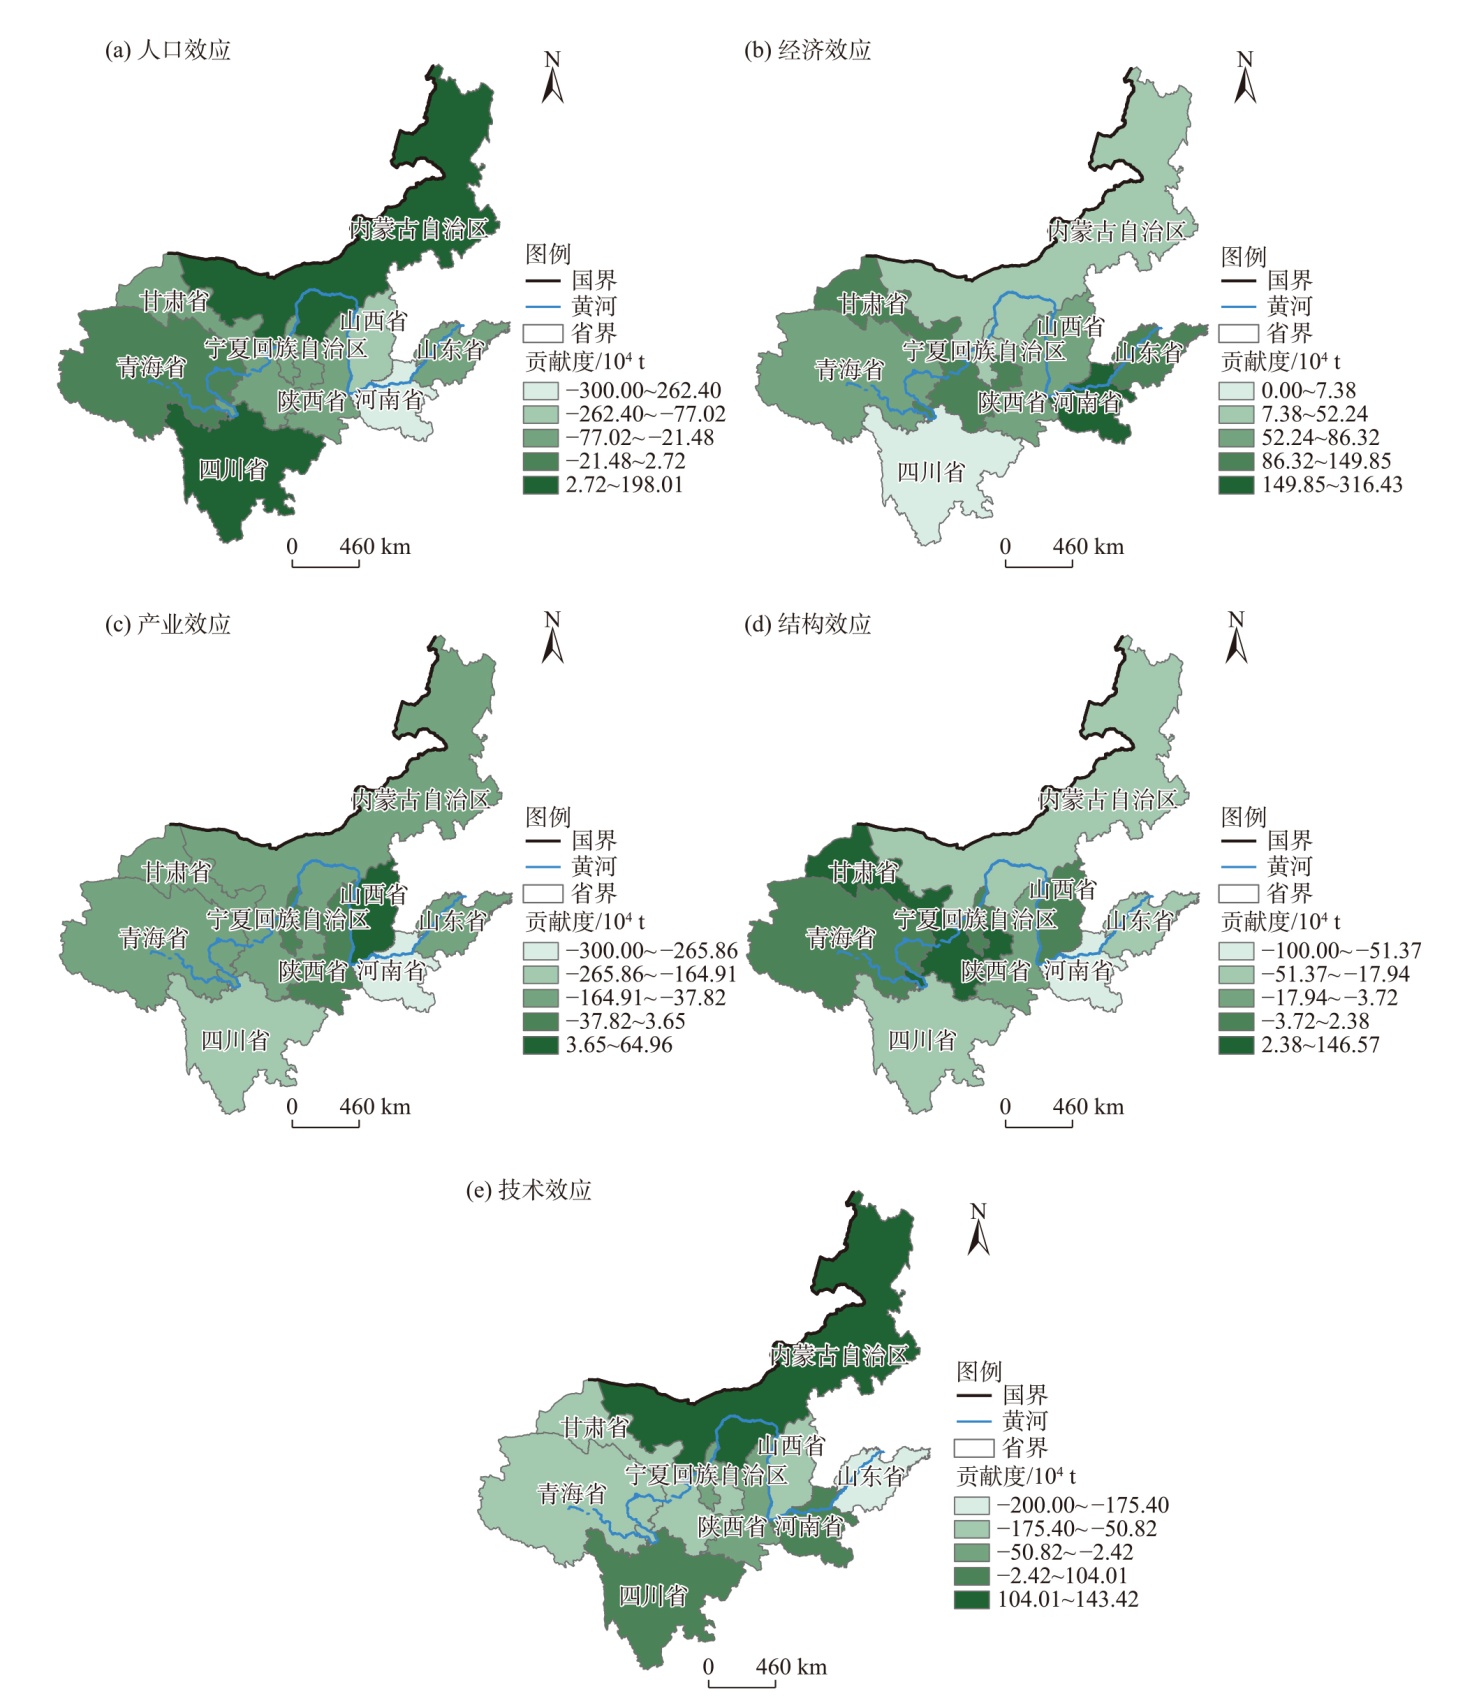
为深入探讨黄河流域农业碳排放的时空分布特征,采用联合国政府间气候变化专门委员会提供的碳排放因子,计算2013—2023年黄河流域各省(区)农业碳排放总量。运用莫兰自相关指数(Moran’s I)分析其空间自相关性,借助对数平均迪氏指数(Logarithmic mean divisia index,LMDI)对农业碳排放的影响因素进行定量分解,深入探讨了各因素对碳排放的驱动与抑制作用。结果表明:(1) 2013—2023年黄河流域农业碳排放总量呈现“缓慢上升-逐年下降-略有回升”趋势。空间上呈现出“南北高、中部低”的分布格局。(2) 各省(区)农业碳排放强度总体呈下降趋势。(3) 全局Moran’s I除2016年和2017年外,整体呈现出显著的正空间相关性,且这一空间集聚效应逐年增强。局部Moran’s I散点图进一步证实农业碳排放强度在该地区的显著空间自相关性。(4) 经济效应和结构效应对农业碳排放具有正向驱动作用,而人口效应、产业效应和技术效应则对碳排放具有负向抑制作用。识别农业碳排放的主导因素,从农业生产的各个环节有效抑制碳排放,从而进行精准碳减排。
陈文宣, 陈钰, 王生隆. 黄河流域农业碳排放时空演化特征及其影响因素分析[J]. 干旱区地理, 2026, 49(4): 713-726.
CHEN Wenxuan, CHEN Yu, WANG Shenglong. Characteristics of spatial and temporal evolution of agricultural carbon emissions in the Yellow River Basin and analysis of its influencing factors[J]. Arid Land Geography, 2026, 49(4): 713-726.
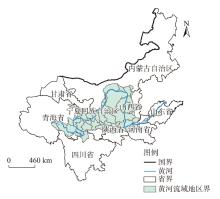
图1
研究区域示意图 注:基于自然资源部标准地图服务网站审图号为GS(2019)1837号的标准地图制作,底图边界无修改。下同。"
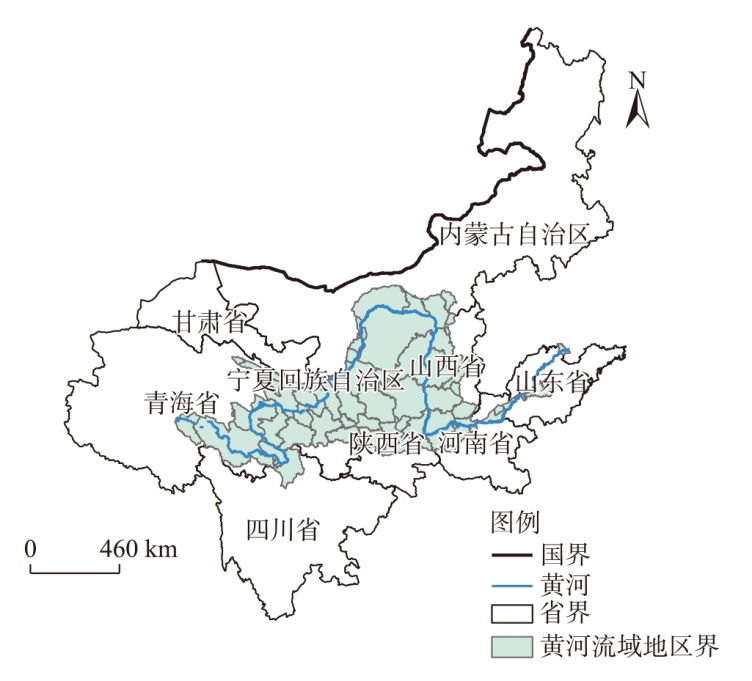
表1
种植业碳排放系数及参考来源"
| 碳源指标 | 碳排放系数 | 参考来源 |
|---|---|---|
| 化肥/kg·kg-1 | 0.8956 | 美国橡树岭国家实验室[ |
| 农药/kg·kg-1 | 4.9341 | 美国橡树岭国家实验室[ |
| 农用薄膜/kg·kg-1 | 5.1800 | 南京农业大学农业资源 与环境研究所[ |
| 农用柴油/kg·kg-1 | 0.5927 | 政府间气候变化专门委员会[ |
| 农业播种面积/kg·hm-2 | 3.1260 | 中国农业大学生物与技术学院[ |
| 农业灌溉面积/kg·hm-2 | 25.0000 | 政府间气候变化专门委员会[ |
表2
畜牧业碳排放系数及参考来源"
| 碳源指标/kg·头·a-1 | CH4排放系数 | N2O排放系数 | 参考来源 | |
|---|---|---|---|---|
| 肠胃发酵 | 粪便发酵 | |||
| 猪 | 1 | 3.50 | 0.53 | [ |
| 牛 | 51.4 | 1.50 | 1.39 | [ |
| 马 | 18 | 1.64 | 1.39 | [ |
| 驴 | 10 | 0.90 | 1.39 | [ |
| 骡 | 10 | 0.90 | 0.33 | [ |
| 山羊 | 5 | 0.17 | 0.33 | [ |
| 绵羊 | 5 | 0.15 | 0.33 | [ |
| 骆驼 | 46 | 1.92 | 1.39 | [ |
表3
2013—2023年黄河流域9省(区)畜牧业和种植业碳排放总量"
| 年份 | 碳源类型 | 青海 | 甘肃 | 四川 | 宁夏 | 内蒙古 | 山西 | 陕西 | 河南 | 山东 |
|---|---|---|---|---|---|---|---|---|---|---|
| 2013 | 种植业 | 17.62 | 233.84 | 357.66 | 60.88 | 288.02 | 170.34 | 302.33 | 858.98 | 782.27 |
| 畜牧业 | 1175.06 | 1434.61 | 3471.31 | 322.09 | 2602.20 | 1171.44 | 647.53 | 3208.48 | 2162.11 | |
| 2014 | 种植业 | 17.83 | 244.33 | 358.09 | 59.47 | 315.08 | 170.28 | 292.35 | 866.93 | 769.98 |
| 畜牧业 | 1175.21 | 1507.10 | 3272.89 | 343.33 | 2708.24 | 1290.98 | 669.73 | 3237.93 | 2152.94 | |
| 2015 | 种植业 | 18.42 | 251.19 | 358.85 | 60.06 | 327.34 | 168.73 | 295.58 | 874.41 | 760.09 |
| 畜牧业 | 1173.02 | 1489.88 | 3338.68 | 342.35 | 2825.23 | 1259.46 | 654.13 | 3259.38 | 2164.02 | |
| 2016 | 种植业 | 17.37 | 240.62 | 357.96 | 60.55 | 334.26 | 167.45 | 297.29 | 872.01 | 749.22 |
| 畜牧业 | 1212.94 | 1462.58 | 3429.76 | 350.57 | 2724.78 | 1184.21 | 637.88 | 3133.79 | 2118.10 | |
| 2017 | 种植业 | 17.55 | 221.40 | 349.94 | 60.27 | 331.29 | 162.21 | 297.05 | 856.25 | 722.12 |
| 畜牧业 | 1298.66 | 1350.08 | 3107.37 | 345.72 | 2806.74 | 1344.22 | 693.48 | 2219.99 | 1926.75 | |
| 2018 | 种植业 | 16.78 | 207.57 | 336.36 | 57.78 | 320.40 | 157.93 | 294.09 | 835.12 | 687.97 |
| 畜牧业 | 1230.54 | 1385.44 | 2992.52 | 360.69 | 2707.25 | 1340.85 | 686.54 | 2219.01 | 1884.53 | |
| 2019 | 种植业 | 14.88 | 199.67 | 324.47 | 58.04 | 314.55 | 155.27 | 270.69 | 805.35 | 649.94 |
| 畜牧业 | 1183.50 | 1419.56 | 2675.19 | 396.05 | 2700.21 | 1171.44 | 663.67 | 1960.92 | 1644.22 | |
| 2020 | 种植业 | 14.03 | 197.85 | 309.60 | 58.04 | 302.50 | 153.49 | 270.88 | 784.76 | 627.47 |
| 畜牧业 | 1471.29 | 1543.07 | 2998.60 | 470.77 | 2825.57 | 1421.10 | 693.17 | 2622.94 | 1622.45 | |
| 2021 | 种植业 | 13.46 | 197.00 | 304.40 | 58.23 | 339.18 | 150.15 | 269.75 | 753.40 | 606.15 |
| 畜牧业 | 1464.99 | 1670.05 | 3009.79 | 538.74 | 2947.54 | 1421.10 | 701.57 | 2798.56 | 1674.73 | |
| 2022 | 种植业 | 13.24 | 199.41 | 301.01 | 58.41 | 329.29 | 146.51 | 264.12 | 714.97 | 586.54 |
| 畜牧业 | 1458.73 | 1742.42 | 3043.93 | 585.43 | 3107.02 | 1927.73 | 708.46 | 2840.39 | 1639.12 | |
| 2023 | 种植业 | 13.02 | 198.13 | 297.64 | 58.94 | 327.63 | 144.55 | 264.04 | 696.10 | 568.13 |
| 畜牧业 | 1431.97 | 1833.69 | 3162.77 | 614.18 | 3339.66 | 1955.51 | 716.16 | 2700.07 | 1534.57 |
图2
2013—2023年黄河流域种植业各碳源碳排放量时序特征"
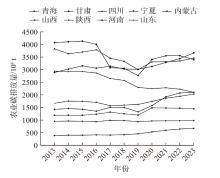
图3
2013—2023年黄河流域9省(区)农业碳排放总量折线图"
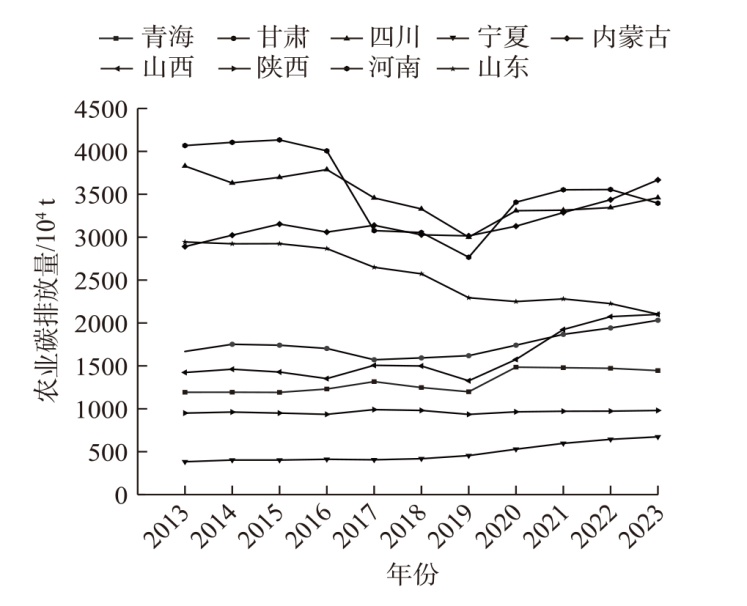
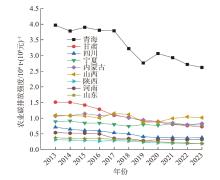
图4
2013—2023年黄河流域9省(区)农业碳排放强度"
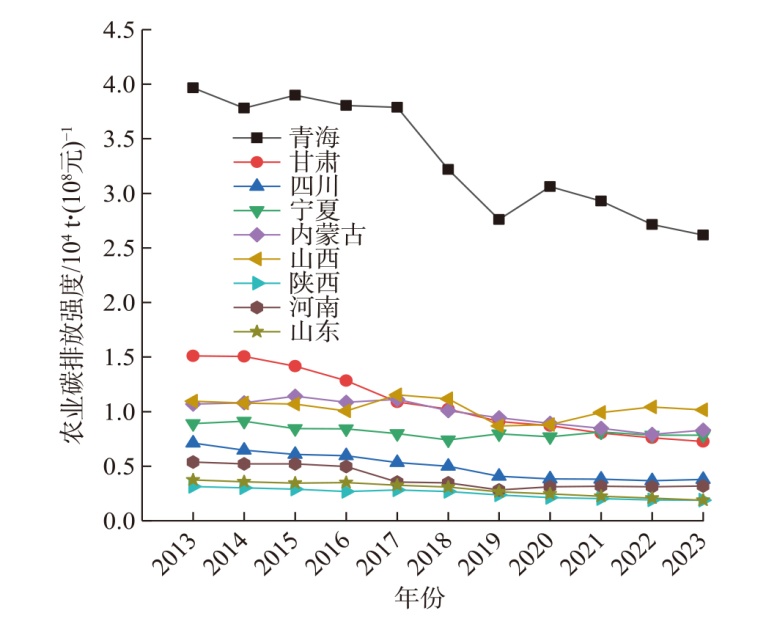
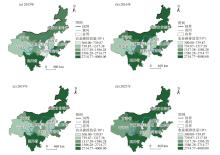
图5
2013—2023年黄河流域9省(区)农业碳排放量空间分异特征"
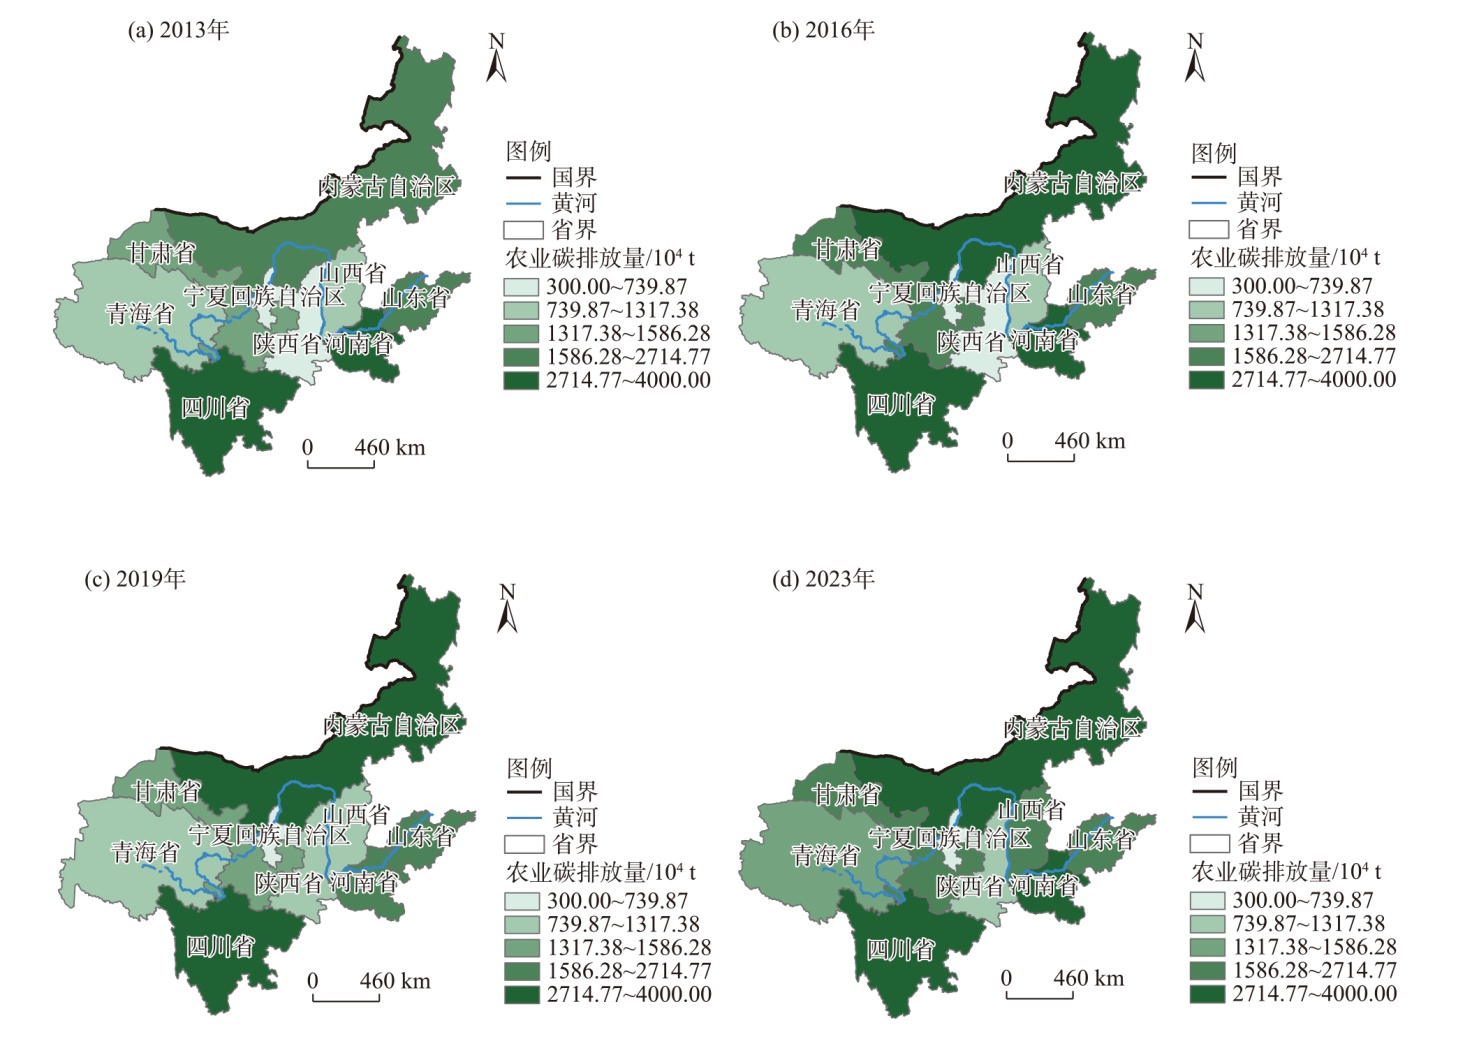
表4
2013—2023年黄河流域农业碳排放强度全局Moran’s I结果"
| 年份 | 全局Moran’s I | Z值 |
|---|---|---|
| 2013 | 0.011*** | 2.814 |
| 2014 | 0.019*** | 2.838 |
| 2015 | 0.000*** | 2.580 |
| 2016 | -0.011*** | 2.466 |
| 2017 | -0.042** | 1.477 |
| 2018 | 0.004** | 1.754 |
| 2019 | 0.091* | 1.466 |
| 2020 | 0.047* | 1.316 |
| 2021 | 0.083* | 1.483 |
| 2022 | 0.094* | 1.460 |
| 2023 | 0.103* | 1.484 |
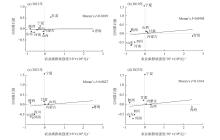
图6
黄河流域9省(区)农业碳排放强度莫兰散点图"
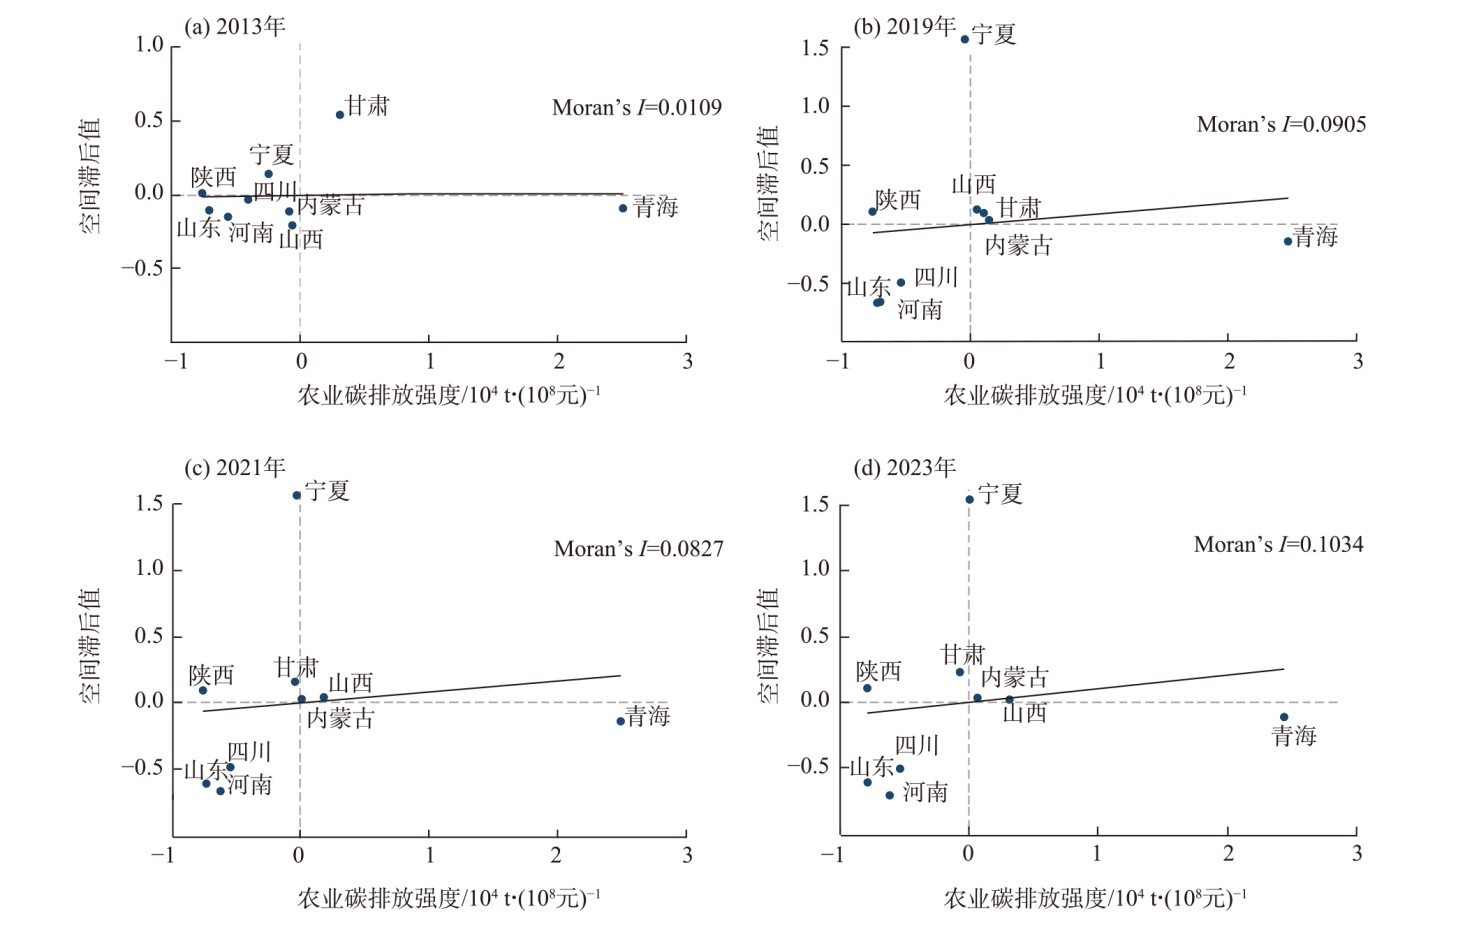

图7
2013—2023年黄河流域9省(区)农业碳排放强度空间分异特征"
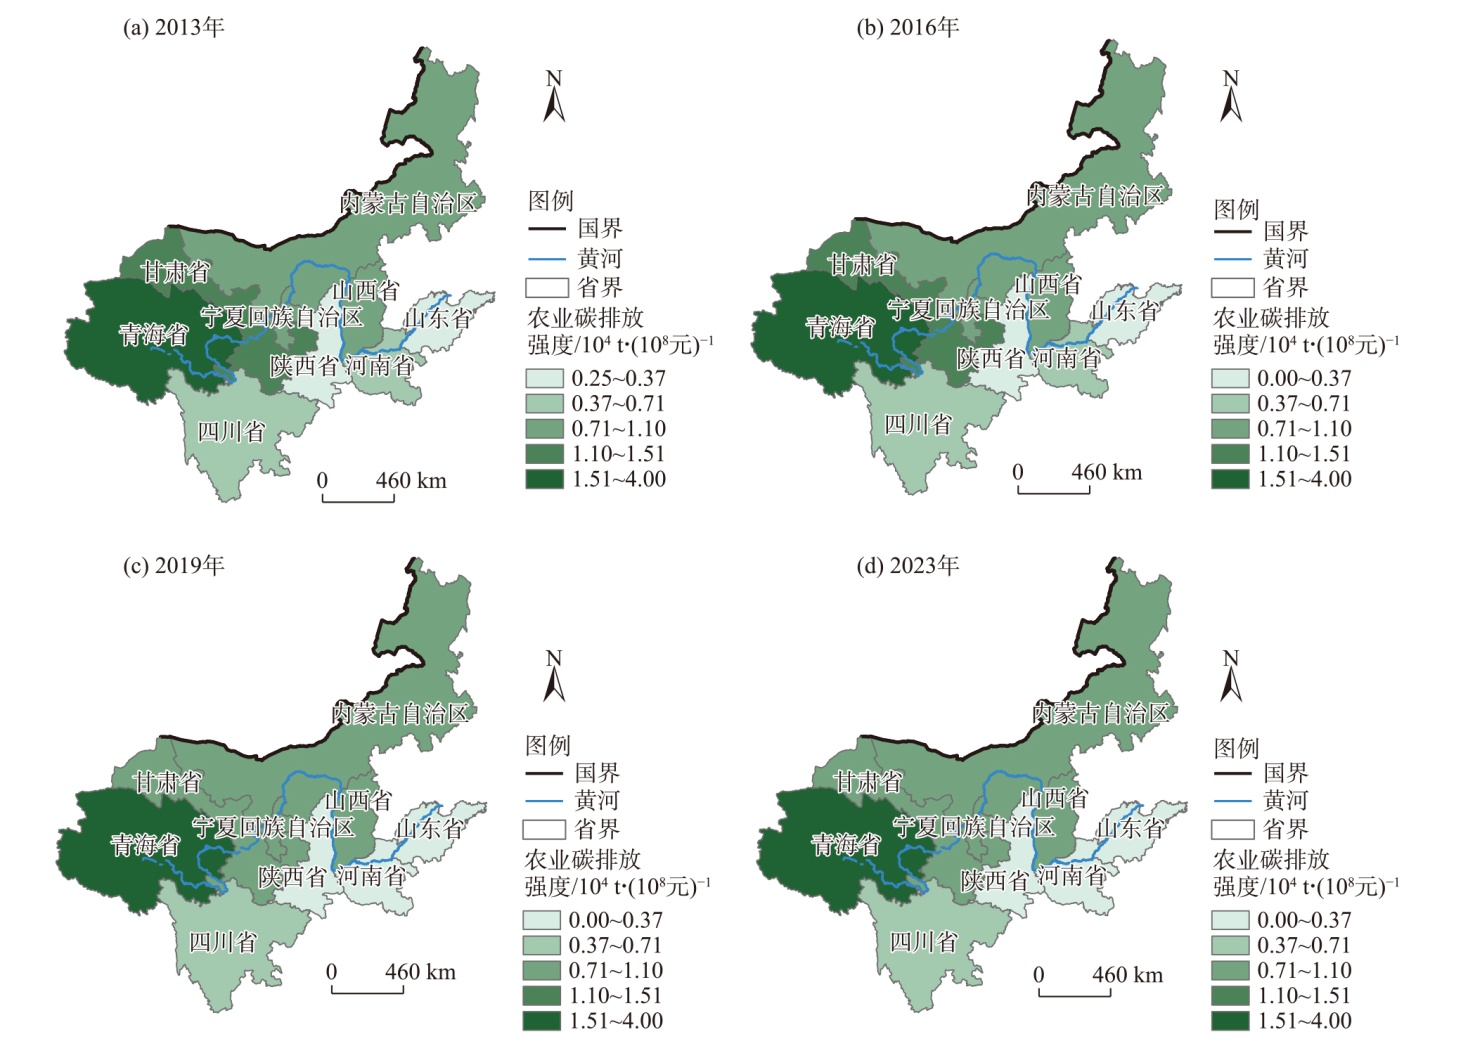
表5
2014—2023年黄河流域各效应贡献度"
| 年份 | 农业碳排放变化量 | 人口效应 | 经济效应 | 产业效应 | 结构效应 | 技术效应 |
|---|---|---|---|---|---|---|
| 2014 | 104.46 | -620.33 | 2051.37 | -547.89 | -58.56 | -720.11 |
| 2015 | 168.14 | -866.50 | 1901.86 | -678.55 | 95.57 | -284.24 |
| 2016 | -269.50 | -938.67 | 2305.93 | -833.45 | -85.63 | -717.67 |
| 2017 | -1240.22 | -856.05 | 2811.66 | -1536.59 | -101.71 | -1557.53 |
| 2018 | -389.74 | -640.18 | 2372.28 | -833.80 | -72.57 | -1215.47 |
| 2019 | -1113.74 | -610.45 | 1786.57 | 213.33 | 73.09 | -2576.30 |
| 2020 | 1779.97 | -848.12 | 1288.47 | 1717.00 | 130.11 | -507.48 |
| 2021 | 883.57 | -652.24 | 3264.75 | -1389.37 | 145.89 | -485.46 |
| 2022 | 395.55 | 778.05 | 477.07 | 34.54 | -24.23 | -869.88 |
| 2023 | 190.05 | -125.97 | 937.91 | -620.17 | 38.34 | -40.04 |
| 总效应 | 508.55 | -5380.50 | 19197.92 | -4474.96 | 140.29 | -8974.20 |
图8
2023年黄河流域9省(区)各分解效应贡献度"
| [1] |
马海清, 陈强强. 甘肃省农业碳排放时空分异特征及影响因素[J]. 干旱区地理, 2025, 48(5): 879-892.
doi: 10.12118/j.issn.1000-6060.2024.329 |
|
[Ma Haiqing, Chen Qiangqiang. Spatial-temporal differentiation characteristics and influencing factors of agricultural carbon emissions in Gansu Province[J]. Arid Land Geography, 2025, 48(5): 879-892.]
doi: 10.12118/j.issn.1000-6060.2024.329 |
|
| [2] | Quan T S, Zhang H, Quan T L, China’s agricultural land transfer: Carbon emissions driver or opportunity? The pivotal role of rural human capital revealed[J]. Frontiers in Sustainable Food Systems, 2024, 8: 1480636, doi: 10.3389/fsufs.2024.1480636. |
| [3] | 唐菁, 易露, 曾庆均. 长江经济带农业碳补偿率的时空演进特征及碳补偿潜力预测[J]. 环境科学, 2024, 45(11): 6378-6391. |
| [Tang Jing, Yi Lu, Zeng Qingjun. Spatial and temporal evolution characteristics of agricultural carbon offset rate and prediction of carbon offset potential in the Yangtze River economic belt[J]. Environmental Science, 2024, 45(11): 6378-6391.] | |
| [4] |
何艳秋, 戴小文. 中国农业碳排放驱动因素的时空特征研究[J]. 资源科学, 2016, 38(9): 1780-1790.
doi: 10.18402/resci.2016.09.15 |
|
[He Yanqiu, Dai Xiaowen. Phase characteristics and regional differences in agriculture carbon emissions in China[J]. Resources Science, 2016, 38(9): 1780-1790.]
doi: 10.18402/resci.2016.09.15 |
|
| [5] | 索瑞霞, 王琪, 张帆, 等. 黄河流域种植业碳排放的脱钩效应及影响因素分析[J]. 环境科学研究, 2025, 38(2): 220-230. |
| [Suo Ruixia, Wang Qi, Zhang Fan, et al. Study on the decoupling effect and drivers of carbon emissions from plantations in the Yellow River Basin[J]. Research of Environmental Sciences, 2025, 38(2): 220-230.] | |
| [6] | Zhang W X, Shen Y. Toward low-carbon agriculture: Measurement and driver analysis of agricultural carbon emissions in Sichuan Province, China[J]. Frontiers in Sustainable Food Systems, 2025, 9: 1565776, doi: 10.3389/fsufs.2025.1565776. |
| [7] | 徐丽杰, 董珍溪. 黄河流域农业碳排放时空特征及空间效应分析[J]. 华北水利水电大学学报(社会科学版), 2023, 39(2): 9-18. |
| [Xu Lijie, Dong Zhenxi. Spatio-temporal characteristics and spatial effects of agricultural carbon emissions in the Yellow River Basin[J]. Journal of North China University of Water Resources and Electric Power (Social Sciences Edition), 2023, 39(2): 9-18.] | |
| [8] | 庞洪伟, 刘鑫雨, 巩艳红, 等. 物联网发展、科技创新与农业碳排放强度[J]. 经济问题, 2024(2): 77-83. |
| [Pang Hongwei, Liu Xinyu, Gong Yanhong, et al. Internet of things development, technological innovation and agricultural carbon intensity[J]. On Economic Problems, 2024(2): 77-83.] | |
| [9] |
刘敏, 陈银蓉, 王珏, 等. 中国土地利用碳排放效率的空间关联网络及其驱动因素——基于国家重大战略区域的考察[J]. 资源科学, 2024, 46(12): 2462-2476.
doi: 10.18402/resci.2024.12.09 |
|
[Liu Min, Chen Yinrong, Wang Jue, et al. The spatial association network and driving factors of land use carbon emission efficiency in China: An investigation in the national major strategic regions[J]. Resources Science, 2024, 46(12): 2462-2476.]
doi: 10.18402/resci.2024.12.09 |
|
| [10] | 章楠楠, 徐皓帆, 李志文, 等. 基于机器学习的广东省县域农业碳排放时空演变及驱动因素研究[J]. 中国生态农业学报(中英文), 2024, 32(12): 1994-2007. |
| [Zhang Nannan, Xu Haofan, Li Zhiwen, et al. Spatiotemporal evolution and driving factors of agricultural carbon emissions at county level in Guangdong Province based on machine learning[J]. Chinese Journal of Eco-Agriculture, 2024, 32(12): 1994-2007.] | |
| [11] | 姚澜, 陈嘉涛, 徐霄, 等. 农业系统碳排放构成及演变——以衢州市为例[J]. 中国农业大学学报, 2024, 29(12): 82-98. |
| [Yao Lan, Chen Jiatao, Xu Xiao, et al. Carbon emission composition and evolution in agricultural systems: A case study of Quzhou City[J]. Journal of China Agricultural University, 2024, 29(12): 82-98.] | |
| [12] | 蓝艳, 花瑞祥, 景宜然, 等. 东盟国家碳排放动态演变及环境库兹涅茨曲线实证检验分析[J]. 生态与农村环境学报, 2024, 40(3): 303-312. |
| [Lan Yan, Hua Ruixiang, Jing Yiran, et al. Dynamic change of carbon emissions and environmental Kuznets curve empirical test analysis in the ASEAN[J]. Journal of Ecology and Rural Environmental, 2024, 40(3): 303-312.] | |
| [13] | 马志超. 黄河流域农业碳排放与经济增长时空耦合关系研究[J]. 中国农业资源与区划, 2024, 45(12): 15-26. |
| [Ma Zhichao. Spatio-temporal coupling relationship between agricultural carbon emissions and economic growth in the Yellow River Basin[J]. Chinese Journal of Agricultural Resources and Regional Planning, 2024, 45(12): 15-26.] | |
| [14] | 张俊, 黄煦旸, 彭宇琦. “双碳”目标下黄河流域种植业碳足迹的时空异质效应[J]. 河南农业大学学报, 2023, 57(5): 884-896. |
| [Zhang Jun, Huang Xuyang, Peng Yuqi. Spatiotemporal heterogeneity effects of carbon footprint in crop cultivation in the Yellow River Basin under the dual carbon goals[J]. Journal of Henan Agricultural University, 2023, 57(5): 884-896.] | |
| [15] | 刘建华, 闫静, 王慧扬, 等. 黄河流域农业科技创新对农业碳排放强度影响研究[J]. 生态经济, 2024, 40(12): 118-127. |
| [Liu Jianhua, Yan Jing, Wang Huiyang, et al. The influence of agricultural technological innovation on agricultural carbon emission intensity in the Yellow River Basin[J]. Ecological Economics, 2024, 40(12): 118-127.] | |
| [16] | 任世鑫, 李二玲, 赵金彩, 等. 黄河流域耕地利用碳排放时空特征及影响因素研究[J]. 中国土地科学, 2023, 37(10): 102-113. |
| [Ren Shixin, Li Erling, Zhao Jincai, et al. Spatial-temporal characteristics of carbon emissions from cultivated land use in the Yellow River Basin and the influencing factors[J]. Chinese Journal of Land Science, 2023, 37(10): 102-113.] | |
| [17] | 陈锋, 张晶, 任娇, 等. 基于LMDI模型的黄河流域碳排放时空差异及影响因素研究[J]. 地球环境学报, 2022, 13(4): 418-427. |
| [Chen Feng, Zhang Jing, Ren Jiao, et al. Spatiotemporal variations and influencing factors of carbon emissions in the Yellow River Basin based on the LMDI model[J]. Journal of Earth Environmental, 2022, 13(4): 418-427.] | |
| [18] | 刘顺翊, 李松青. 湖南省农业碳排放脱钩弹性及驱动因素——基于Tapio脱钩模型与LMDI分析[J]. 四川农业大学学报, 2023, 41(5): 952-960. |
| [Liu Shunyi, Li Songqing. Decoupling elasticity and drivers of agricultural carbon emissions in Hunan Province: Based on Tapio decoupling model and LMDI analysis[J]. Journal of Sichuan Agricultural University, 2023, 41(5): 952-960.] | |
| [19] | 刘波涛, 曲睿婷, 乔林, 等. 基于LMDI模型的辽宁省农业碳排放影响因素研究[J]. 农业工程, 2024, 14(10): 58-63. |
| [Liu Botao, Qu Ruiting, Qiao Lin, et al. Influencing factors of agricultural carbon emission in Liaoning Province based on LMDI model[J]. Agricultural Engineering, 2024, 14(10): 58-63.] | |
| [20] | 李慧, 李玮, 姚西龙. 基于GWR模型的农业碳排放影响因素时空分异研究[J]. 科技管理研究, 2019, 39(18): 238-245. |
| [Li Hui, Li Wei, Yao Xilong. Study on spatial and temporal variation of impacting factors of agricultural carbon emissions based on the GWR model[J]. Science and Technology Management Research, 2019, 39(18): 238-245.] | |
| [21] | 吴沣槭, 黄伟斌, 陈家乐, 等. 中国棉花生产碳排放核算与碳达峰预测[J]. 农业环境科学学报, 2023, 42(3): 692-704. |
| [Wu Fengqi, Huang Weibin, Chen Jiale, et al. Carbon emissions accounting and carbon peak prediction for cotton production in China[J]. Journal of Agro-Environment Sciences, 2023, 42(3): 692-704.] | |
| [22] | 马涛. 上海农业碳源碳汇现状评估及增加碳汇潜力分析[J]. 农业环境与发展, 2011, 28(5): 38-41. |
| [Ma Tao. Assessment of current status and analysis of potential for increasing carbon sinks in agricultural carbon sources and sinks in Shanghai[J]. Agro-Environment and Development, 2011, 28(5): 38-41.] | |
| [23] | 崔涵, 王丙参, 周明生. 中国农业碳排放时空演进及驱动因素[J]. 中国生态农业学报(中英文), 2024, 32(7): 1097-1108. |
| [Cui Han, Wang Bingcan, Zhou Mingsheng. Spatiotemporal evolution and driving factors of China’s agricultural carbon emissions[J]. Chinese Journal of Eco-Agriculture, 2024, 32(7): 1097-1108.] | |
| [24] | IPCC (Intergovernmental Panel on Climate Change). Climate change 2013: The physical science basis[R]. Batumi: IPCC Working Paper, 2013. |
| [25] | 邓宣凯. 武汉市土地利用碳排放的影响因素研究——基于扩展的Kaya等式和LMDI分解方法[J]. 农业与技术, 2021, 41(20): 104-109. |
| [Deng Xuankai. Factors influencing land use carbon emissions in Wuhan: An analysis based on the extended Kaya equation and LMDI decomposition method[J]. Agriculture and Technology, 2021, 41(20): 104-109.] | |
| [26] | 宁静, 李亚洁, 王震, 等. 中国粮食主产省区农业碳排放特征及影响因素[J]. 水土保持研究, 2024, 31(1): 450-459. |
| [Ning Jing, Li Yajie, Wang Zhen, et al. Characteristics and influencing factors of agricultural carbon emissions in major grain producing provinces in China[J]. Research on Soil and Water Conservation, 2024, 31(1): 450-459.] | |
| [27] | 姚石, 张秋泽, 刘俊娟, 等. 粮食安全与“双碳”视角下黄河流域农田生态补偿额度[J]. 水土保持通报, 2024, 44(3): 399-407. |
| [Yao Shi, Zhang Qiuzhe, Liu Junjuan, et al. Farmland ecological compensation amount in Yellow Rriver Basin from food security and “dual carbon” perspectives[J]. Bulletin of Soil and Water Conservation, 2024, 44(3): 399-407.] | |
| [28] | 陈申奥, 景晓栋, 陈洁. 生态价值视角下黄河流域农业生态效率时空演变及提升路径研究[J]. 江西农业学报, 2023, 35(5): 197-203. |
| [Chen Shen’ao, Jing Xiaodong, Chen Jie. Spatiotemporal evolution and enhancement pathways of agricultural ecological efficiency in the Yellow River Basin from an ecological value perspective[J]. Journal of Jiangxi Agricultural Sciences, 2023, 35(5): 197-203.] | |
| [29] | 张军涛, 韩祁祺. 黄河流域农业碳排放时空演变特征及影响因素研究[J]. 环境科学研究, 2025, 38(4): 754-766. |
| [Zhang Juntao, Han Qiqi. Spatiotemporal evolution characteristics and influencing factors of agricultural carbon emissions in the Yellow River Basin[J]. Research on Environmental Sciences, 2025, 38(4): 754-766.] | |
| [30] | 聂雷, 包雪丽, 孙权. 黄河流域农业碳排放的时空特征及驱动因素研究[J]. 资源与生态学报, 2025, 16(2): 457-471. |
|
[Nie Lei, Bao Xueli, Sun Quan. The spatiotemporal characteristics and driving factors of agricultural carbon emissions in the Yellow River Basin[J]. Journal of Resources and Ecology, 2025, 16(2): 457-471.]
doi: 10.5814/j.issn.1674-764x.2025.02.015 |
|
| [31] |
李梦冉, 徐小任, 王梁, 等. 黄河流域农业碳排放时空变化特征及影响因素分析[J]. 干旱区地理, 2025, 48(5): 854-865.
doi: 10.12118/j.issn.1000-6060.2024.401 |
|
[Li Mengran, Xu Xiaoren, Wang Liang, et al. Spatial-temporal characteristics and influencing factors of agricultural carbon emissions in the Yellow River Basin[J]. Arid Land Geography, 2025, 48(5): 854-865.]
doi: 10.12118/j.issn.1000-6060.2024.401 |
|
| [32] | 周航, 赵先超. 县域尺度下湖南省碳排放空间分异特征与影响因素[J]. 地球科学与环境学报, 2024, 46(2): 196-210. |
| [Zhou Hang, Zhao Xianchao. Spatial differentiation characteristics of carbon emission and its influencing factors in Hunan Province, China at the county scale[J]. Journal of Earth Sciences and Environmental, 2024, 46(2): 196-210.] |
| [1] | 卢雅焱, 封甜, 杨兆萍, 韩芳, 贾莹莹. 中国省域新质生产力与旅游高质量发展适配度时空演变及障碍因子研究[J]. 干旱区地理, 2026, 49(4): 643-655. |
| [2] | 关靖云, 孙之阳, 徐晓亮, 程乙峰, 宋贝贝, 房瑞莹. 气候变化背景下中国新疆与中亚五国旅游气候舒适度时空演变分析[J]. 干旱区地理, 2026, 49(4): 697-712. |
| [3] | 郝晓燕, 李玥蓉, 吴月. 黄河流域物流业全要素碳生产率测度及影响因素——基于能源禀赋差异视角[J]. 干旱区地理, 2026, 49(4): 756-768. |
| [4] | 张佳静, 王晓峰, 周潮伟, 周继涛, 白娟. 黄河“几字弯”土地退化中性评估及影响因素分析[J]. 干旱区地理, 2026, 49(4): 856-867. |
| [5] | 王伟军, 李娟, 李花. 黄河流域旅游-生态-福祉耦合协调的多尺度时空演化及分异机理[J]. 干旱区地理, 2026, 49(4): 683-696. |
| [6] | 周灵敏, 伊木然·库鲁万, 玉素甫江·如素力, 吴海智, 娜扎开提·尼加提. 中国西北干旱区大型湖泊湖冰物候时空差异及影响因素[J]. 干旱区地理, 2026, 49(3): 484-495. |
| [7] | 王慧丽, 李妞, 刘英, 刘咏涵. 黄河流域水资源-生态韧性动态耦合与级层障碍解析[J]. 干旱区地理, 2026, 49(3): 569-580. |
| [8] | 屠正伟, 张沛, 张中华. 银川都市圈乡村“三生空间”冲突格局演变特征及影响因素[J]. 干旱区地理, 2026, 49(3): 594-606. |
| [9] | 张嘉伟, 裴婷婷, 陈英, 谢保鹏. 大食物观下甘肃省粮食和重要农产品供给安全评价及影响因素[J]. 干旱区地理, 2026, 49(3): 619-630. |
| [10] | 周文丽, 武珊珊, 苏鹏. 新质生产力对旅游业高质量发展的影响效应研究——基于黄河流域9省区的实证[J]. 干旱区地理, 2026, 49(2): 224-234. |
| [11] | 陈宇, 岳游松. 黄河流域冰雪旅游目的地可达性及影响因素研究[J]. 干旱区地理, 2026, 49(2): 235-244. |
| [12] | 魏丽蓉, 程占红, 石烨, 张玉尧, 王紫彦, 牛莉芹. 黄河流域旅游生态安全的演化特征和影响因素分析——基于社会网络分析视角[J]. 干旱区地理, 2026, 49(2): 245-254. |
| [13] | 刘昊, 李福莲, 汪圣. 中国居家社区养老与机构养老耦合协调格局及影响因素研究[J]. 干旱区地理, 2026, 49(2): 381-392. |
| [14] | 孙国军, 李家瑶, 王子轩. 黄河流域数文旅产业发展水平评价与耦合协调时空特征分析[J]. 干旱区地理, 2026, 49(1): 117-127. |
| [15] | 朱怡婷, 梁桂仙, 周春山, 辛龙, 李金雪. 新疆文旅新质生产力发展时空演变特征与驱动因素[J]. 干旱区地理, 2026, 49(1): 128-139. |
|
||