干旱区地理 ›› 2021, Vol. 44 ›› Issue (2): 346-359.doi: 10.12118/j.issn.1000–6060.2021.02.06
高婧1,2( ),李胜楠3,井立红1,4,毛炜峄5(),井立军2
收稿日期:2020-05-08
修回日期:2020-10-19
出版日期:2021-03-25
发布日期:2021-04-14
通讯作者:
毛炜峄
作者简介:高婧(1978-),女,高级工程师,硕士,从事预报预测及气候变化研究. E-mail:基金资助:
GAO Jing1,2(),LI Shengnan3,JING Lihong1,4,MAO Weiyi5(),JING Lijun2
Received:2020-05-08
Revised:2020-10-19
Online:2021-03-25
Published:2021-04-14
Contact:
Weiyi MAO
摘要:
利用塔城地区7个国家气象观测站1961—2018年逐日气温资料,选用国际通用的10个极端气温指数,分析塔城地区极端气温的时空变化特征及其影响因子。结果表明:(1) 塔城地区极端气温指数暖化趋势明显,最低气温极低值以0.97 ℃·(10a)-1的倾向率显著升高,最高气温极高值以0.09 ℃·(10a)-1的倾向率不显著升高;冷昼、冷夜、霜冻、冰冻日数分别以1.75、5.24、4.07、1.84 d·(10a)-1的趋势减少,暖昼、暖夜、夏季、热夜日数分别以1.79、5.89、2.18、2.08 d·(10a)-1的趋势显著增加;选取的10个极端气温指数未来变化趋势均与过去58 a趋势相同,且持续性较强。(2) 冷指数与暖指数变幅表现出明显的不对称性,最低气温极低值变幅大于最高气温极高值,夜指数的变幅大于昼指数;大部分极端气温指数表现为地区北部的变暖幅度大于地区南部。(3) 最低气温极低值、冷昼、冷夜在20世纪80年代初期发生暖突变;暖昼、暖夜、夏季、热夜、霜冻在90年代中期发生暖突变。(4) 整体上来看,大气环流变化对冷指数的影响高于暖指数,其中冷昼、冷夜、霜冻、冰冻日数与冬季北半球、亚洲极涡面积指数正相关,与太平洋、北美、大西洋欧洲区极涡面积及欧亚、亚洲经向环流指数正相关,与欧亚、亚洲纬向环流、西藏高原指数负相关;暖昼、暖夜、夏季、热夜日数与夏季北半球、西太平洋副热带高压面积及西藏高原指数正相关。(5) 冷、暖指数受大西洋、热带太平洋地区海表温度变化的影响存在差异;夜指数比昼指数对海表温度的响应更明显。
高婧,李胜楠,井立红,毛炜峄,井立军. 新疆塔城地区极端气温变化特征及其影响因子分析[J]. 干旱区地理, 2021, 44(2): 346-359.
GAO Jing,LI Shengnan,JING Lihong,MAO Weiyi,JING Lijun. Varialility characteristics of extreme temperature and its influencing factors in Tacheng Prefecture, Xinjiang[J]. Arid Land Geography, 2021, 44(2): 346-359.
表1
极端气温指数定义"
| 类型 | 名称 | 代码 | 单位 | 定义 |
|---|---|---|---|---|
| 极值指数 | 最高气温极高值 | TXx | ℃ | 每年Tmax的最大值 |
| 最低气温极低值 | TNn | ℃ | 每年Tmin的最小值 | |
| 相对指数 | 冷昼日数 | TX10p | d | Tmax<1961—2018年的第10个百分位值的天数 |
| 冷夜日数 | TN10p | d | Tmin<1961—2018年的第10个百分位值的天数 | |
| 暖昼日数 | TX90p | d | Tmax>1961—2018年的第90个百分位值的天数 | |
| 暖夜日数 | TN90p | d | Tmin>1961—2018年的第90个百分位值的天数 | |
| 绝对指数 | 霜冻日数 | FD0 | d | 每年Tmin<0 ℃的天数 |
| 冰冻日数 | ID0 | d | 每年Tmax<0 ℃的天数 | |
| 夏季日数 | SU25 | d | 每年Tmax>25 ℃的天数 | |
| 热夜日数 | TR20 | d | 每年Tmin>20 ℃的天数 |
表2
塔城地区极端气温指数的变化趋势"
| 极端指数 变化趋势 | 1961— 1970年 | 1971— 1980年 | 1981— 1990年 | 1991— 2000年 | 2001— 2010年 | 2011— 2018年 | 塔城地区 | 全球[ | 中国[ | 西北 地区[ | 新疆[ | 天山 北坡[ |
|---|---|---|---|---|---|---|---|---|---|---|---|---|
| TXx/℃·(10a)-1 | -0.84 | 0.09 | -0.08 | 1.08 | 0.09 | 0.42 | 0.09 | 0.11 | - | 0.17 | - | 0.02 |
| TNn/℃·(10a)-1 | -5.86 | 2.05 | -0.82 | -1.75 | 0.74 | 7.80 | 0.97*** | 0.45 | - | 0.46 | - | 0.63** |
| TX10p/d·(10a)-1 | 27.40 | -11.18 | -2.10 | -3.00 | 0.25 | -15.29 | -1.75 | -0.67* | -0.70* | -1.50 | -2.60** | -1.07* |
| TN10p/d·(10a)-1 | 23.93 | -17.60 | -6.76 | -0.41 | -2.37 | -14.68 | -5.24*** | -1.09* | -1.44** | -4.80* | -6.57** | -3.23** |
| TX90p/d·(10a)-1 | -9.49 | 13.62 | -8.51 | 24.23 | 3.23 | 12.33 | 1.79* | 0.80* | 1.00* | 2.44* | 3.59** | 1.28* |
| TN90p/d·(10a)-1 | -6.32 | 15.19 | 0.36 | 30.99 | 3.71 | 6.09 | 5.89*** | 1.17 | 2.12** | 4.52* | 6.23** | 2.95** |
| FD0/d·(10a)-1 | 14.66 | -12.47 | 2.94 | -4.72 | -1.97 | 0.68 | -4.07*** | -1.80* | -2.84** | - | -3.69** | -2.89** |
| ID0/d·(10a)-1 | 23.11 | -3.38 | -6.85 | 1.96 | 7.07 | -12.21 | -1.84* | -1.23* | - | - | -1.61* | -1.63* |
| SU25/d·(10a)-1 | -17.90 | 11.58 | 1.27 | 24.39 | 0.48 | -3.61 | 2.18** | 0.47* | 1.77** | - | 2.14* | 1.34* |
| TR20/d·(10a)-1 | -4.48 | 4.13 | -1.16 | 13.81 | 3.46 | 2.94 | 2.08*** | 0.91* | 1.44** | - | 1.17** | 2.05** |
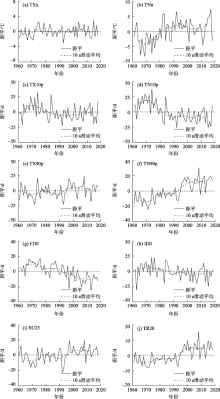
图1
1961—2018年塔城地区极端气温指数变化曲线"

表3
塔城地区极端气温指数持续性分析"
| 冷指数 | 过去趋势 | Hurst值 | 未来趋势 | 持续强度 | 暖指数 | 过去趋势 | Hurst值 | 未来趋势 | 持续强度 |
|---|---|---|---|---|---|---|---|---|---|
| TNn | + | 0.84 | + | 强 | TXx | + | 0.65 | + | 较弱 |
| TX10p | – | 0.73 | – | 较强 | TX90p | + | 0.66 | + | 较强 |
| TN10p | – | 0.90 | – | 极强 | TN90p | + | 0.91 | + | 极强 |
| FD0 | – | 0.82 | – | 强 | SU25 | + | 0.72 | + | 较强 |
| ID0 | – | 0.72 | – | 较强 | TR20 | + | 0.88 | + | 极强 |
表4
塔城地区极端气温指数的突变分析"
| 极端指数 | Tmean | TXx | TNn | TX10p | TN10p | TX90p | TN90p | FD0 | ID0 | SU25 | TR20 |
|---|---|---|---|---|---|---|---|---|---|---|---|
| 突变年份 | 1989年 | ○ | 1980年 | 1980年 | 1981年 | 1995年 | 1993年 | 1994年 | 1987年 | 1995年 | 1994年 |
| 突变后增/减百分比 | ↑21.7% | ○ | ↑13.5% | ↓21.5% | ↓33.0% | ↑25.3% | ↑72.9% | ↓8.6% | ↓8.1% | ↑9.4% | ↑67.8% |
| 突变后变化趋势 | ↗ | ○ | ↗ | ↘ | ↘ | ↗ | ↗ | ↘ | ↘ | ↗ | ↗ |
| 显著升/降年份 | 1991年 | ○ | 1991年 | 1999年 | 1987年 | 2008年 | 1989年 | 1997年 | 2006年 | 2005年 | 1997年 |
图2
塔城地区部分极端气温指数的M-K检验"


图3
塔城地区极端气温极值指数变化趋势的空间分布 注:实心三角形表示通过0.05显著性检验;空心三角形表示未通过显著性检验。下同。"

图4
塔城地区极端气温相对指数变化趋势的空间分布"
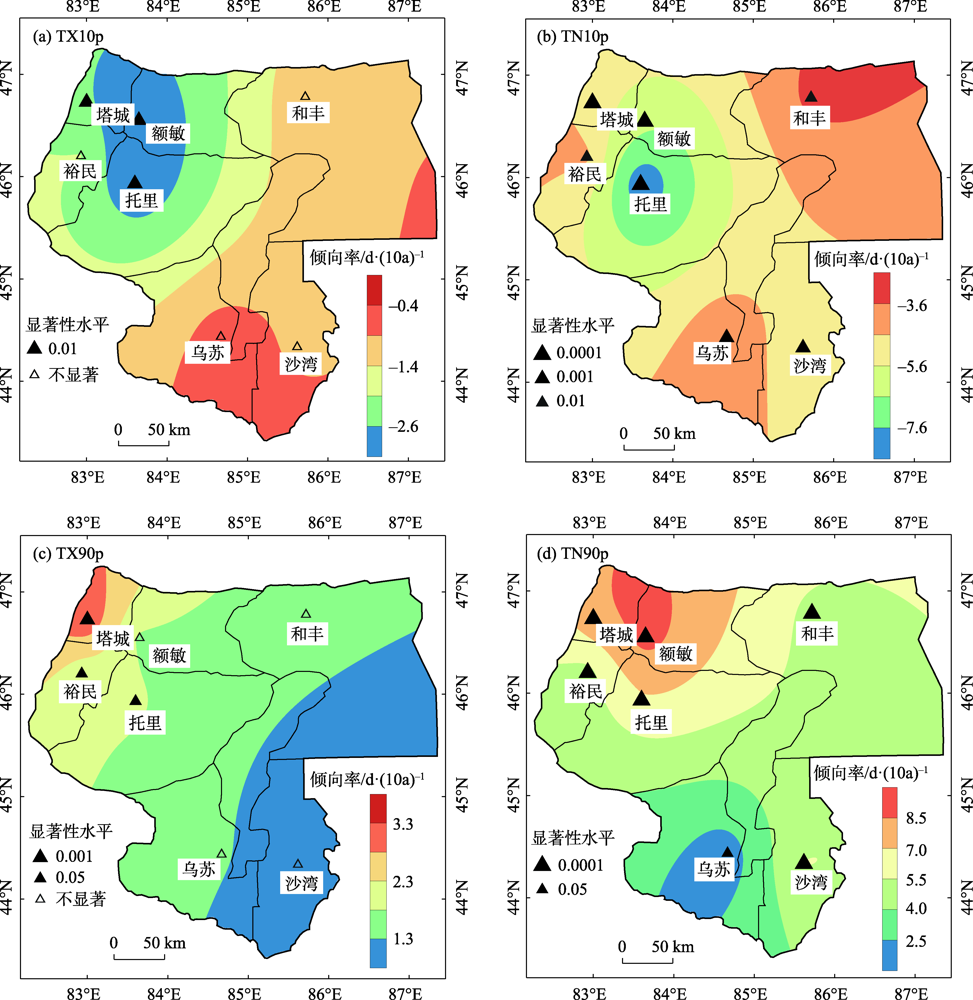
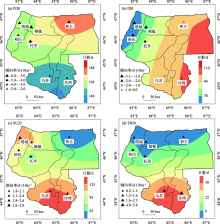
图5
塔城地区极端气温绝对指数日数及变化趋势的空间分布"

表5
极端气温指数变化趋势与地理位置的相关系数"
| 地理位置 | TNn | TX10p | TN10p | FD0 | ID0 | TXx | TX90p | TN90p | SU25 | TR20 |
|---|---|---|---|---|---|---|---|---|---|---|
| 经度 | -0.50 | 0.74 | 0.38 | 0.43 | 0.89* | -0.08 | -0.77* | -0.44 | -0.29 | 0.30 |
| 纬度 | -0.19 | -0.61 | -0.07 | -0.76 | -0.47 | 0.66 | 0.67 | 0.32 | 0.23 | -0.78* |
| 海拔高度 | -0.52 | -0.05 | -0.05 | -0.50 | 0.30 | 0.50 | -0.06 | -0.01 | 0.09 | -0.53 |
表6
极端气温指数与环流指数相关分析"
| 环流指数 | 冷指数 | 环流指数 | 暖指数 | ||||||||||
|---|---|---|---|---|---|---|---|---|---|---|---|---|---|
| TNn | TX10p | TN10p | FD0 | ID0 | TXx | TX90p | TN90p | SU25 | TR20 | ||||
| 北半球极涡 面积 | 冬季 | -0.40** | 0.37** | 0.45** | 0.36** | 0.32* | 北半球副热带高压面积 | 夏季 | 0.07 | 0.25 | 0.69** | 0.29* | 0.57** |
| 12月 | -0.16 | 0.15 | 0.20 | 0.17 | 0.10 | 6月 | 0.06 | 0.24 | 0.62** | 0.26* | 0.52** | ||
| 1月 | -0.37** | 0.44** | 0.48** | 0.29* | 0.39** | 7月 | 0.08 | 0.22 | 0.62** | 0.25 | 0.55** | ||
| 2月 | -0.37** | 0.24 | 0.32* | 0.33* | 0.23 | 8月 | 0.04 | 0.26* | 0.67** | 0.33* | 0.56** | ||
| 亚洲极涡面积 | 冬季 | -0.33* | 0.47** | 0.43** | 0.18 | 0.35** | 西太平洋副热带高压面积 | 夏季 | 0.05 | 0.16 | 0.50** | 0.10 | 0.43** |
| 12月 | 0.00 | 0.10 | 0.09 | 0.16 | 0.06 | 6月 | 0.05 | 0.24 | 0.54** | 0.18 | 0.48** | ||
| 1月 | -0.34** | 0.47** | 0.38** | 0.05 | 0.27* | 7月 | 0.11 | 0.13 | 0.41** | 0.03 | 0.35** | ||
| 2月 | -0.33* | 0.39** | 0.41** | 0.20 | 0.42** | 8月 | -0.03 | 0.04 | 0.38** | 0.07 | 0.31* | ||
表7
主要极端气温指数与大气环流指数的相关系数"
| 环流指数 | 冷指数 | 暖指数 | ||||||||
|---|---|---|---|---|---|---|---|---|---|---|
| TNn | TX10p | TN10p | FD0 | ID0 | TXx | TX90p | TN90p | SU25 | TR20 | |
| 欧亚纬向环流 | 0.45** | -0.61** | -0.56** | -0.16 | -0.48** | 0.28* | 0.13 | 0.14 | 0.04 | 0.18 |
| 欧亚经向环流 | -0.32* | 0.32* | 0.28* | 0.14 | 0.39** | 0.02 | 0.00 | -0.03 | -0.03 | -0.11 |
| 亚洲纬向环流 | 0.30* | -0.47** | -0.43** | -0.09 | -0.41** | 0.28* | 0.11 | 0.05 | -0.08 | 0.06 |
| 亚洲经向环流 | -0.38** | 0.41** | 0.34** | 0.13 | 0.44** | 0.05 | 0.14 | 0.10 | 0.08 | 0.01 |
| 西藏高原Ⅰ | 0.42** | -0.30* | -0.61** | -0.52** | -0.33* | 0.03 | 0.17 | 0.59** | 0.19 | 0.46** |
| 西藏高原Ⅱ | 0.45** | -0.36** | -0.65** | -0.56** | -0.38** | 0.07 | 0.20 | 0.61** | 0.23 | 0.48** |
| 太平洋极涡面积 | -0.33* | 0.14 | 0.30* | 0.49** | 0.28* | 0.08 | -0.05 | -0.34** | -0.27* | -0.28* |
| 北美极涡面积 | -0.29* | 0.27* | 0.46** | 0.41** | 0.32* | 0.07 | -0.04 | -0.42** | -0.21 | -0.34** |
| 大西洋欧洲极涡面积 | -0.35** | 0.21 | 0.43** | 0.41** | 0.23 | 0.11 | -0.12 | -0.51** | -0.25 | -0.48** |
表8
极端气温指数对海表温度的响应分析"
| 指数 | 冷指数 | 暖指数 | ||||||||
|---|---|---|---|---|---|---|---|---|---|---|
| TNn | TX10p | TN10p | FD0 | ID0 | TXx | TX90p | TN90p | SU25 | TR20 | |
| AMO | 0.30* | -0.28* | -0.46** | -0.61** | -0.38** | -0.03 | 0.32* | 0.66** | 0.44** | 0.62** |
| NTA | 0.25 | -0.2 | -0.41** | -0.52** | -0.33* | 0.01 | 0.23 | 0.55** | 0.28* | 0.50** |
| TSA | 0.11 | -0.02 | -0.24 | -0.25 | -0.20 | 0.04 | 0.15 | 0.41** | 0.15 | 0.35** |
| TNA | 0.15 | -0.18 | -0.33* | -0.47** | -0.31* | 0.00 | 0.25 | 0.49** | 0.27* | 0.46** |
| CAR | 0.41** | -0.32* | -0.50** | -0.60** | -0.42** | -0.02 | 0.27* | 0.61** | 0.35** | 0.57** |
| Niño3 | 0.31* | -0.30* | -0.41** | -0.30* | -0.21 | 0.24 | 0.16 | 0.22 | 0.05 | 0.21 |
| Niño4 | 0.29* | -0.22 | -0.37** | -0.34** | -0.25 | 0.01 | 0.02 | 0.16 | 0.00 | 0.10 |
| Niño1+2 | 0.31* | -0.28* | -0.39** | -0.28* | -0.15 | 0.28* | 0.18 | 0.28* | 0.06 | 0.29* |
| Niño3.4 | 0.28* | -0.27* | -0.35** | -0.25 | -0.23 | 0.13 | 0.06 | 0.10 | -0.02 | 0.08 |
| [1] | IPCC. Climate Change 2013: The physical science basis: Working group I contribution to the fifth assessment report of the intergovernmental panel on climate change[M]. Cambridge and New York: Cambridge University Press, 2014: 1535. |
| [2] | Alexander L V, Zhang X, Peterson T C, et al. Global observed changes in daily climate extremes of temperature and precipitation[J]. Journal of Geophysical Research: Atmospheres, 2006,111(D5):D006290, doi: 10.1029/2005JD006290. |
| [3] | Easterling D R, Evans J L, Groisman P Y, et al. Observed variability and trends in extreme climate events: A brief review[J]. Bulletin of the American Meteorological Society, 2000,81(3):417-426. |
| [4] | Frich P L, Alexander L V, Della-Marta P, et al. Observed coherent changes in climatic extremes during the second half of the twentieth century[J]. Climate Research, 2002,19(3):193-212. |
| [5] | Yan Z, Jones P D, Davies D, et al. Trends of extreme temperatures in Europe and China based on daily observations[J]. Climatic Change, 2002,53(1):355-392. |
| [6] | Aguilar E, Peterson T C, Obando P R, et al. Changes in precipitation and temperature extremes in Central America and northern South America, 1961—2003[J]. Journal of Geophysical Research: Atmospheres, 2005,110(D23):D006119, doi: 10.1029/2005JD006119. |
| [7] | Zhai P M, Pan X H. Trends in temperature extremes during 1951—1999 in China[J]. Geophysical Research Letters, 2003,30(17):169-172. |
| [8] | 龚志强, 王晓娟, 封国林, 等. 中国近58年温度极端事件的区域特征及其与气候突变的联系[J]. 物理学报, 2009,58(6):741-752. |
| [ Gong Zhiqiang, Wang Xiaojuan, Feng Guolin, et al. Regional characteristics of temperature changes in China during the past 58 years and its probable correlation with abrupt temperature change[J]. Acta Physica Sinica, 2009,58(6):741-752. ] | |
| [9] | 王岱, 游庆龙, 江志红, 等. 中国极端气温季节变化对全球变暖减缓的响应分析[J]. 冰川冻土, 2016,38(1):36-46. |
| [ Wang Dai, You Qinglong, Jiang Zhihong, et al. Response of seasonal extreme temperatures in China to the global warming slow down[J]. Journal of Glaciology and Geocryology, 2016,38(1):36-46. ] | |
| [10] | 杨萍, 刘伟东, 王启光, 等. 近40年我国极端温度变化趋势和季节特征[J]. 应用气象学报, 2010,21(1):29-36. |
| [ Yang Ping, Liu Weidong, Wang Qiguang, et al. The climatic change trend and seasonal characteristics of temperature extremes in China for the latest 40 years[J]. Journal of Applied Meteorology Science, 2010,21(1):29-36. ] | |
| [11] | 赵俊虎, 封国林, 张世轩, 等. 近48年中国的季节变化与极端温度事件的联系[J]. 物理学报, 2011,60(9):842-850. |
| [ Zhao Junhu, Feng Guolin, Zhang Shixuan, et al. The relationship between seasonal variation and extreme temperature events in China in recent 48 years[J]. Acta Physica Sinica, 2011,60(9):842-850. ] | |
| [12] | 周雅清, 任国玉. 中国大陆1956—2008年极端气温变化特征分析[J]. 气候与环境研究, 2010,15(4):405-417. |
| [ Zhou Yaqing, Ren Guoyu. Variation characteristics of extreme temperature indices in mainland China during 1956—2008[J]. Climatic and Environmental Research, 2010,15(4):405-417. ] | |
| [13] | 王晓娟, 龚志强, 任福民, 等. 1960—2009年中国冬季区域性极端低温事件的时空特征[J]. 气候变化研究进展, 2012,8(1):8-15. |
| [ Wang Xiaojuan, Gong Zhiqiang, Ren Fumin, et al. Temporal and spatial characteristics of winter extreme low events in China during 1960—2009[J]. Climate Change Research, 2012,8(1):8-15. ] | |
| [14] | 刘青蛾, 吴孝情, 陈晓宏, 等. 珠江流域1960—2012年极端气温的时空变化特征[J]. 自然资源学报, 2015,30(8):1356-1366. |
| [ Liu Qing’e, Wu Xiaoqing, Chen Xiaohong, et al. Temporal and spatial variation characteristics of extreme temperature in the Pearl River Basin during 1960—2012[J]. Journal of Natural Resources, 2015,30(8):1356-1366. ] | |
| [15] | 孙玉燕, 孙鹏, 姚蕊, 等. 1961—2014年淮河流域极端气温时空特征及区域响应[J]. 中山大学学报(自然科学版), 2019,58(1):1-11. |
| [ Sun Yuyan, Sun Peng, Yao Rui, et al. Variations and regional responses of extreme temperature events in the Huaihe River Basin in China during 1961—2014[J]. Acta Scientiarum Naturalium Universitatis Sunyatseni, 2019,58(1):1-11. ] | |
| [16] | 汪宝龙, 张明军, 魏军林, 等. 西北地区近50年气温和降水极端事件的变化特征[J]. 自然资源学报, 2012,27(10):1720-1733. |
| [ Wang Baolong, Zhang Mingjun, Wei Junlin, et al. The change in extreme events of temperature and precipitation over northwest China in recent 50 years[J]. Journal of Natural Resources, 2012,27(10):1720-1733. ] | |
| [17] | 赵安周, 刘宪锋, 朱秀芳, 等. 1965—2013年黄土高原地区极端气温趋势变化及空间差异[J]. 地理科学, 2016,35(4):639-652. |
| [ Zhao Anzhou, Liu Xianfeng, Zhu Xiufang, et al. Trend variations and spatial difference of extreme air temperature events in the Loess Plateau from 1965 to 2013[J]. Geosciences, 2016,35(4):639-652. ] | |
| [18] | 丁之勇, 董义阳, 鲁瑞洁. 1960—2015年中国天山南、北坡与山区极端气温时空变化特征[J]. 地理科学, 2018,38(8):1379-1390. |
| [ Ding Zhiyong, Dong Yiyang, Lu Ruijie, et al. Spatio-temporal variability of temperature extremes in Tianshan Mountains area, northwest China, during 1960—2015[J]. Scientia Geographica Sinica, 2018,38(8):1379-1390. ] | |
| [19] | 吕越敏, 李宗省, 冯起, 等. 近60年来祁连山极端气温变化研究[J]. 高原气象, 2019,38(5):959-970. |
| [ Lyu Yuemin, Li Zongxing, Feng Qi, et al. Analysis of extreme temperature changes in Qilian Mountains in the past 60 years[J]. Plateau Meteorology, 2019,38(5):959-970. ] | |
| [20] | 赵国永, 韩艳, 刘明华, 等. 1951—2014年内蒙古自治区极端气温事件时空变化特征[J]. 干旱区资源与环境, 2017,31(12):110-116. |
| [ Zhao Guoyong, Han Yan, Liu Minghua, et al. Characteristics of temporal and spatial variations of extreme temperature events in Inner Mongolia during 1951—2014[J]. Journal of Arid Land Resources and Environment, 2017,31(12):110-116. ] | |
| [21] | 李双双, 杨赛霓. 1960—2014年北京极端气温事件变化特征[J]. 地理科学, 2015,35(12):1640-1647. |
| [ Li Shuangshuang, Yang Saini. Changes of extreme temperature events in Beijing during 1960—2014[J]. Scientia Geographica Sinica, 2015,35(12):1640-1647. ] | |
| [22] | 蔡新玲, 吴素良, 贺皓, 等. 变暖背景下陕西极端气温变化分析[J]. 中国沙漠, 2012,32(4):1095-1102. |
| [ Cai Xinling, Wu Suliang, He Hao, et al. Change of extreme climate events in Shaanxi Province under global warming background[J]. Journal of Desert Research, 2012,32(4):1095-1102. ] | |
| [23] | 曹祥会, 龙怀玉, 张继宗, 等. 河北省主要极端气候指数的时空变化特征[J]. 中国农业气象, 2015,36(3):245-253. |
| [ Cao Xianghui, Long Huaiyu, Zhang Jizong, et al. Temporal and spatial variation analysis of the main extreme climate index in Hebei Province[J]. Chinese Journal of Agrometeorology, 2015,36(3):245-253. ] | |
| [24] | 慈晖, 张强, 张江辉, 等. 1961—2010年新疆极端气温时空演变特征研究[J]. 中山大学学报(自然科学版), 2015,54(4):129-138. |
| [ Ci Hui, Zhang Qiang, Zhang Jianghui, et al. Spatiotemporal variations of extreme temperature events over Xinjiang during 1961—2010[J]. Acta Scientiarum Naturalium Universitatis Sunyatseni, 2015,54(4):129-138. ] | |
| [25] | 张延伟, 葛全胜, 姜逢清, 等. 北疆地区1961—2010年极端气温事件变化特征[J]. 地理科学, 2016,36(2):296-302. |
| [ Zhang Yanwei, Ge Quansheng, Jiang Fengqing, et al. Evolution characteristics of the extreme high and low temperature events in north Xinjiang during 1961—2010[J]. Scientia Gegraphica Sinica, 2016,36(2):296-302. ] | |
| [26] | 魏凤英. 现代气候统计诊断与预测技术[M]. 北京: 气象出版社, 2007: 128-133. |
| [ Wei Fengying. Modern climatic statistical diagnosis and prediction technology[M]. Beijing: China Meteorological Press, 2007: 128-133. ] | |
| [27] | 甄英, 杨珊, 何静, 等. 基于M-K检验法与R/S法的宜宾市降水量分析[J]. 四川师范大学(自然科学版), 2017,40(3):392-397. |
| [ Zhen Ying, Yang Shan, He Jing, et al. Analysis of precipitation in Yibin City based on M-K test and R/S methods[J]. Journal of Sichuan Normal University (Natural Science), 2017,40(3):392-397. ] | |
| [28] | Donat M G, Alexander L V, Yang H. Global land-based datasets for monitoring climatic extremes[J]. Bulletin of the American Meteorological Society, 2013,94(7):997-1006. |
| [29] | 张大任, 郑静, 范军亮, 等. 近60年中国不同气候区极端温度事件的时空变化特征[J]. 中国农业气象, 2019,40(7):422-434. |
| [ Zhang Daren, Zheng Jing, Fan Junliang, et al. Spatiotemporal variations of extreme temperature indices in different climatic zones of China over the past 60 years[J]. Chinese Journal of Agrometeorology, 2019,40(7):422-434. ] | |
| [30] | 赵锐锋, 苏丽, 祝稳. 1961—2012年西北干旱区极端温度事件季节性时空分析[J]. 中国农学通报, 2017,33(12):63-73. |
| [ Zhao Ruifeng, Su Li, Zhu Wen. Seasonal spatio-temporal analysis of extreme temperature events in arid region of northwest China during 1961—2012[J]. China Agronomy Bulletin, 2017,33(12):63-73. ] | |
| [31] | Wang B L, Zhang M J, Wei J L, et al. Changes in extreme events of temperature and precipitation over Xinjiang, northwest China, during 1960—2009[J]. Quaternary International, 2013,298:141-151. |
| [32] | 张音, 古丽贤·吐尔逊拜, 苏里坦, 等. 近60 a新疆不同海拔气候变化的时空特征[J]. 干旱区地理, 2019,42(4):822-829. |
| [ Zhang Ying, Tuerxunbai Gulixian, Su Litan, et al. Spatial and temporal characteristics of climate change ant different altitudes in Xinjiang in the past 60 years[J]. Arid Land Geography, 2019,42(4):822-829. ] | |
| [33] | 黄浩, 张勃, 黄涛, 等. 近30 a甘肃河东地区极端气温指数时空变化特征及趋势预测[J]. 干旱区地理, 2020,43(2):320-328. |
| [ Huang Bo, Zhang Bo, Huang Tao, et al. Quantifying and predicting spatial and temporal variations in extreme temperatures since 1990 in Gansu Province, China[J]. Arid Land Geography, 2020,43(2):320-328. ] | |
| [34] | 谭红建, 蔡榕硕, 黄荣辉. 中国近海海表温度对气候变暖及暂缓的显著响应[J]. 气候变化研究进展, 2016,12(6):500-507. |
| [ Tan Hongjian, Cai Rongshuo, Huang Ronghui. Enhanced responses of sea surface temperature over offshore China to global warming and hiatus[J]. Climate Change Research, 2016,12(6):500-507. ] | |
| [35] | 王建. 现代自然地理学[M]. 北京: 高等教育出版社, 2002: 97-101. |
| [ Wang Jian. Modern physical geography[M]. Beijing: Higher Education Press, 2002: 97-101. ] | |
| [36] | Solomon S. Climate change 2007: The physical science basis: Working group contribution to the fourth assessment report of the IPCC[M]. Cambridge: Cambridge University Press, 2007. |
| [37] | 黄荣辉. 我国重大气候灾害的形成机理和预测理论研究[J]. 地球科学进展, 2006,21(6):564-575. |
| [ Huang Ronghui. Progresses in research on the formation mechanism and prediction theory of severe climatic disasters in China[J]. Advance in Earth Science, 2006,21(6):564-575. ] | |
| [38] | 周雅清, 任国玉. 城市化对华北地区极端气温事件频率的影响[J]. 高原气象, 2014,33(6):1589-1598. |
| [ Zhou Yaqing, Ren Guoyu. Urbanization effect on long-term trends of extreme temperature events in north China[J]. Plateau Meteorology, 2014,33(6):1589-1598. ] | |
| [39] | 吴蓉, 孙怡, 杨元建, 等. 城市化对安徽省极端气温事件的影响[J]. 气候变化研究进展, 2016,12(6):527-537. |
| [ Wu Rong, Sun Yi, Yang Yuanjian, et al. Effects of urbanization on extreme temperature events in Anhui Province[J]. Climate Change Research, 2016,12(6):527-537. ] | |
| [40] | 焦毅蒙, 赵娜, 岳天祥, 等. 城市化对北京市极端气候的影响研究[J]. 地理研究, 2020,39(2):461-472. |
| [ Jiao Yimeng, Zhao Na, Yue Tianxiang, et al. The effect of urbanization on extreme climate events in Beijing[J]. Geographical Research, 2020,39(2):461-472. ] | |
| [41] | 贺可, 吴世新, 杨怡, 等. 近40 a新疆土地利用及其绿洲动态变化[J]. 干旱区地理, 2018,41(6):1333-1340. |
| [ He Ke, Wu Shixin, Yang Yi, et al. Dynamic changes of land use and oasis in Xinjiang in the last 40 years[J]. Arid Land Geography, 2018,41(6):1333-1340. ] |
| [1] | 唐太斌, 周保, 金晓媚, 魏赛拉加, 马涛, 张永艳. 黄河源区夏季地表温度变化研究[J]. 干旱区地理, 2023, 46(8): 1250-1259. |
| [2] | 王学良, 陈仁升, 刘俊峰, 曹珊珊. 1956—2021年疏勒河上游山区洪水变化特征研究[J]. 干旱区地理, 2023, 46(8): 1260-1268. |
| [3] | 张勇军, 杨余辉, 胡义成, 冯先成, 杨景燕. 新疆喀什河流域水化学时空变化特征及灌溉适应性评价[J]. 干旱区地理, 2023, 46(4): 583-594. |
| [4] | 周丹, 保广裕, 苏献锋, 王力, 李宝华. 1961—2020年青海高原日照时数时空变化特征[J]. 干旱区地理, 2023, 46(1): 36-46. |
| [5] | 曹彦超,焦美玲,秦拓,郭桐. 1973—2020年甘肃河东夏半年降水变化特征及影响因素分析[J]. 干旱区地理, 2022, 45(6): 1695-1706. |
| [6] | 高婧,杨涛,李海燕,井立红,刘振新,曾华. 近60 a新疆塔城地区不同相态降水时空变化特征[J]. 干旱区地理, 2022, 45(5): 1347-1356. |
| [7] | 艾尔肯·图尔荪,玉素甫江·如素力,崔一爽,喀迪阿依·阿力木,米日阿依·买土地. 2000—2019年新疆大型湖泊湖冰物候时空变化特征[J]. 干旱区地理, 2022, 45(5): 1440-1449. |
| [8] | 成艺,武兰珍,刘峰贵,沈彦俊. 黄河上游近60 a径流量与降水量变化特征研究[J]. 干旱区地理, 2022, 45(4): 1022-1031. |
| [9] | 杨梅,李岩瑛,张春燕,杨吉萍,罗晓玲,聂鑫. 河西走廊中东部春季沙尘暴变化特征及其典型个例分析[J]. 干旱区地理, 2021, 44(5): 1339-1349. |
| [10] | 牛最荣,王启优,孙栋元,张芮,武雪,邢云鹏,展士杰. 基于径流还现的洮河流域径流变化特征研究[J]. 干旱区地理, 2021, 44(1): 149-157. |
| [11] | 马剑, 刘贤德, 李广, 赵维俊, 王顺利, 敬文茂, 马雪娥. 祁连山北麓中段青海云杉林土壤水热时空变化特征[J]. 干旱区地理, 2020, 43(4): 1033-1040. |
| [12] | 孙栋元, 齐广平, 马彦麟, 鄢继选, 武兰珍, 康燕霞. 疏勒河干流径流变化特征研究 [J]. 干旱区地理, 2020, 43(3): 557-567. |
| [13] | 王凤娇, 梁伟, 傅伯杰, 金朝, 闫娜娜. 近年来的黄土高原耕地时空变化与口粮安全耕地数量分析 [J]. 干旱区地理, 2020, 43(1): 161-171. |
| [14] | 高瑜莲, 柳锦宝, 柳维扬, 于静, 刘志红. 近14 a新疆南疆绿洲地区地表蒸散与干旱的时空变化特征研究[J]. 干旱区地理, 2019, 42(4): 830-837. |
| [15] | 张亚宁, 张明军, 王圣杰, 杜铭霞, 马荣, 王杰. 1961—2015年中国降水面积变化特征研究[J]. 干旱区地理, 2019, 42(4): 762-773. |
|
||