- 2025年5月14日 星期三
干旱区地理 ›› 2023, Vol. 46 ›› Issue (8): 1291-1302.doi: 10.12118/j.issn.1000-6060.2022.496 cstr: 32274.14.ALG2022496
李科1,2( ),丁建丽1,2(),韩礼敬1,2,葛翔宇1,2,顾永昇1,2,周倩1,2,吕阳霞3
收稿日期:2022-09-30
修回日期:2022-10-29
出版日期:2023-08-25
发布日期:2023-09-21
作者简介:李科(1996-),男,硕士研究生,主要从事干旱区遥感与GIS应用研究. E-mail: 基金资助:
LI Ke1,2(),DING Jianli1,2(),HAN Lijing1,2,GE Xiangyu1,2,GU Yongsheng1,2,ZHOU Qian1,2,LYU Yangxia3
Received:2022-09-30
Revised:2022-10-29
Published:2023-08-25
Online:2023-09-21
摘要:
干旱半干旱地区急需高分辨率的土壤盐度图用于显示盐度空间分布的细微变化,指导盐渍化区域和潜在盐渍化区域制定土地资源管理政策和水资源管理政策,防止土壤进一步退化,保障农业经济可持续发展和粮食安全生产。基于PlanetScope影像,提取植被光谱指数和土壤盐度指数,共计21个变量,将其输入装袋回归(Bootstrap aggregating,Bagging)算法中,构建了土壤盐度预测模型Model-Ⅰ;使用最相关最小冗余(Max-relevance and min-redundancy,mRMR)方法筛选特征变量,将其输入Bagging中,构建了土壤盐度预测模型Model-Ⅱ,使用野外采样数据来辅助建模并进行验证。通过模型评价指标对Model-Ⅰ和Model-Ⅱ进行评估。结果表明:Model-Ⅱ的预测性能优于Model-Ⅰ(验证集决定系数为0.66,均方根误差为18.00 dS·m-1,四分位数的相对预测误差为3.21),mRMR有效降低了多维特征冗余问题。PlanetScope影像结合mRMR方法成功绘制了高分辨率土壤盐度图,提供了更详细的土壤盐度空间分布信息,研究结果对利用PlanetScope数据监测土壤盐渍化信息起推动作用。
李科, 丁建丽, 韩礼敬, 葛翔宇, 顾永昇, 周倩, 吕阳霞. 基于PlanetScope影像的典型绿洲土壤盐渍化数字制图[J]. 干旱区地理, 2023, 46(8): 1291-1302.
LI Ke, DING Jianli, HAN Lijing, GE Xiangyu, GU Yongsheng, ZHOU Qian, LYU Yangxia. Digital mapping of soil salinization in a typical oasis based on PlanetScope images[J]. Arid Land Geography, 2023, 46(8): 1291-1302.
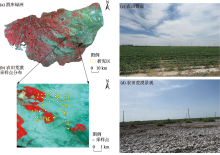
图1
研究区概况图"

表1
PlanetScope影像光谱波段参数"
| 波段 | 波段名 | 波长/nm |
|---|---|---|
| 蓝波段 | B2 | 465~515 |
| 绿波段Ⅰ | B3 | 513~549 |
| 绿波段II | B4 | 547~583 |
| 黄波段 | B5 | 600~620 |
| 红波段 | B6 | 650~680 |
| 红边波段 | B7 | 697~713 |
| 近红外波段 | B8 | 845~885 |
表2
基于PlanetScope影像光谱指数计算"
| 光谱指数 | 名称 | 公式 | 参考 |
|---|---|---|---|
| 土壤调节植被指数 | SAVI | [ | |
| 比值植被指数 | RVI | [ | |
| 增强植被指数 | EVI | [ | |
| 归一化差值植被指数 | NDVI | [ | |
| 归一化差异盐度指数 | NDSI | [ | |
| 亮度指数 | BI | [ | |
| 盐度指数 | SI | [ | |
| 盐度指数 | SI1 | [ | |
| 盐度指数 | SI2 | [ | |
| 盐度指数 | SI3 | [ | |
| 盐度指数 | S1 | [ | |
| 盐度指数 | S2 | [ | |
| 盐度指数 | S3 | [ | |
| 盐度指数 | S4 | [ | |
| 盐度指数 | S5 | [ | |
| 盐度指数 | S6 | [ |
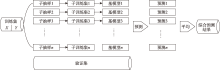
图2
Bagging回归算法预测过程"

表3
PlanetScope数据建模策略细节"
| 模型 | 模型方法 | 特征选择 | 特征变量类型 |
|---|---|---|---|
| Model-Ⅰ | Bagging | - | 波段反射率数据(B2、B4、B6、B7、B8)+光谱指数(SAVI、RVI、EVI、NDVI、NDSI、BI、SI、SI1、SI2、SI3、S1、S2、S3、S4、S5、S6) |
| Model-Ⅱ | Bagging | mRMR | 波段反射率数据(B4)+光谱指数(EVI、S6、S1、SI2、NDSI、BI) |

图3
电导率统计图 注:EC为电导率。下同。"
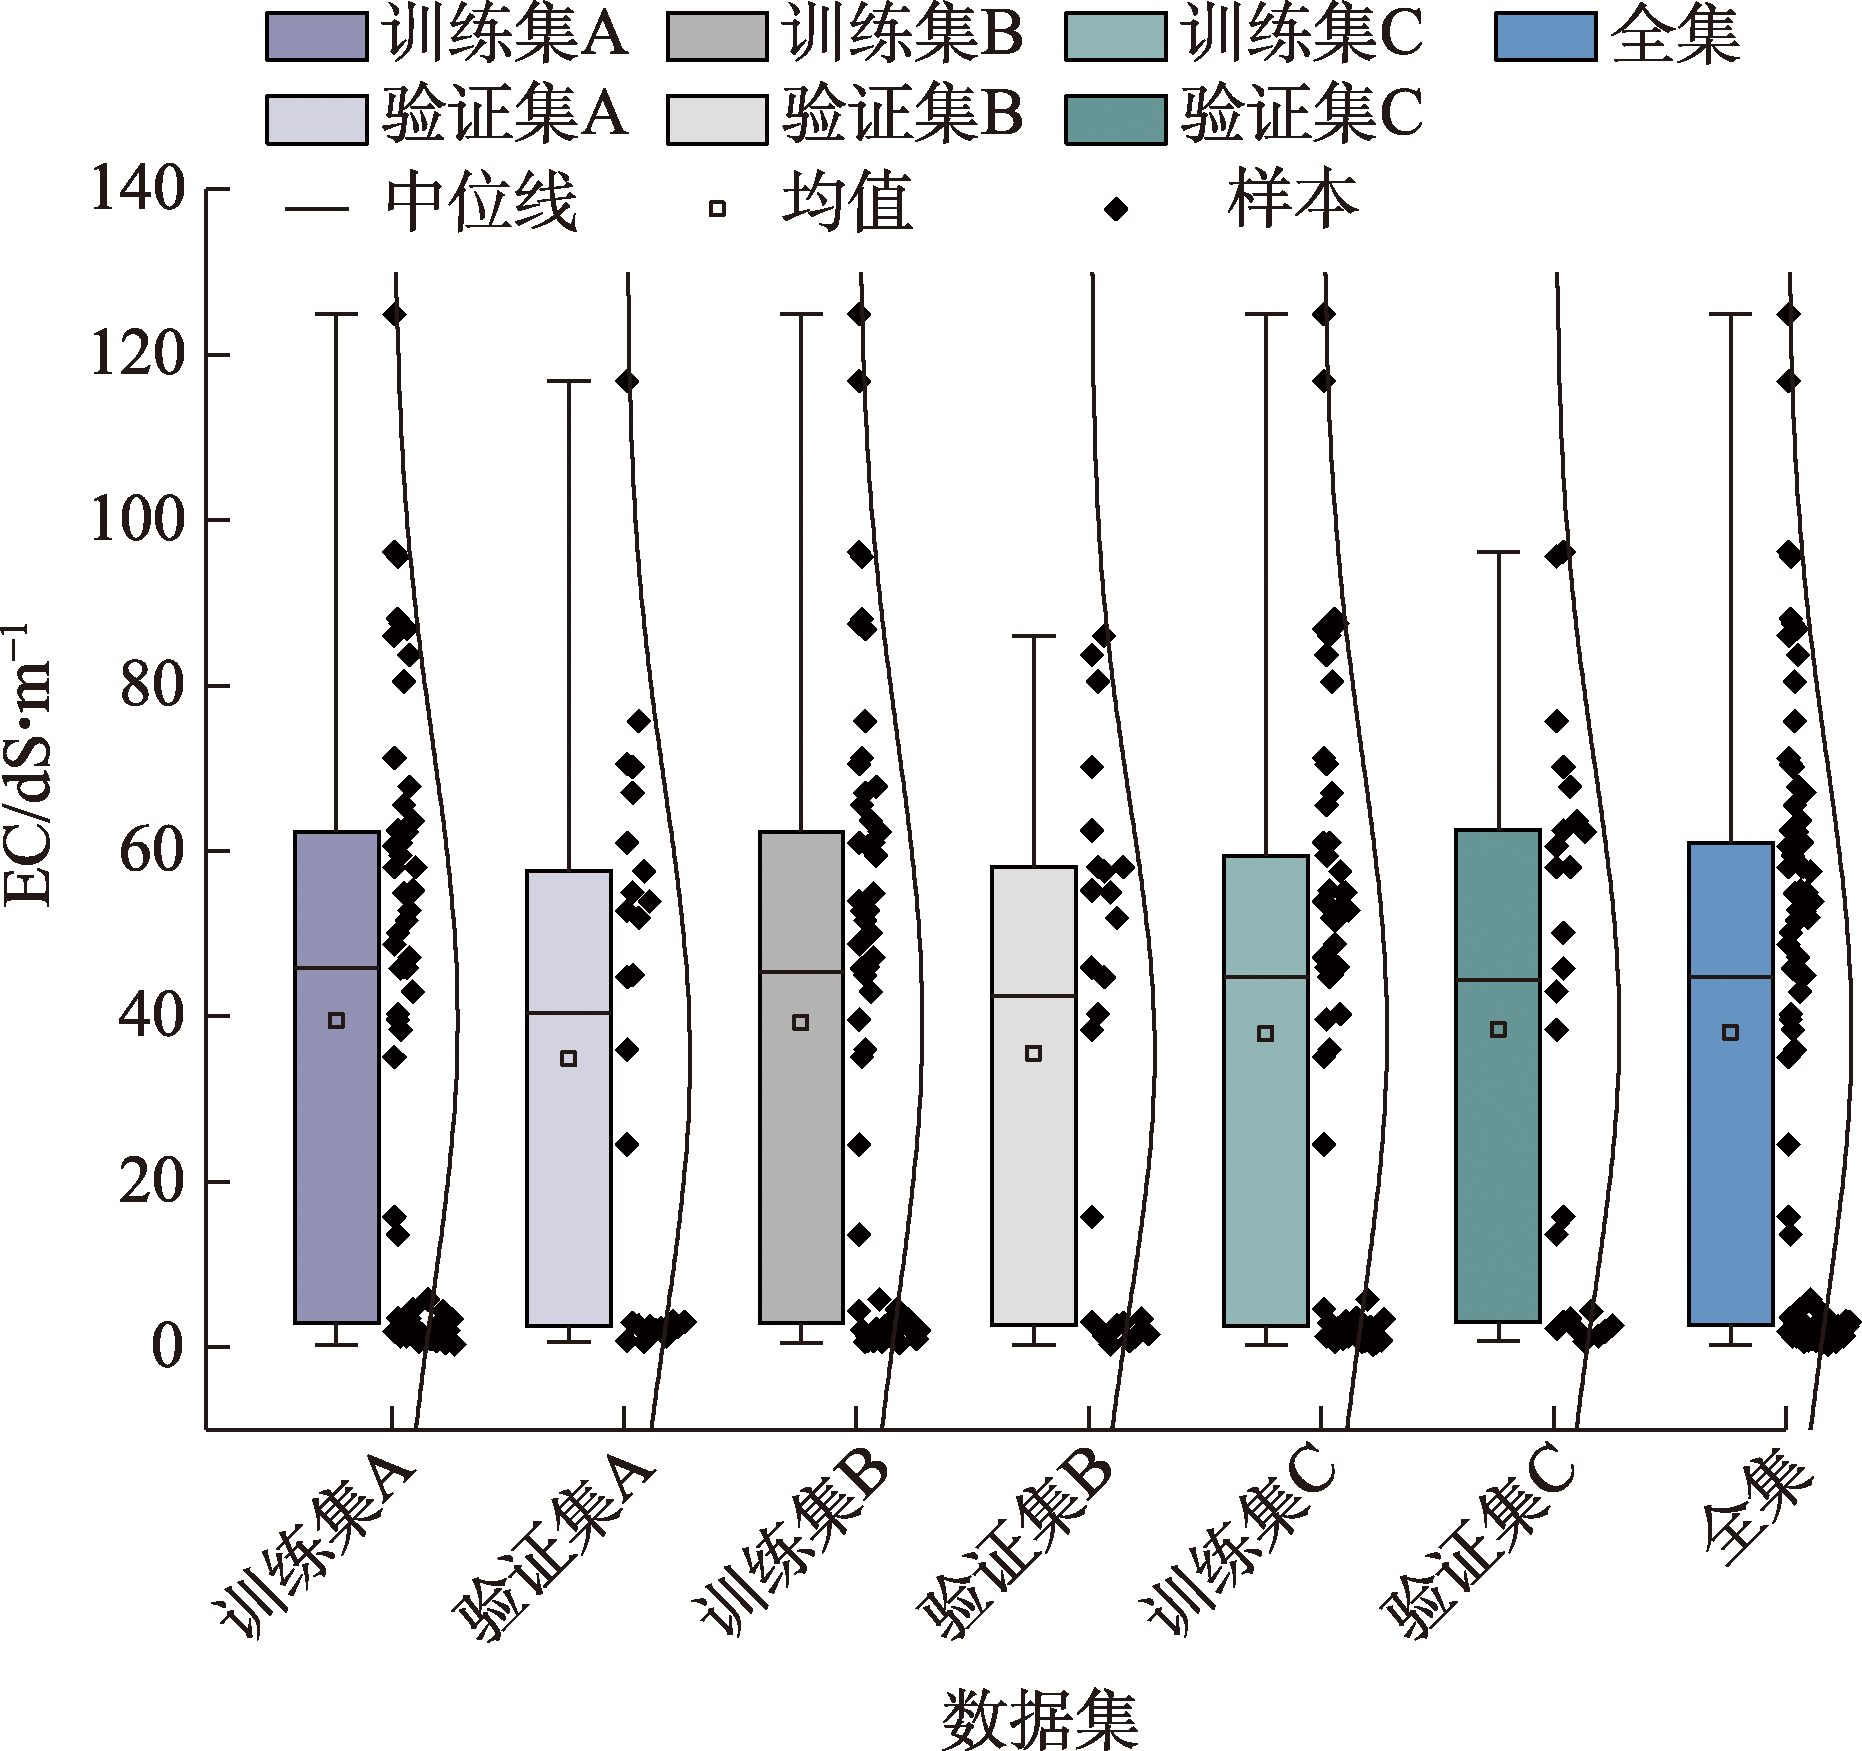
表4
数据集A、B和C与全集EC描述性统计"
| 数据集 | 平均值/dS·m-1 | 标准差/dS·m-1 | 变异系数 |
|---|---|---|---|
| 训练集A | 39.47 | 33.55 | 0.85 |
| 验证集A | 34.86 | 32.60 | 0.93 |
| 训练集B | 39.19 | 34.45 | 0.88 |
| 验证集B | 35.51 | 30.48 | 0.86 |
| 训练集C | 37.88 | 33.82 | 0.89 |
| 验证集C | 38.42 | 32.21 | 0.84 |
| 全集 | 38.04 | 33.13 | 0.87 |
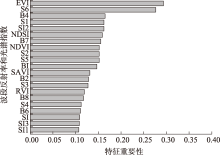
图4
PlanetScope波段反射率和光谱指数的特征重要性 注:SAVI为土壤调节植被指数; RVI为比值植被指数;EVI为增强植被指数;NDVI为归一化差值植被指数;NDSI为归一化差异盐度指数;BI为亮度指数;SI、SI1、SI2、SI3、S1、S2、S3、S4、S5和S6为盐度指数。"
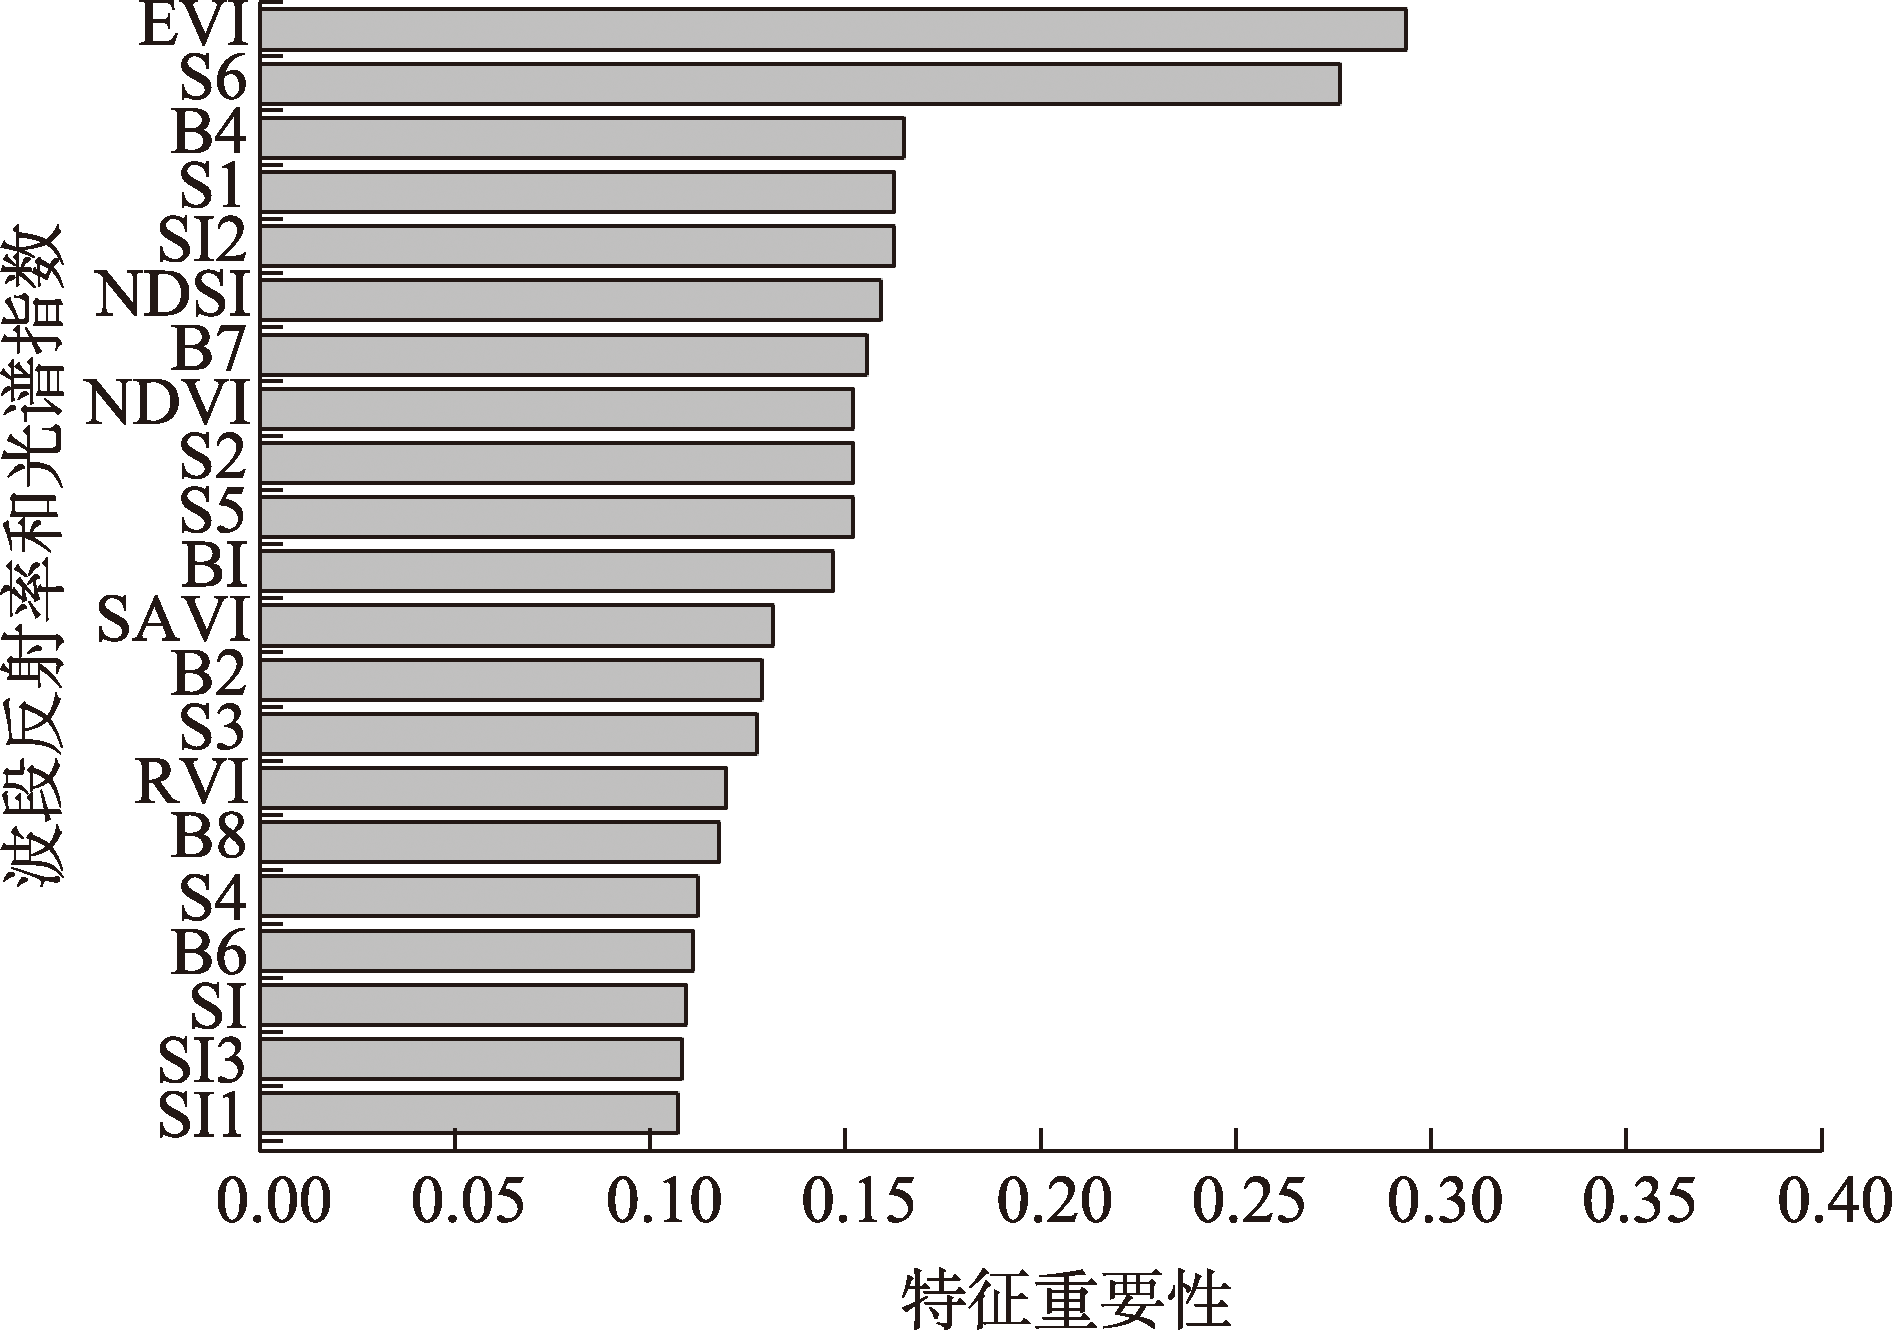

图5
模型参数调整 注:R2为决定系数。下同。"
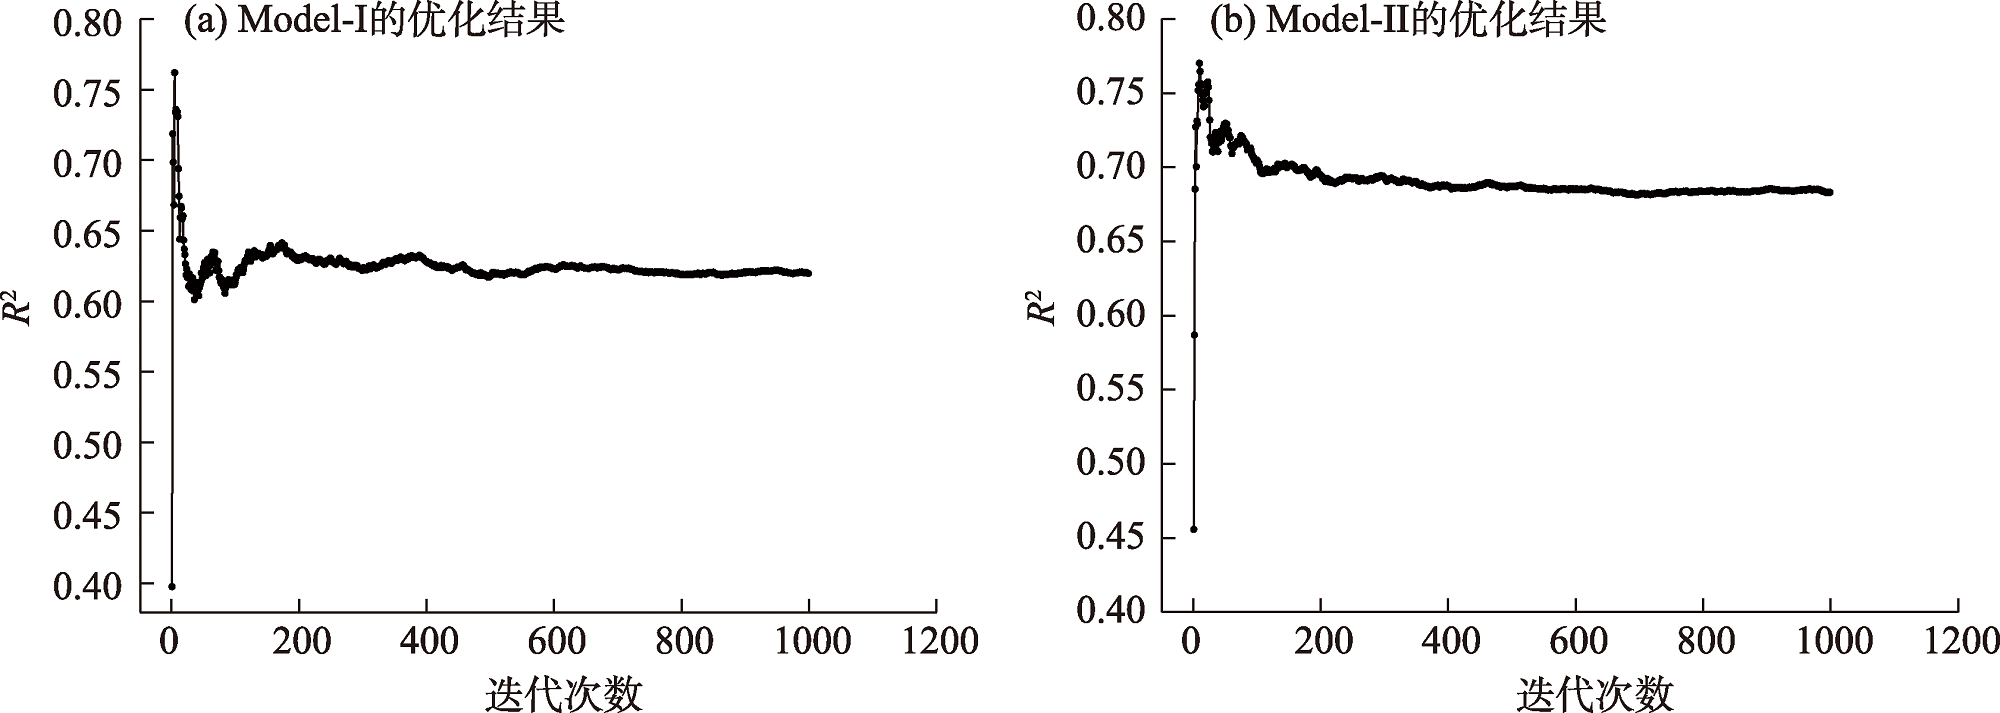
表5
模型预测性能比较"
| 数据集 | 模型 | 训练集 | 验证集 | RPIQ | |||
|---|---|---|---|---|---|---|---|
| R2 | RMSE/dS·m-1 | R2 | RMSE/dS·m-1 | ||||
| A | Model-Ⅰ | 0.79 | 15.26 | 0.67 | 18.41 | 3.34 | |
| Model-Ⅱ | 0.90 | 10.27 | 0.76 | 15.78 | 3.93 | ||
| B | Model-Ⅰ | 0.79 | 15.82 | 0.41 | 22.95 | 2.27 | |
| Model-Ⅱ | 0.87 | 12.48 | 0.66 | 17.45 | 3.00 | ||
| C | Model-Ⅰ | 0.76 | 16.43 | 0.49 | 22.58 | 2.42 | |
| Model-Ⅱ | 0.87 | 11.93 | 0.57 | 20.75 | 2.71 | ||
| 平均 | Model-Ⅰ | 0.78 | 15.84 | 0.52 | 21.32 | 2.68 | |
| Model-Ⅱ | 0.88 | 11.56 | 0.66 | 18.00 | 3.21 | ||
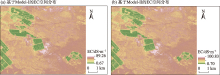
图6
土壤电导率空间分布"

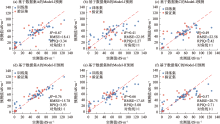
图7
模型Model-Ⅰ和Model-Ⅱ预测性能比较 注:RMSE为均方根误差;RPIQ为四分位数的相对预测误差。"

| [1] |
Hassani A, Azapagic A, Shokri N, et al. Predicting long-term dynamics of soil salinity and sodicity on a global scale[J]. Proceedings of the National Academy of Sciences, 2020, 117(52): 33017-33027.
doi: 10.1073/pnas.2013771117 |
| [2] |
Schoups G, Hopmans J W, Young C A, et al. Sustainability of irrigated agriculture in the San Joaquin Valley, California[J]. Proceedings of the National Academy of Sciences, 2005, 102(43): 15352-15356.
doi: 10.1073/pnas.0507723102 |
| [3] | 赵爽, 丁建丽, 韩礼敬, 等. 新疆典型盐渍土微波介电特性响应分析与建模[J]. 干旱区地理, 2022, 45(5): 1534-1546. |
| [Zhao Shuang, Ding Jianli, Han Lijing, et al. Response analysis and modeling of microwave dielectric properties of typical saline soil in Xinjiang[J]. Arid Land Geography, 2022, 45(5): 1534-1546.] | |
| [4] | 赵其国, 周生路, 吴绍华, 等. 中国耕地资源变化及其可持续利用与保护对策[J]. 土壤学报, 2006, 43(4): 662-672. |
| [Zhao Qiguo, Zhou Shenglu, Wu Shaohua, et al. Cultivated land resources and strategies for its sustainable utilization and protection in China[J]. Acta Pedologica Sinica, 2006, 43(4): 662-672.] | |
| [5] | Zaman M, Shahid S A, Heng L, et al. Guideline for salinity assessment, mitigation and adaptation using nuclear and related techniques[M]. Cham: Springer Nature, 2018: 1-42. |
| [6] |
丁建丽, 王飞. 干旱区大尺度土壤盐度信息环境建模——以新疆天山南北中低海拔冲积平原为例[J]. 地理学报, 2017, 72(1): 64-78.
doi: 10.11821/dlxb201701006 |
|
[Ding Jianli, Wang Fei. Environmental modeling of large-scale soil salinity information in an arid region: A case study of the low and middle altitude alluvial plain north and south of the Tianshan Mountains, Xinjiang[J]. Acta Geographica Sinica, 2017, 72(1): 64-78.]
doi: 10.11821/dlxb201701006 |
|
| [7] | 杨琳, Fahmy Sherif, Hann Sheldon, 等. 基于土壤-环境关系的更新传统土壤图研究[J]. 土壤学报, 2010, 47(6): 1039-1049. |
| [Yang Lin, Fahmy Sherif, Hann Sheldon, et al. Updating conventional soil maps using knowledge on soil-environment relationships extracted from the maps[J]. Acta Pedologica Sinica, 2010, 47(6): 1039-1049.] | |
| [8] | Metternicht, Graciela, Alfred Zinck, et al. Remote sensing of soil salinization: Impact on land management[M]. Boca Raton: CRC Press, 2008: 4-56. |
| [9] |
Howari F M, Goodell P C, MiyamotoI S. Spectral properties of salt crusts formed on saline soils[J]. Journal of Environmental Quality, 2002, 31(5): 1453-1461.
pmid: 12371161 |
| [10] |
Mulder V L, De Bruin S, Schaepman M E, et al. The use of remote sensing in soil and terrain mapping: A review[J]. Geoderma, 2011, 162(1-2): 1-19.
doi: 10.1016/j.geoderma.2010.12.018 |
| [11] |
Wang J, Ding J, Abulimiti A, et al. Quantitative estimation of soil salinity by means of different modeling methods and visible-near infrared (VIS-NIR) spectroscopy, Ebinur Lake Wetland, northwest China[J]. PeerJ, 2018, 6: e4703, doi: 10.7717/peerj.4703.
doi: 10.7717/peerj.4703 |
| [12] |
Elmetwalli A M H, Tyler A N, Hunter P D, et al. Detecting and distinguishing moisture-and salinity-induced stress in wheat and maize through in situ spectroradiometry measurements[J]. Remote Sensing Letters, 2012, 3(4): 363-372.
doi: 10.1080/01431161.2011.599346 |
| [13] |
Gorji T, Yildirim A, Hamzehpour N, et al. Soil salinity analysis of Urmia Lake Basin using Landsat-8 OLI and Sentinel-2A based spectral indices and electrical conductivity measurements[J]. Ecological Indicators, 2020, 112: 106173, doi: 10.1016/j.ecolind.2020.106173.
doi: 10.1016/j.ecolind.2020.106173 |
| [14] |
Fernandez-Buces N, Siebe C, Cram S, et al. Mapping soil salinity using a combined spectral response index for bare soil and vegetation: A case study in the former lake Texcoco, Mexico[J]. Journal of Arid Environments, 2006, 65(4): 644-667.
doi: 10.1016/j.jaridenv.2005.08.005 |
| [15] | Ding J, Yu D. Monitoring and evaluating spatial variability of soil salinity in dry and wet seasons in the Werigan-Kuqa Oasis, China, using remote sensing and electromagnetic induction instruments[J]. Geoderma, 2014, 235: 316-322. |
| [16] |
Farifteh J, Van der Meer F, Atzberger C, et al. Quantitative analysis of salt-affected soil reflectance spectra: A comparison of two adaptive methods (PLSR and ANN)[J]. Remote Sensing of Environment, 2007, 110(1): 59-78.
doi: 10.1016/j.rse.2007.02.005 |
| [17] |
Grimm R, Behrens T, Märker M, et al. Soil organic carbon concentrations and stocks on Barro Colorado Island: Digital soil mapping using random forests analysis[J]. Geoderma, 2008, 146(1-2): 102-113.
doi: 10.1016/j.geoderma.2008.05.008 |
| [18] |
Ma G, Ding J, Han L, et al. Digital mapping of soil salinization based on Sentinel-1 and Sentinel-2 data combined with machine learning algorithms[J]. Regional Sustainability, 2021, 2(2): 177-188.
doi: 10.1016/j.regsus.2021.06.001 |
| [19] | Allbed A, Kumar L, Aldakheel Y Y, et al. Assessing soil salinity using soil salinity and vegetation indices derived from IKONOS high-spatial resolution imageries: Applications in a date palm dominated region[J]. Geoderma, 2014, 230: 1-8. |
| [20] |
Wang F, Yang S, Yang W, et al. Comparison of machine learning algorithms for soil salinity predictions in three dryland oases located in Xinjiang Uygur Autonomous Region (XJUAR) of China[J]. European Journal of Remote Sensing, 2019, 52(1): 256-276.
doi: 10.1080/22797254.2019.1596756 |
| [21] |
Zhou T, Lu H L, Wang W W, et al. GA-SVM based feature selection and parameter optimization in hospitalization expense modeling[J]. Applied Soft Computing, 2019, 75: 323-332.
doi: 10.1016/j.asoc.2018.11.001 |
| [22] |
Ding C, Peng H. Minimum redundancy feature selection from microarray gene expression data[J]. Journal of Bioinformatics and Computational Biology, 2005, 3(2): 185-205.
doi: 10.1142/s0219720005001004 pmid: 15852500 |
| [23] |
Peng J, Biswas A, Jiang Q, et al. Estimating soil salinity from remote sensing and terrain data in southern Xinjiang Province, China[J]. Geoderma, 2019, 337: 1309-1319.
doi: 10.1016/j.geoderma.2018.08.006 |
| [24] | 马慧琴, 黄文江, 景元书, 等. 基于 AdaBoost模型和mRMR算法的小麦白粉病遥感监测[J]. 农业工程学报, 2017, 33(5): 162-169. |
| [Ma Huiqin, Huang Wenjiang, Jing Yuanshu, et al. Remote sensing monitoring of wheat powdery mildew based on AdaBoost model combining mRMR algorithm[J]. Transactions of the Chinese Society of Agricultural Engineering, 2017, 33(5): 162-169.] | |
| [25] | Schmid T, Koch M, Gumuzzio J, et al. Applications of hyperspectral imagery to soil salinity mapping[J]. Remote Sensing of Soil Salinization, 2008: 113-139. |
| [26] | Dwivedi R S, Kothapalli R V, Singh A N, et al. Generation of farm-level information on salt-affected soils using IKONOS-II multispectral data[J]. Remote Sensing of Soil Salinization, 2008: 73-90. |
| [27] |
Bouaziz M, Matschullat J, Gloaguen R, et al. Improved remote sensing detection of soil salinity from a semi-arid climate in Northeast Brazil[J]. Comptes Rendus Geoscience, 2011, 343(11-12): 795-803.
doi: 10.1016/j.crte.2011.09.003 |
| [28] |
Eldeiry A A, Garcia L A. Detecting soil salinity in alfalfa fields using spatial modeling and remote sensing[J]. Soil Science Society of America Journal, 2008, 72(1): 201-211.
doi: 10.2136/sssaj2007.0013 |
| [29] |
Frazier A E, Hemingway B L. A technical review of planet smallsat data: Practical considerations for processing and using planetscope imagery[J]. Remote Sensing, 2021, 13(19): 3930, doi: 10.3390/rs13193930.
doi: 10.3390/rs13193930 |
| [30] |
Roy D P, Wulder M A, Loveland T R, et al. Landsat-8: Science and product vision for terrestrial global change research[J]. Remote Sensing of Environment, 2014, 145: 154-172.
doi: 10.1016/j.rse.2014.02.001 |
| [31] |
Drusch M, Del Bello U, Carlier S, et al. Sentinel-2: ESA’s optical high-resolution mission for GMES operational services[J]. Remote Sensing of Environment, 2012, 120: 25-36.
doi: 10.1016/j.rse.2011.11.026 |
| [32] | 杨劲松, 姚荣江, 王相平, 等. 中国盐渍土研究: 历程, 现状与展望[J]. 土壤学报, 2022, 59(1): 10-27. |
| [Yang Jingsong, Yao Rongjiang, Wang Xiangping, et al. Research on salt-affected soils in China: History, status quo and prospect[J]. Acta Pedologica Sinica, 2022, 59(1): 10-27.] | |
| [33] | Hardie M, Doyle R. Measuring soil salinity[J]. Plant Salt Tolerance, 2012: 415-425. |
| [34] |
Aldeghi A, Carn S, Escobar-Wolf R, et al. Volcano monitoring from space using high-cadence planet CubeSat images applied to Fuego volcano, Guatemala[J]. Remote Sensing, 2019, 11(18): 2151, doi: 10.3390/rs11182151.
doi: 10.3390/rs11182151 |
| [35] |
Xie B, Ding J, Ge X, et al. Estimation of soil organic carbon content in the Ebinur Lake wetland, Xinjiang, China, based on multisource remote sensing data and ensemble learning algorithms[J]. Sensors, 2022, 22(7): 2685, doi: 10.3390/s22072685.
doi: 10.3390/s22072685 |
| [36] |
Gorji T, Sertel E, Tanik A, et al. Monitoring soil salinity via remote sensing technology under data scarce conditions: A case study from Turkey[J]. Ecological Indicators, 2017, 74: 384-391.
doi: 10.1016/j.ecolind.2016.11.043 |
| [37] |
Huete A R. A soil-adjusted vegetation index (SAVI)[J]. Remote Sensing of Environment, 1988, 25(3): 295-309.
doi: 10.1016/0034-4257(88)90106-X |
| [38] |
Major D J, Baret F, Guyot G, et al. A ratio vegetation index adjusted for soil brightness[J]. International Journal of Remote Sensing, 1990, 11(5): 727-740.
doi: 10.1080/01431169008955053 |
| [39] |
Liu H Q, Huete A. A feedback based modification of the NDVI to minimize canopy background and atmospheric noise[J]. IEEE Transactions on Geoscience and Remote Sensing, 1995, 33(2): 457-465.
doi: 10.1109/TGRS.36 |
| [40] | Deering D W, Rouse J W, Haas R H, et al. Measuring forage production of grazing units from Landsat MSS data[J]. Remote Sensing of Environment, 1975(11): 1169-1178. |
| [41] |
Khan N M, Rastoskuev V V, Sato Y, et al. Assessment of hydrosaline land degradation by using a simple approach of remote sensing indicators[J]. Agricultural Water Management, 2005, 77(1-3): 96-109.
doi: 10.1016/j.agwat.2004.09.038 |
| [42] |
Bannari A, Guedon A M, El-Harti A, et al. Characterization of slightly and moderately saline and sodic soils in irrigated agricultural land using simulated data of advanced land imaging (EO-1) sensor[J]. Communications in Soil Science and Plant Analysis, 2008, 39(19-20): 2795-2811.
doi: 10.1080/00103620802432717 |
| [43] | Abbas A, Khan S. Using remote sensing techniques for appraisal of irrigated soil salinity[C]//International Congress on Modelling and Simulation. Modelling and Simulation Society of Australia and New Zealand, 2007: 2632-2638. |
| [44] |
Jing X, Zou Q, Yan J, et al. Remote sensing monitoring of winter wheat stripe rust based on mRMR-XGBoost algorithm[J]. Remote Sensing, 2022, 14(3): 756, doi: 10.3390/rs14030756.
doi: 10.3390/rs14030756 |
| [45] | Breiman L. Bagging predictors[J]. Machine Learning, 1996, 24(2): 123-140. |
| [46] | Scudiero E, Skaggs T H, Corwin D L. Regional scale soil salinity evaluation using Landsat 7, western San Joaquin Valley, California, USA[J]. Geoderma Regional, 2014, 2: 82-90. |
| [47] | Spies B, Woodgate P. Salinity mapping methods in the Australian context[M]. Canberra: Department of the Environment and Heritage, 2005: 18-45. |
| [48] | 丁建丽, 姚远, 王飞, 等. 干旱区土壤盐渍化特征空间建模[J]. 生态学报, 2014, 34(16): 4620-4631. |
| [Ding Jianli, Yao Yuan, Wang Fei, et al. Detecting soil salinization in arid regions using spectral feature space derived from remote sensing data[J]. Acta Ecologica Sinica, 2014, 34(16): 4620-4631.] | |
| [49] | 曹雷, 丁建丽, 玉米提·哈力克, 等. 基于国产高分一号卫星数据的区域土壤盐渍化信息提取与建模[J]. 土壤学报, 2016, 53(6): 1399-1409. |
| [Cao Lei, Ding Jianli, Halik Umut, et al. Extraction and modeling of regional soil salinization based on data from GF-1 satellite[J]. Acta Pedologica Sinica, 2016, 53(6): 1399-1409.] | |
| [50] |
Rao B R M, Sharma R C, Ravi Sankar T, et al. Spectral behaviour of salt-affected soils[J]. International Journal of Remote Sensing, 1995, 16(12): 2125-2136.
doi: 10.1080/01431169508954546 |
| [51] | 冯娟, 丁建丽, 杨爱霞, 等. 干旱区土壤盐渍化信息遥感建模[J]. 干旱地区农业研究, 2018, 36(1): 266-273. |
| [Feng Juan, Ding Jianli, Yang Aixia, et al. Remote sensing modeling of soil salinization information in arid areas[J]. Agricultural Research in Arid Areas, 2018, 36(1): 266-273.] | |
| [52] |
Metternicht G I, Zinck J A. Remote sensing of soil salinity: Potentials and constraints[J]. Remote Sensing of Environment, 2003, 85(1): 1-20.
doi: 10.1016/S0034-4257(02)00188-8 |
| [53] |
丁建丽, 伍漫春, 刘海霞, 等. 基于综合高光谱指数的区域土壤盐渍化监测研究[J]. 光谱学与光谱分析, 2012, 32(7): 1918-1922.
pmid: 23016353 |
|
[Ding Jianli, Wu Manchun, Liu Haixia, et al. Study on the soil salinization monitoring based on synthetical hyperspectral index[J]. Spectroscopy and Spectral Analysis, 2012, 32(7): 1918-1922.]
pmid: 23016353 |
|
| [54] | 马国林, 丁建丽, 韩礼敬, 等. 基于变量优选与机器学习的干旱区湿地土壤盐渍化数字制图[J]. 农业工程学报, 2020, 36(19): 124-131. |
| [Ma Guolin, Ding Jianli, Han Lijing, et al. Digital mapping of soil salinization in arid area wetland based on variable optimized selection and machine learning[J]. Transactions of the Chinese Society of Agricultural Engineering, 2020, 36(19): 124-131.] |
| [1] | 蒙慧敏, 占车生, 胡实, 林忠辉. 大型灌区土壤水盐运移模拟研究进展[J]. 干旱区地理, 2024, 47(9): 1566-1576. |
| [2] | 谢俊博, 王兴鹏, 何帅, 刘洋, 忠智博, 李妍, 洪国军. 基于光谱指数建模的沙井子灌区土壤盐分反演[J]. 干旱区地理, 2024, 47(7): 1199-1209. |
| [3] | 石聪, 陈礼瀚, 张怡菲, 何帅, 谢海霞. 新疆小海子灌区耕地土壤盐渍化特征研究[J]. 干旱区地理, 2023, 46(8): 1314-1323. |
| [4] | 蒋磊, 刘小龙, 郭帅, 何亮, 邢建磊, 郭俊杰. 基于Logistic回归分析的土壤盐渍化易发性评价——以新疆南疆塔里木灌区为例[J]. 干旱区地理, 2023, 46(11): 1858-1867. |
| [5] | 赵爽,丁建丽,韩礼敬,黄帅,葛翔宇. 新疆典型盐渍土微波介电特性响应分析与建模[J]. 干旱区地理, 2022, 45(5): 1534-1546. |
| [6] | 代云豪,管瑶,张钦凯,孙峻杰,贺兴宏. 阿拉尔垦区土壤盐渍化遥感监测及时空特征分析[J]. 干旱区地理, 2022, 45(4): 1176-1185. |
| [7] | 赵巧珍,丁建丽,韩礼敬,金晓叶,郝建平. MODIS和Landsat时空融合影像在土壤盐渍化监测中的适用性研究——以渭干河—库车河三角洲绿洲为例[J]. 干旱区地理, 2022, 45(4): 1155-1164. |
| [8] | 王爽, 丁建丽, 王璐, 牛增懿. 基于地表光谱建模的区域土壤盐渍化遥感监测研究[J]. 干旱区地理, 2016, 39(1): 190-198. |
| [9] | 牛增懿, 丁建丽, 李艳华, 王爽, 王璐, 马成霞. 基于高分一号影像的土壤盐渍化信息提取方法[J]. 干旱区地理, 2016, 39(1): 171-181. |
| [10] | 丁建丽,张喆,李鑫,鄢雪英. 中亚土库曼斯坦绿洲土壤盐渍化动态演变评估[J]. 干旱区地理, 2013, 36(4): 571-578. |
| Viewed | ||||||||||||||||||||||||||||||||||||||||||||||||||
|
Full text 74
|
|
|||||||||||||||||||||||||||||||||||||||||||||||||
|
Abstract 219
|
|
|||||||||||||||||||||||||||||||||||||||||||||||||
Cited |
|
|||||||||||||||||||||||||||||||||||||||||||||||||
| Shared | ||||||||||||||||||||||||||||||||||||||||||||||||||
|
||